INTRODUCTION
Skin is the largest thermoregulatory organ in the body and the most exposed to the environment enabling it to play a major role in homeothermy [1,2]. It ensures body protection against the assaults of harsh environmental effects and epidermal defense against microbial invasion and mechanical damage [3,4]. Heat adaptation or maintenance of homeothermy is the ability to maintain thermal stability under heat stress. Direct effects of heat stress on animal agriculture are detrimental to productivity and animal well-being [5–7]. Studies have shown that temperature/vapor pressure gradient in the immediate environment of an animal will determine the rate of the heat transfer from the animal to its environment [7–9]. Heat stress impairs female fertility in Holsteins (Bos taurus) and buffalo (Bubalus bubalis), decreasing herd reproductive efficiency [10–12] and is estimated to cause severe economic losses of nearly US$ 1 billion annually [13]. This affects nearly 60% of the cattle in the world, with reduced rate of conception during the summer, which depends on the degree of thermal stress [14–16].
Over 60% of domestic cattle population is in the tropics and subtropics with deleterious heat stress implicated in reduced productivity [17–19]. Mitochondrial and nuclear DNA analysis show that the humped cattle of Indian origin (Bos indicus or zebu cattle) and the generally humpless cattle of Europe and Africa (Bos taurus) shared a common ancestor between 110,000 and 850,000 years ago [20–22]. Zebu cattle have evolved superior thermotolerance and are able to better tolerate heat effects on production performance such as growth rate, milk yield and reproductive ability [23]. Physiological responses like high respiration rate and increased blood flow with often deleterious effects on cow productivity [14,17], are substantial and prolonged in Bos taurus than in Bos indicus [10,14,23,24], hence the consequences of exposure to heat stress for production of milk and meat are less pronounced in the latter [11,23]. This supports significant variability between Bos indicus and Bos taurus cattle in their heat stress responses, which could be explored to better understand the genetic basis of heat adaptation in cattle.
To better understand genomics of bovine skin thermoregulation, we examined the transcriptional profiles of bovine skin in two different breeds of ecologically-adapted and geographically separated cattle species (Bos indicus and Bos taurus) using RNA-seq and validated the study by evaluating expression of 6 genes in brain, heart, liver, kidney, skin, and muscle using quantitative PCR (qPCR).
MATERIALS AND METHODS
Skin tissues of White Fulani (WF), representing tropically adapted cattle were obtained from the abattoir in Lafenwa, Ogun State of Nigeria while that of Angus (AG) and Holstein (HO) representing temperate cattle were obtained from a slaughterhouse in Pennsylvania, USA. Both samples were collected during summer. The skin tissues (two per breed) were matched for age, gender and physiological status (non-pregnant, non-lactating and not under veterinary care) and preserved in RNALater (Ambion, TX) to preserve RNA integrity.
Total RNA was isolated from the skin samples using TRIzol method (Invitrogen, CA) following the manufacturer’s instructions. About 30 mg skin tissue was homogenized in separate tubes and treated with DNase to remove the genomic DNA. Then 30 µL of RNase-free water was used for final elution to increase the concentration of RNA which was later used for mRNA library preparation. RNA concentration and quality were measured using Agilent 2100 Bioanalyzer and single-read libraries of 36 bp were prepared for 6 individuals, 2 per breed (WF, AG and HO).
The Illumina libraries were prepared with 10 μg of the total RNA and were heated to 65°C for 5 min; thereafter the mRNA was isolated using 100 μL of Dyna Oligo (dT) beads. This step was repeated to ensure the complete removal of genomic DNA, ribosomal RNA and other contaminating RNAs. Double-stranded cDNA was synthesized with SuperScript II Reverse Transcriptase and random hexamer primers. The cDNA was purified with QIAquick PCR spin columns and adapters were ligated to the DNA fragments using Quick T4 DNA Ligase at room temperature for 15 min. After the ligation of the adapters, 10 μL of sample was run in 2% agarose gel in 1X TAE buffer and visualized on a Transilluminator. Thereafter, a 250 bp DNA band was excised and purified with QIA quick Gel Extraction kit with a final elution of 30 μL. The purified cDNA was used for PCR reactions and sequencing on the Illumina HiSeq 2000 Genome Analyzer.
The quality of the sequence reads was assessed through FastQC (version 0.9.1) (http://www.bioinformatics.bbsrc.ac.uk/projects/fastqc/) which is based on per base sequence quality, quality score, base N count and over-represented sequences. FastX tool kit was used to scan through the reads and bases of less than 20 quality scores were trimmed off the rest of the reads. The sequence adapter at the end were removed through the fastQ clipper. Bowtie (version 0.12.7) was used to align the fastq output reads from the fastX tool kit after quality trimming and clipping to the bovine genome (Ensemble version 70) according to Langmead et al. [25]. Integrated Genome browser (IGV) was utilized to examine the sequence alignment reads and their distribution on the bovine genome.
Differential gene expression was determined based on the number of reads that aligned to a gene and the length of transcripts [26]. The EdgeR of Bioconductor package (version 1.6.12) was used to identify genes that were differentially expressed according to the method of Robinson et al. [27]. Benjamini-Hochberg false discovery rate (FDR) [28] was used to examine exons and genes that were differentially expressed with a fold change of ≥ 2 and p-value of < 0.05.
Gene Ontology (GO) analysis was performed using GOseq which identified the GO terms that were significantly over-represented. The identified GO terms were regarded significant at a FDR of < 0.05 and multiple hypothesis testing [28] was carried out to identify categories that are significantly enriched using a 0.05 FDR as the cut off [29,30]. Pathway analysis was carried out to identify the enriched pathways by significantly differentially expressed genes (p < 0.05).
Due to the numerous genes identified in this study, six genes from those that were significantly differentially expressed in the RNA-seq analysis were selected for validation and comparative gene expression in different bovine tissues from animals in the two climatic regions using qPCR. These gene sets have been reported to be significant involved in skin pigmentation, metabolism pathway, trans-epidermal water loss and we thought could play a significant role in thermoregulation. Specific primer pairs of genes were designed through Primer Express™ Software v3.0.1 (https://www.fishersci.se/shop/products/primer-express-software-v3-0-1) to amplify products of 80–120 bp with an optimal melting temperature of 60°C and a GC content between 50% and 60%. The primer pairs and their sequences are shown in Table 1. Genes of interest were tryptophan 2,3-dioxygenase (TDO2), arachidonate 12-lipoxygenase epidermal-type (ALOX12E), synaptotagmin 4 (SYT4), ribosomal protein 23 (RPS23), carboxylesterase 1 precursor (CES1) and beta-casein casoparan anti-oxidant peptide casohypotensin (CSN2). Glyceraldehyde-3-phosphate dehydrogenase (GAPDH) and beta actin (ACTINB) genes were selected as endogenous references in each sample [31,32]. Total RNA was extracted from bovine tissues and treated with DNase. A total three animals per breed were sample (n = 12). Briefly, triplicate tissue samples (30 mg) from bovine brain, heart, liver, kidney, skin and muscle were individually ground using a Qiagen Tissue Lyzer II and total RNA extracted using TRIzol/Chloroform protocol (Life Technologies, USA), according to instructions from the manufacturer. The total RNA was DNase-treated prior to reverse transcription and purified using Qiagen RNeasy Minikit (Qiagen Inc, Carlsbad CA). The quantity, quality and integrity of RNA samples were assessed by Qubit® 2.0 Fluorometer (Life Technologies, USA) and gel electrophoresis. Reverse transcription of RNA was performed on the same pool of cDNA for testing specific primer pairs for the six genes and the two housekeeping genes. Briefly, cDNA was synthesized in 20 μL reaction volumes using Oligo-dT primers and iScriptTM cDNA Synthesis Kit (Bio-Rad, USA), according to manufacturer’s recommendation for reverse transcription of mRNA. The reaction mixture was gently mixed and incubated at 37°C for 1 hour. The reaction was finalized by heating the mixture at 70°C for 10 minutes and chilled on ice. The integrity of the cDNA was examined on 1.5% agarose gel electrophoresis. Specific primer pairs (Table 1) were used for each reaction. This was followed by qPCR cycling conditions following the standard protocol. To perform the assays, all cDNA samples were diluted to 4 ng/μL. The samples were stored at − 80°C until further use.
qPCR was performed using SYBR Green® detection chemistry. For each gene, the samples were run in a 96 well plate on a CFX96 Touch™ Real-Time PCR Detection Systems (Biorad, Carlsbad, USA). PCRs were performed in 10 μL total volume per well containing 5 μL of 2X iQTM SYBR® Green Supermix (Biorad, Hercules, CA, USA), 1 μL of cDNA (0.05 μg of RNA equivalents), 0.5 μL (10 μM) of each gene-specific primer and 3 μL of DNase-free H2O. qPCR cycling conditions were followed using the manufacturer’s protocol (Biorad, Hercules, CA, USA). PCR products representative of each amplification assay were run on 1.5% agarose gels to check the specificity of the amplified fragment. This yielded a single correct sized band. For melt curve analysis, varying temperatures from 65°C to 95°C with increments of 0.5°C for 5 seconds and continuous fluorescent measurements were used. The absolute number of target molecules was calculated and dilution series was generated for each gene, starting from 2.09 × 10⁷ molecules/μL of the purified cDNA target region of each gene, and diluted down to 2.09 × 101 using 7-fold serial dilutions with nuclease-free water (Sigma-Aldrich, St Louis, MO, USA) with an initial concentration of 4 ng/μL, in triplicate. The standard curve was run in the same 96-well plate with the experimental samples. The relative amount of all mRNAs was calculated using the comparative 2−ΔΔ Cq method. Three biological replicates and two technical replicates per biological replicate were performed for each experiment as described [33].
RESULTS
A total of 214, 754,759 (approximately 53,688,689 reads per sample) reads were generated from the Illumina HiSeq 2000 sequencer. Quality filtering was carried out to remove adapter sequences, PCR duplicates and reads shorter than 20 bp or bases with quality scores less than 20. About 25,633,028 reads failed to meet the quality filtering criteria and were dropped leaving about 189,121,731 (approximately 47,280,432 reads per sample) reads used in the alignment process. The number of reads aligned to the bovine genome with 2 bp mismatch using Bowtie and the mapping accuracy are presented in Table 2. In order to ascertain the quality score of the bases after quality trimming and clipping, a box plot was generated by using the command-line version of the fastX tool kit as shown in Fig. S1. After the alignment, the binary alignment map (BAM) files were visualized using IGV and results obtained through visual observation showed that majority of the sequence reads aligned to the coding regions of most genes in the bovine genome, with only very few misaligning to introns and intergenic regions and heaps of reads were observed at certain positions in the genome without any gene being annotated to those regions (Fig. S2). Collectively, 189,090,571 reads were successfully aligned to the bovine genome with an average of 47,272,642 reads per sample with 31,160 reads failing to align to the bovine reference genome (Ensemble version 70).
Results obtained from the analyses using HTSeq classified 43,375,516 reads as no feature [reads which could not be assigned to any feature (gene)], 83,893 reads as ambiguous (reads which could have been assigned to more than one gene and hence were not counted) and 72,637,684 reads as non-unique alignments (reads with more than one reported alignment) with 72,993,478 reads (approximately 18,248,369 reads per sample) mapping to unique regions/locations in the bovine genome.
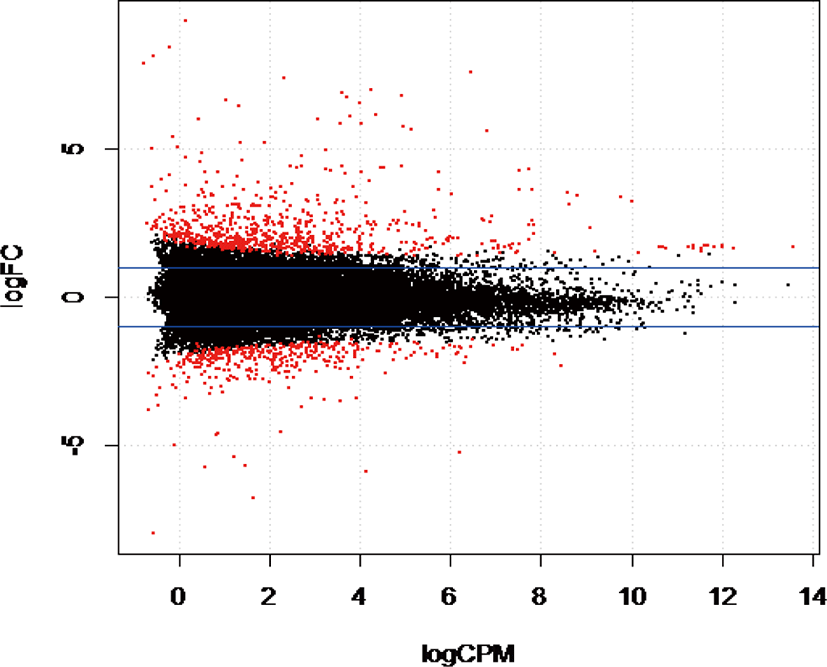
The gene coverage based on the number of reads mapped to a unique region in the reference bovine genome indicated that 13,130 genes (53.34%) had more than one count per million reads from two libraries and were considered suitable for downstream analyses. Statistical analysis using EdgeR indicated 255 genes were differentially expressed (DE) out of 13,130 genes identified in this study (adjusted p-value ≤ 0.05). We found that 98 genes were upregulated, and 157 genes were downregulated in WF (Fig. 1) in WF. Compared to AG and HO, the most significantly upregulated genes in WF based on p-values included carboxylesterase 1 precursor [CES1], beta-casein casoparan antioxidant peptide casohypotensin [CSN2], tryptophan 2,3-dioxygenase [TDO2], arachidonate 12-lipoxygenase epidermal-type [ALOX12E], while the most significantly down regulated genes in WF were tetraspanin 10 [TSPAN10], synaptotagmin 4 [SYT4], ribosomal protein 23 [RPS23], cell-death-inducing DFFA-like effector C [CIDEC], tyrosinase-related protein 1 [TYRP1], adinopectin, CIQ and collagen domain [ADIPOQ].
Results obtained from the GOSeq after correcting for transcript length bias reported 31 functional annotations classified as either cellular component (CC), biological process (BP) or molecular function (MF), and included among the list of functional classes were extracellular matrix [CC] (GO:0031012), melanin metabolic process [BP] (GO:0006582), proteinaceous extracellular matrix [CC] (GO:0005578), inflammatory response [BP] (GO:0006954), defense response (GO:0006952), calcium ion binding (GO:0005509), response to wounding [BP] (GO:0009611), response to external stimulus [BP] (GO:0009605) and calcium ion binding [MF] (GO:0005509) shown in Table 3. Similarly, the pathway analysis identified 15 pathways that were significantly enriched which include: Cytosolic DNA-sensing pathway (Fig. S3), complement and coagulation cascades pathway (Fig. S4), peroxisome proliferator-activated receptors (PPAR) signaling pathway (Fig. S5), arachidonic acid metabolism (Fig. S6), extracellular matrix (ECM) receptor interaction (Fig. S7), tyrosine metabolism (Fig. S8), melanogenesis (Fig. S9) and drug metabolism-cytochrome P450 (Fig. S10). Table 4 shows the complete list of top enriched KEGG pathways.
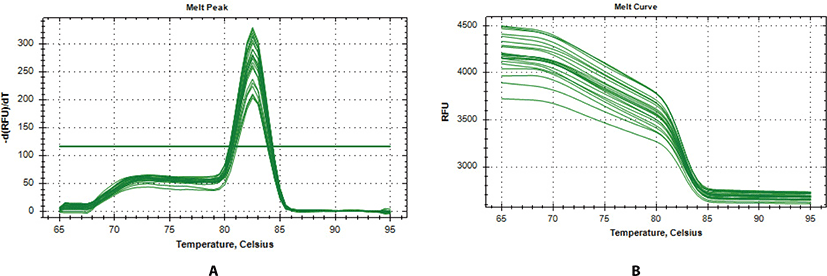
In further analysis, six genes (TD02, SYT4, CSN2, CES1, ALOX12E, and RPS23) were selected as a subset differentially expressed for qPCR validation. The genes were selected according to their patterns of expression, functional enrichment and pathway analysis results. The expression of these genes was evaluated in two representative Bos taurus and Bos indicus animals from hot climate (N’dama, ND, and WF) vs animals from cold climate (AG and HO). From Fig. 2a, the melt-curve showed a single PCR product for all tested genes while Table 5 showed the comparison of the RNA-seq and qPCR expression analysis. From Table 5, the RNA-seq analysis correlated significantly with the qPCR results based on the transcript numbers (p-value < 0.001). Generally, the results of our RNA-seq experiment were confirmed by the qPCR analysis, demonstrating the accuracy and consistency of the RNA-seq experiment.
Overall, the range of mRNA expression from the qPCR method in this study was very broad (Table 5). Among the six genes, CES1 had the greatest mRNA expression (144.19-fold change) in WF followed by SYT4 with 106.29-fold change while the smallest relative normalize expression for most genes in this study are in the range of 0.01 to 7.35-fold difference (Figs. 3–5). Fig. 6 shows the heat map of the mRNA expression of six genes using hierarchical cluster of log2 from the relative normalized expression of TD02, SYT4, CSN, CES, ALOX12E, and RPS23 genes in bovine skin transcriptome. The relative normalized expression falls within the range of –7.17 and 7.17 N-fold change for all the genes. No significant change is observed in the regulation of all the six genes in AG cattle as the relative normalized expression ranges from 0.95 to 2.02 for all genes. Only RPS23 had a higher normalized expression value of 8.07. ALOX12E, CES1, RPS23 and TD02 are all downregulated in HO cattle with a fold change of 0.01, 0.02, 0.00, and 0.01 respectively (Fig. 5). However, RPS23 and TD02 are significantly downregulated with a regulation value of –177.58 and –175.31. SYT4 is the only gene observed to be upregulated in HO cattle in this study with a fold change of 7.35 while there is no change in the relative normalized expression of CSN2 (1.64) (Fig. 5). As shown in these results, all 6 genes in our study were significantly upregulated in ND and WF with CES1 on top of the list followed by SYT4 and CSN2 with 144.19-fold change, 106.29-fold change and 100.89-fold change respectively. RPS23 had the highest relative normalized expression in ND while SYT4 is the least with 35.75-fold change and 6.98-fold change respectively. The extreme variation in mRNA expression in this study strongly suggests that heterogeneity in gene expression may be correlated with cattle adaptation in different geographical locations and climatic regions.
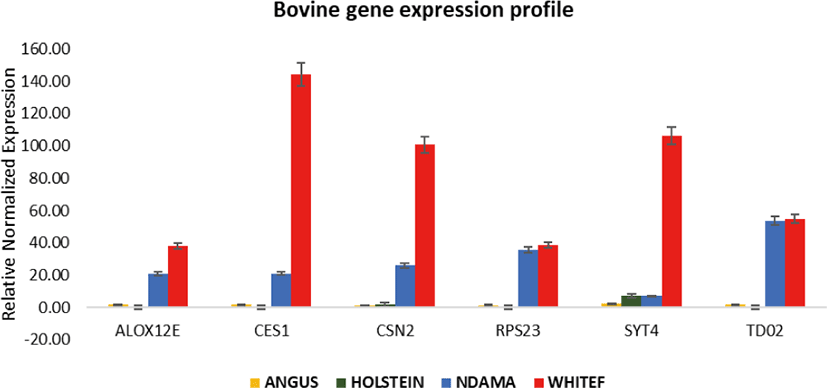
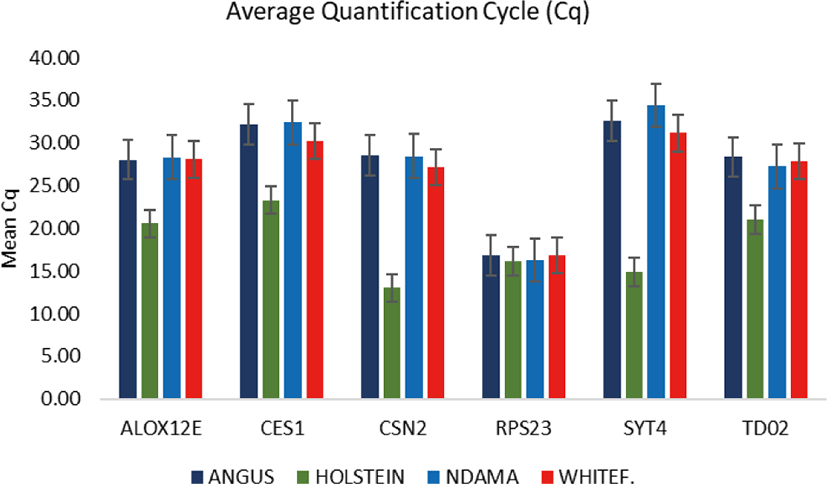
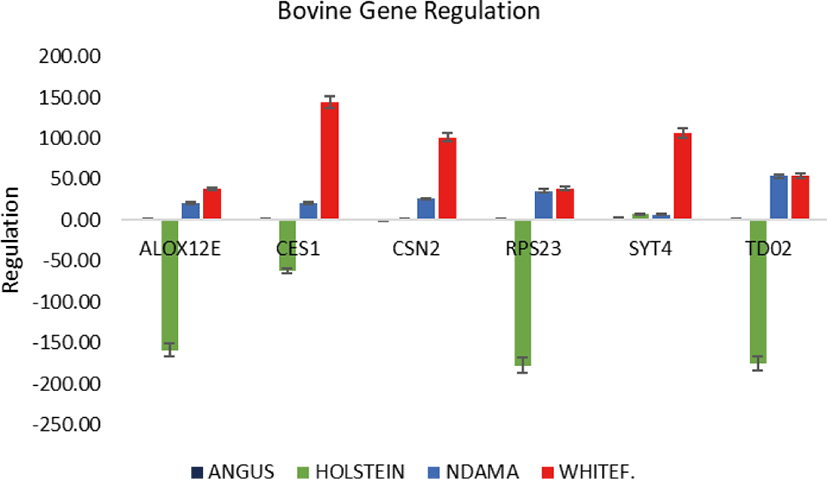
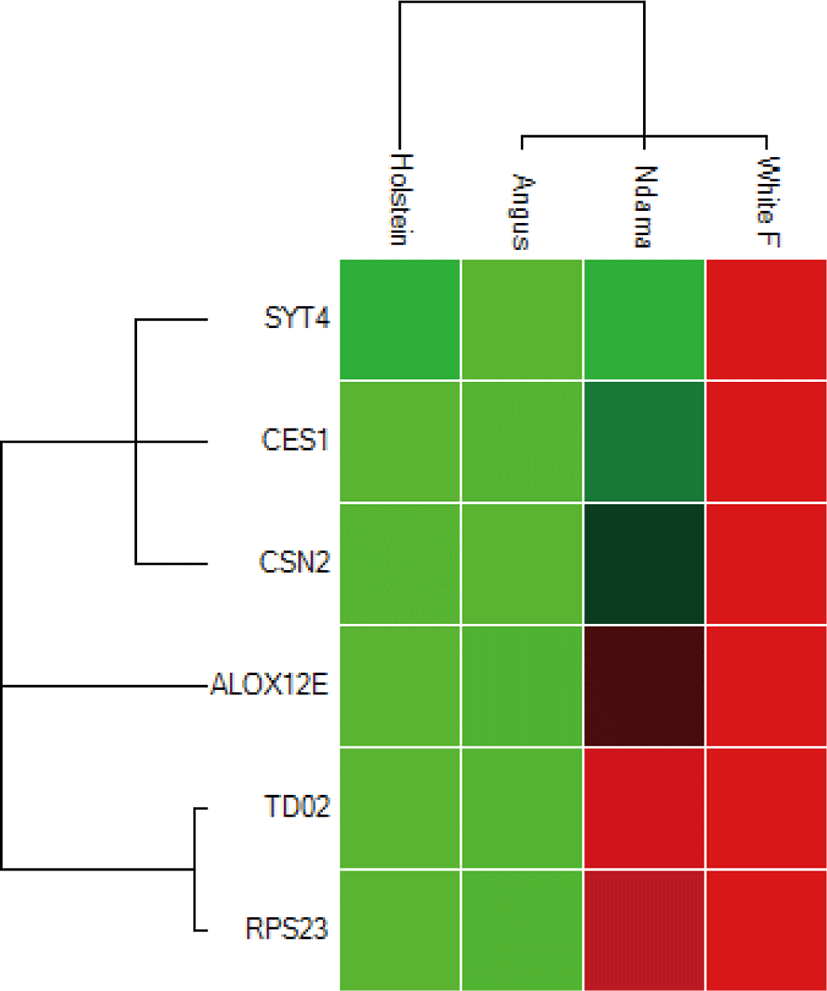
Comparison of the four breeds from cold and hot climates showed a significantly higher expression of RPS23 and CES genes (p < 0.001) in WF, ND, and AG, but were significantly down-regulated in HO cattle. On the other hand, SYT4 was significantly (p > 0.05) down-regulated in AG, HO, and ND cattle but upregulated in WF. Similar closer relatedness exists in the expression of SYT4, CES1, and CSN2 than between TD02 and RPS23 as well as in the expression patterns of TD02 and RSP23 while ALOX12E showed an indirect relationship in its expression patterns with other genes. The clustergram also shows the relatedness among the four breeds of animals based on the level of mRNA expression of the genes under study. WF, ND, and AG are more closely related compared to HO cattle based on their gene expression profiles. Overall, the results of our study were reasonably consistent with the expression patterns in the bovine skin transcriptome profiling using RNA-seq.
DISCUSSION
Our results showed that more genes were significantly downregulated in WF than upregulated. Functional analysis identified 3 biological processes that were significantly enriched with genes that are associated with immune response: GO:0009611 (response to wounding), GO:0006952 (defense response) and GO:0006954 (inflammatory response), while the pathway analysis using KEGG identified two pathways: Cytosolic DNA-sensing pathway and complement and coagulation cascades. In the cytosolic DNA-sensing pathway, 3 differentially expressed genes (inhibitor of nuclear factor kappa-B kinase subunit epsilon; IKBKE, C-X-C motif chemokine 10; CXCL10 and retinoic acid-inducible gene 1; RIG-1) were identified to be upregulated in WF (Bos indicus) compared to AG (Bos taurus), plausibly affecting the cytosolic DNA-sensing pathway [34,35]. The cytosolic DNA-sensing pathway is influenced by viral invasion that triggers immune responses mediated by a pattern-recognition receptor. The results lead to the production and secretion of cytokines and interferons [36,37].
We identified F3 gene [coagulation factor III (thromboplastin, tissue factor, TF)], belonging to the extrinsic pathway as significantly upregulated while other genes [tissue plasminogen activator (PLAT), protein S (PROS1), endothelial plasminogen activator inhibitor (SERPINE1), thrombomodulin (THBD) and von Willebrand factor (vWF)] involved in intrinsic pathway of the coagulation cascades and alternative pathway (complement component 7 (C7), complement factor B (CFB), complement factor D gene (CFD) of the complement pathway were observed to be downregulated and with only CFB having a fold difference greater than 2 (PLAT, SERPINE1, C7 and CFD have fold difference less than 2 but greater than 1.5) [35]. The increased expression of TF, potentially in response to vascular injury could be adduced to the prevailing free-ranged management system adopted by WF cattle herdsmen with increased susceptibility to skin injuries caused by the presence of large prominent horns and the possibility of less aggressive ones sustaining more injury, given the limited space during grazing and transportation. Unexpectedly, genes involved in both the intrinsic pathway and the alternative pathway were downregulated in WF. Genes such as vWF are involved in platelet aggregation [38] while SERPINE1 and PLAT genes were reported to be essential components of the proteolytic cascade that lyses blood clots [39,40] and their downregulation suggest an impairment of the coagulation cascade pathway. Other genes such as platelet derived growth factor D (PDGF-D) and vascular growth endothelial factor D (encoded by VEGF-D gene) were also found to be significantly downregulated in WF (fold change > 2) but not implicated in the complement and coagulation cascades. PDGF-D is known to play a role in wound healing through the recruitment of macrophages [41] while VEGF-D is crucial to the induction of strong angiogenesis in addition to lymphangiogenesis in the rabbit hind limb muscle [42]. Therefore, the observed downregulation of VEGF-D, PDGF-D, PROS, THBD, and VWF genes in WF may be suggestive of impairment of the wound healing and angiogenic processes post-injury, given the existence of PROS deficiency-mediated blood clotting disorder [43].
Similarly, ALOX12E, involved in the oxygenation of arachidonic acid to 12-H(P)ETE and essential in epidermal barrier formation, has been associated with an increase in trans-epidermal water loss in Alox12 deficient mice [44]. Therefore, the significant upregulation of ALOX12E in WF could be indicative of the need to retain more water to avoid dehydration, an adaptive feature crucial to its survivability in tropical environments. Predictably, melanin metabolic process and melanosome membrane process have been identified in the GO classes. Therefore, as expected, pathway analysis identified melanogenesis and tyrosine metabolism as significantly enriched pathways and both are related to skin pigmentation. In this study, agouti signaling protein (ASIP), melanocortin 1 receptor (MC1R), TYRP1, TYRP2 and TYR were all significantly downregulated in WF compared to taurine cattle with TYRP1 fold change (–6.379) being highest. TYRP2, also known as dopachrome tautomerase (DCT), and a product of the slaty (Slt) locus, catalyzes the tautomerization of dopachrome to dihydroxyindole-2-carboxylic acid (DHICA) [45]. Oxidative polymerization of dihydroxyindole (DHI) is catalyzed by tyrosinase [46], while oxidation of DHICA appears to be catalyzed by TYRP1, the brown (B) locus protein [47]. Taken together, TYRPs activities affect the production of eumelanin. Given that the skin pigmentation of WF is white while that of Angus is black, these coat color descriptors clearly evolved through molecular adjustments to maximize adaptation to extremes of climate. ASIP, the physiological regulator of MC1R, has been reported to reduce the total amount of melanin in vitro [48], with its increased expression uncorrelated with the presence of pheomelanin levels in melanocytes [49,50]. Therefore, one could hypothesize that the observed downregulation of MC1R in this study, known to strongly influence tyrosinase production and by extension determine the ratio of eumelanin and pheomelanin in the skin, could be mediated by ASIP downregulation. In other words, the increased mRNA level of MC1R observed in AG compared to WF could be suggestive of increased tyrosinase production given the recent observation that the presence of the dominant black allele (ED) activates the melanocyte stimulating hormone (MSH) receptor leading to the increased formation of more eumelanin in the melanocytes as reported in AG and HO cattle breeds [51]. This in part could be responsible for the darkish skin coloration of AG.
The main goal of this aspect is to validate subset of the identified differentially expressed genes in bovine skin transcriptome from our earlier RNA-seq experiment and possibly establish these genes as heat adaptation candidate genes for further studies. The mRNA expression patterns of the 6 genes examined in this study showed a wide range suggesting that qPCR is a highly sensitive method, with ability to detect expression differences from less than 0.01-fold to more than 100-fold. Reassuringly, results from the current study show that the differential expression patterns for these six genes are like those reported in our initial RNA-seq experiment [52]. Expression patterns of 4 genes that were most significantly upregulated in WF from RNA-seq profiling (CES1, CSN2, TDO2, and ALOX12E) also showed similar results in WF in our qPCR analysis. Surprisingly, the qPCR analysis showed that SYT4 which was previously reported to be downregulated in RNA-seq bovine transcriptome is significantly upregulated in WF but downregulated in AG. CES1, CSN2, TDO2, and ALOX12E that were previously reported downregulated in AG are now confirmed to be down-regulated, showing no change in differential expression in this study. Altogether, these results by RNA-seq and qPCR indicates a consistency in the observed differential expression patterns. More interestingly, these observations support a molecular genetic basis for differences in thermotolerance between Bos indicus and Bos taurus [53–55], among WF and ND from tropical climes compared to AG and HO from temperate climes. The totality of these results provides a strong association between individual genetic individual differences and heat adaptation at the cellular level [56–58].
Downregulation of gene expression in animals from cold climates (AG and HO) suggest that these genes may be associated with heat adaptation in WF and ND in hot climates, in whom the genes are upregulated. The highest expression of most of these genes found in WF may exemplify why this breed is well-adapted to hot climates where it thrives compared with other breeds. Relative degrees of downregulation in temperate breeds suggest that AG may have better heat adaptation compared to HO, suggesting that AG can still cope with some degree of heat stress than HO. This is supported by previous reports that thermoregulatory processes are impaired in Chinese Holstein cattle exposed to high ambient temperature [7,55,59]. This leads to reduction in milk production and lowered reproduction rate. Other corroborative studies of genome-wide association of heat stress in cattle further support these differences [60,61].
Furthermore, Bos taurus in this study (ND and HO) showed similar expression patterns suggesting lower adaptation to heat compared to their Bos indicus counterparts, which have been confirmed by studies on body temperature of beef cattle during climatic stress [17,60,61]. Moreover, the mRNA expression of these genes show that WF, ND, and AG are more closely related compared to HO suggesting better adaptation to hot climate than HO. Overall, the differential expression profiles of these genes in the two groups provide some insight for future selection and breeding of heat-adapted animals that can cope with the changing climate arising from climate change.
Carboxylesterase 1 precursor (CES1) belong to a family of serine esterases with important role in the metabolism of numerous chemicals in the liver cell endoplasmic reticulum lumen [62]. Carboxylesterases have broad overlapping specificity due to a large conformable active site. The family members are responsible for the hydrolysis or transesterification of various xenobiotics and endogenous substrates with ester, thioester, or amide bonds. Among other functions, they participate in fatty acyl and cholesterol ester metabolism, and may play a role in the blood-brain barrier system. This enzyme is the major liver enzyme [55,63]. CES1 role in fat metabolism suggest a form of heat generation in the body of the animal. Also, its activity in the liver supports the liver’s thermoregulatory function. Our study showed that CES1 is the most upregulated gene and its expression profile is higher in cattle from hot climate especially in WF. This could suggest a role in thermoregulation and adaptation to heat stress. Given the characteristic pastoral nomadic management system under which WF and ND cattle are raised in the tropics, coupled with absence of highly nutritious diet, the significant upregulation of CES1 gene might be consistent with the need to generate more fatty acids, which when oxidized, could be a useful source of energy for skin cellular activities.
Beta-casein casoparan anti-oxidant peptide casohypotensin (CSN2) plays an important role in determination of the surface properties of casein micelles [64]. Casoparan acts as a macrophage activator, increasing the phagocytic activity of macrophages and peroxide release from macrophages. Casohypotensin acts as a bradykinin-potentiating peptide and induces hypotension in rats because it acts as a strong competitive inhibitor of endo-oligopeptidase A [65]. The peptide has antioxidant activity (that is, any process that results in a change in state or activity of a cell or an organism in terms of movement, secretion, enzyme production, gene expression, etc.) as a result of a heat stimulus, a temperature stimulus above the optimal temperature for that organism [66]. Therefore, the significant upregulation of CSN2 in WF and ND cattle could indicate their need for energy to maintain cellular activities in response to heat stimulus from the environment, facilitating their survivability in the hot climates. Similarly, ALOX12E involved in the oxygenation of arachidonic acid to 12-H(P)ETE and essential in epidermal barrier formation, has been associated with an increase in trans-epidermal water loss in Alox12e deficient mice [63,67]. The significant upregulation of ALOX12E in tropical WF and ND compared with their temperate counterparts could indicate a requirement to retain more water to avoid dehydration, an adaptive feature important to thriving in in tropical environments. To this end, ALOX12E is a potential candidate gene for in metabolic heat adaptation to the tropics.
Tryptophan 2,3-dioxygenase (TDO2) is a gene which encodes a heme enzyme that plays a critical role in tryptophan metabolism by catalyzing the first and rate-limiting step of the kynurenine pathway [67,68]. It is a homo tetrameric heme containing cytosolic enzyme and is expressed at high levels in the liver [69,70]. Increased activity of the encoded protein and subsequent kynurenine production may also play a role in cancer through the suppression of antitumor immune responses, and single nucleotide polymorphisms in this gene may be associated with autism in human [68,70,71]. In contrast, little is known about the effect of TDO2 expression on the immune response in animals. Therefore, the upregulation of TDO2 expression levels in WF and ND cattle observed in our study suggest the presence of viral pathogens on their skin above a threshold capable of eliciting an immune response owing to free-range management system which leads to an increased exposure to pests and diseases compared to AG and HO. This tendency may increasingly provoke immune responses making them better adapted to infestation by pests and diseases in the tropics.
Synaptotagmin 4 (SYT4) serves as a postsynaptic Ca2+ sensor to release retrograde signals that stimulate enhanced presynaptic function through activation of the cyclic adenosine monophosphate (cAMP)-cAMP-dependent protein kinase pathway [72]. Postsynaptic Ca2+ influx also stimulates local synaptic differentiation and growth through Syt 4-mediated retrograde signals in a synapse-specific manner. It plays a role in dendrite formation by melanocytes. The synaptic vesicle protein synaptotagmin 1 (Syt 1) is the major Ca2+ sensor for vesicle fusion at presynaptic terminals but is not localized post synaptically [72,73]. The biological relationship of this gene to heat adaptation is not clear and deserves further investigation.
CONCLUSION
RNA-sequencing, a revolutionary tool designed for transcriptomic profiling was used to analyze bovine skin transcriptome and was able to identify 256 differentially expressed genes between tropically adapted WF and temperate adapted AG. Functional and pathway analysis identified myriad molecular pathways and functional processes perturbed in the skin of these geographically separated subspecies of cattle and some GO classes implicated include: response to inflammation, defense, and wounding, external stimulus, ECM, calcium ion binding etc while pathway analysis identified ECM-receptor interaction, mellanogenesis, tyrosine metabolism, PPAR signaling pathway etc. These functional differences may have been finely sculpted by evolutionary forces to enhance fitness in their respective ecological habitats. We further validated six identified genes that may be involved in heat adaptation in cattle from temperate and tropical climates using qPCR. Expression differences were detected by contrasting the two types of cattle. Our results confirm that each of the six genes evaluated are significantly expressed in bovine thermoregulatory organs with different levels of expression among breeds. The magnitude of expression differences observed in this study suggest that these genes may be potential heat adaptation candidate genes for further studies. An excellent future consideration would be to associate the expression of these genes with the skin morphology of the individual animal.
