INTRODUCTION
Genomic selection is a useful way to enhance economically important traits in domestic animals. Previous studies showed that using reference populations with abundant markers and a large size increases the prediction accuracy of estimated breeding value (EBV) [1]. However, in small size of reference population, obtaining an appropriate reference population comprising individuals of the same breed is difficult, leading to low accuracy of predictions. As an alternative approach, use of an admixed population including the target population as a reference has been recommended [2,3]. Such admixed populations can be used as a reference when breeds are defined as their link by genotypes. When the reference population comprises a breed that is distinct from the test population, they must be genetically related, rather than related by pedigree. Genetic markers can explain the relationships among all individuals in a genomic relationship matrix. In addition, with greater linkage disequilibrium (LD), the prediction accuracy of EBV should increase [4-6]. In this point of view, this study was performed to determine the prediction accuracy of EBV using an admixed reference population consisting of crossbred Korean native pig and Landrace pigs (CB).
MATERIALS AND METHODS
In accordance with the ethical guidelines, a total of 1,289 pigs (695 Berkshire [BS] and 594 cross breed (CB) blood samples were collected by veterinarians and were genotyped using a Porcine 60K SNP chip (Illumina, San Diego, CA, USA) (Table 1). These samples were provided by the National Institute of Animal Science (Jeonju, Korea); 25 KNP and 20 Landrace purebred samples were also provided to confirm the genetic relationships. Quality control (QC) was performed on each population; 41,594 and 39,002 BS and CB single nucleotide polymorphisms (SNPs) remained after QC (missing chromosomes with 11,166 and 4,214 markers, minor allele frequency less than 1% with 359 and 5,606 markers, missing genotypes over than 10% with 10,030 and 433 markers for BS and CB, respectively) and were merged to yield a single admixed population (Table 1). After merging, with in common and overwrapped markers, 45,875 SNPs remained. The phenotypes of the 1,289 animals were measured (backfat thickness [BF], carcass weight [CWT], muscle pH at 24 hours after slaughter [pH], and shear force [SF]). The sex and slaughter age of all animals were recorded in the phenotype measurement processes.
The population structure was evaluated, and association studies were conducted to enable further analyses. Visualization of the population structure is useful to determine genetic relationships among breeds. Using each 20 samples genotype information from each BS, CB, Landrace, and KNP populations, principal component analysis (PCA) was performed to generate clusters, determine any shared principal components, and detect any incorrectly classified individuals. Furthermore, plots of LD by distance, within populations and among breeds, were generated. A GWAS of the traits of interest was performed for genetic comparison between the CB and BS, and to determine any significant loci or LD relationships. The GWAS was performed based on a mixed linear model generated using GCTA software (ver. 1.25.3 [7]). Bayesian mixture model was created using the BayesR program (default option with 0, 0.0001, 0.001, 0.01 effect sizes of mixture; 50000 MCMC chain; 20,000 burnin; 10th thin interval). Proportion of variance for specific SNP was calculated as follow:
Information on the genetic contributions to traits was obtained from a previous study [8]. The PCA, LD analysis, and data processing were performed using PLINK 1.9 [9] and R software (R Development Core Team, Vienna, Austria) [10]. Data were visualized in the R environment.
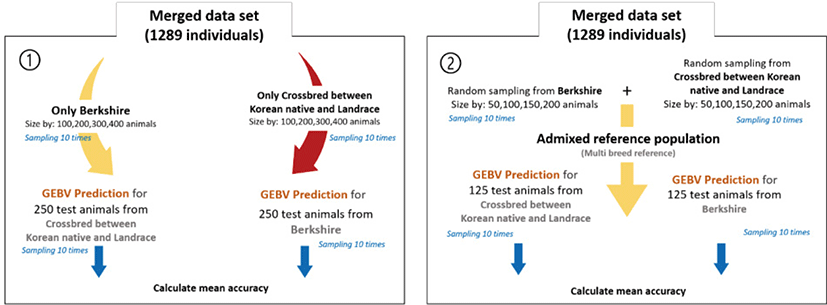
To compare the prediction accuracy of breeding value between single-breed and admixed reference populations, both the reference and test animal data sets were randomly sampled 10 times each. There is no intersect animals among test and reference population. The GEBV predictions were performed using all test and reference set combinations, and mean accuracy was assessed according to the size of the reference population. Prediction accuracy using a single-breed reference population was determined for each breed (250 test animals each) by reference population size (100, 200, 300, or 400 animals) (Fig. 1). For the analysis involving the admixed reference population, the reference population size was the same as in the previous scenario. Admixed reference included each breed with an equal ratio. 125 individuals were randomly selected from each of the two breeds as test animals.
A genetic relationship matrix was built using GCTA (ver. 1.25.3 [7]) and ASReml 4.1 [11] was used for genomic prediction. The model used in this study was as follows:
where y indicates the measured phenotype, μ is the overall mean, X and Z are design matrices related to fixed effects and effects, respectively, b and u are vectors of fixed and genetic effects, respectively, and e indicates error variance. The prediction accuracy was given by the correlation between GEBV and own phenotype using the following equation [12]:
RESULTS
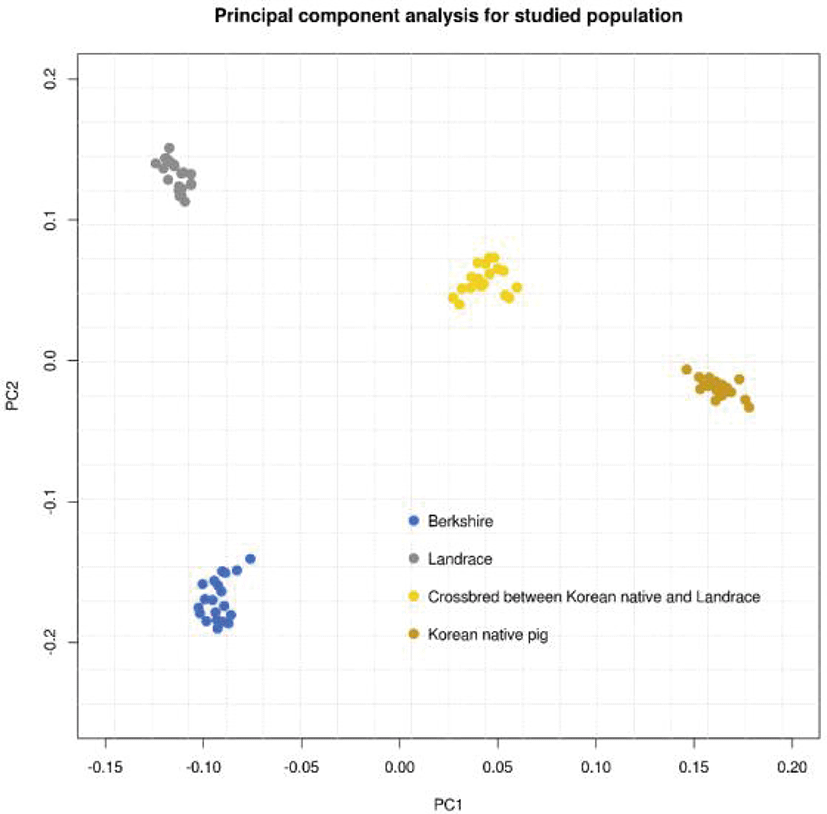
An overview of the population genetic structure was obtained by the PCA and GWAS prior to genomic prediction (Figs. 2–6). First, in order to compare the populations with the same sample size, 20 samples SNP genotype information such as KPN and Landrace purebred populations were randomly extracted from BS and CB, respectively. As shown in Fig. 2, each population forms a distinct cluster; the first and second principal components explain 12.89% and 9.38% of the variance in the population genetic structure, respectively. On the axis of the first component, the Landrace and BS populations are located close to each other, with the KNP population being more distant. On the axis of the second component only, the KNP population was located towards the middle.
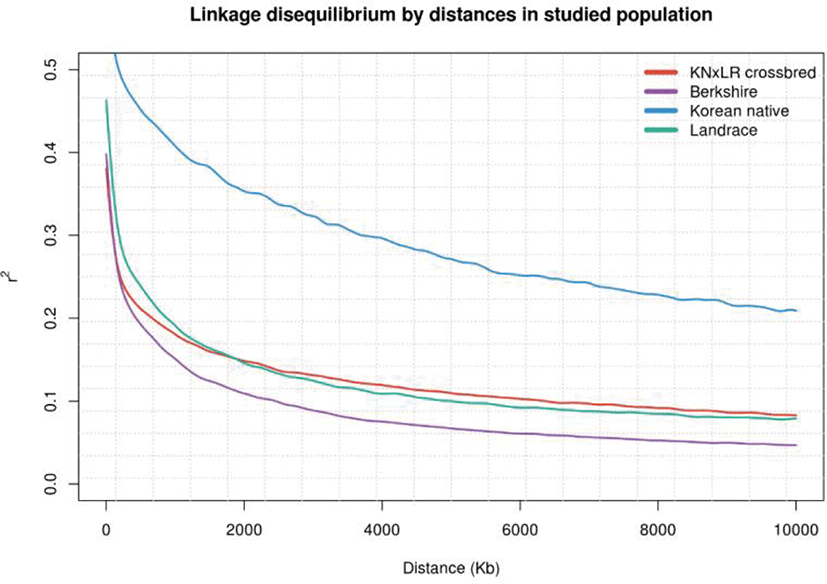
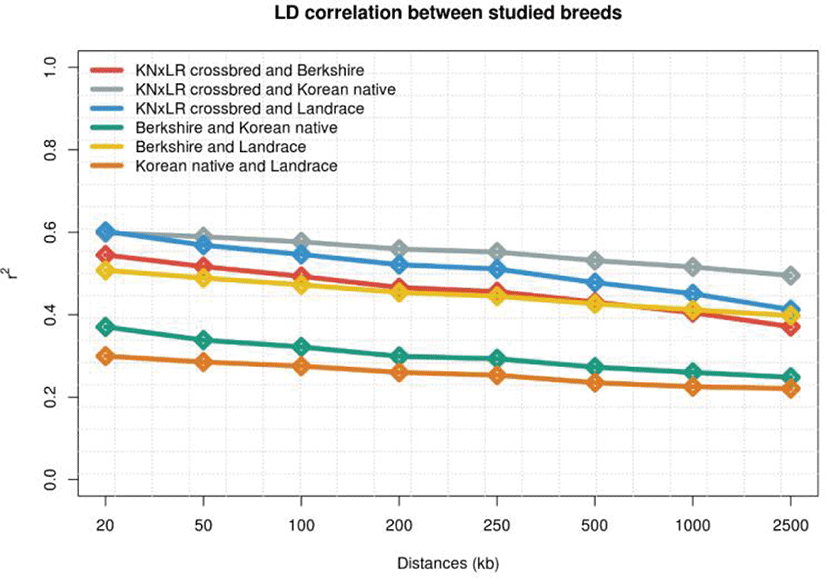
LD was examined in each population by distance. (Figs. 3 and 4). KNP has clearly stronger LD pattern than those for BS, CB, and Landrace, while BS showed the weakest correlations, and the differences between those of CB and Landrace were small. In terms of the correlations between breed pairs, those of KNP and Landrace, and KNP with BS, were weakest, and that of CB with KNP was strongest, followed by CB with Landrace (Fig. 4).
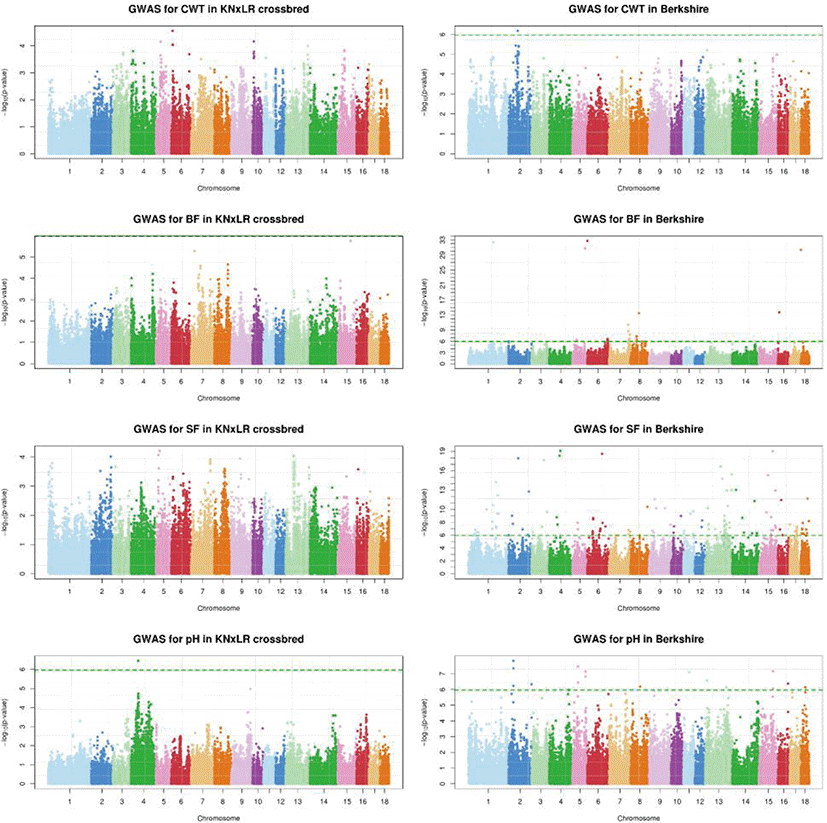
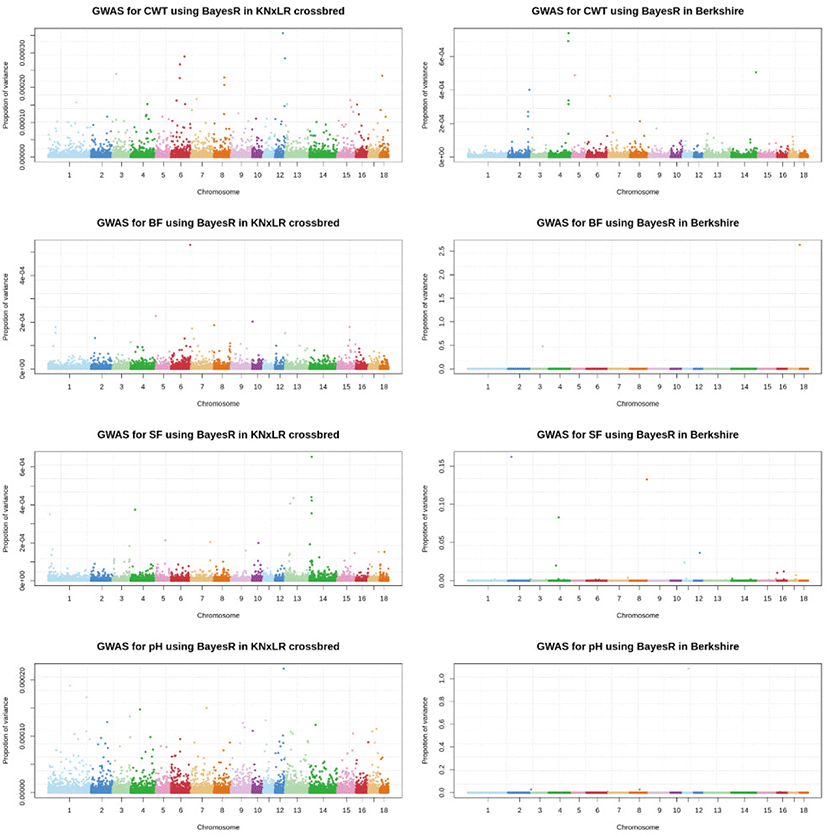
The GWAS, which used a mixed linear model (Fig. 5), showed that there were no significant SNPs for any trait in common, based on a significance threshold of 1.08 × 10⁻⁶, between CB and BS (with Bonferroni correction applied). BS had significant SNPs for all traits, while CB had significant SNPs only for pH. In a Bayesian mixture model, the genetic contribution of CB to all markers was ~0%, while BS made a contribution of > 2.5% contribution to BF, and > 1% to pH and SF (Fig. 6).
The prediction accuracy was zero or negative when using CB and BS as the reference and test populations, respectively. Increasing the size of the reference population did not affect the accuracy of the predictions for any trait except CWT, which increased by 6.26% between reference population sizes of 100 and 400. Use of the admixed population as the same pattern of reference increased the accuracy of the predictions for the BS population by 0.004, 0.013, 0.024, and 0.035 for CWT, BF, SF, and pH, respectively (Table 2; Fig. 7).
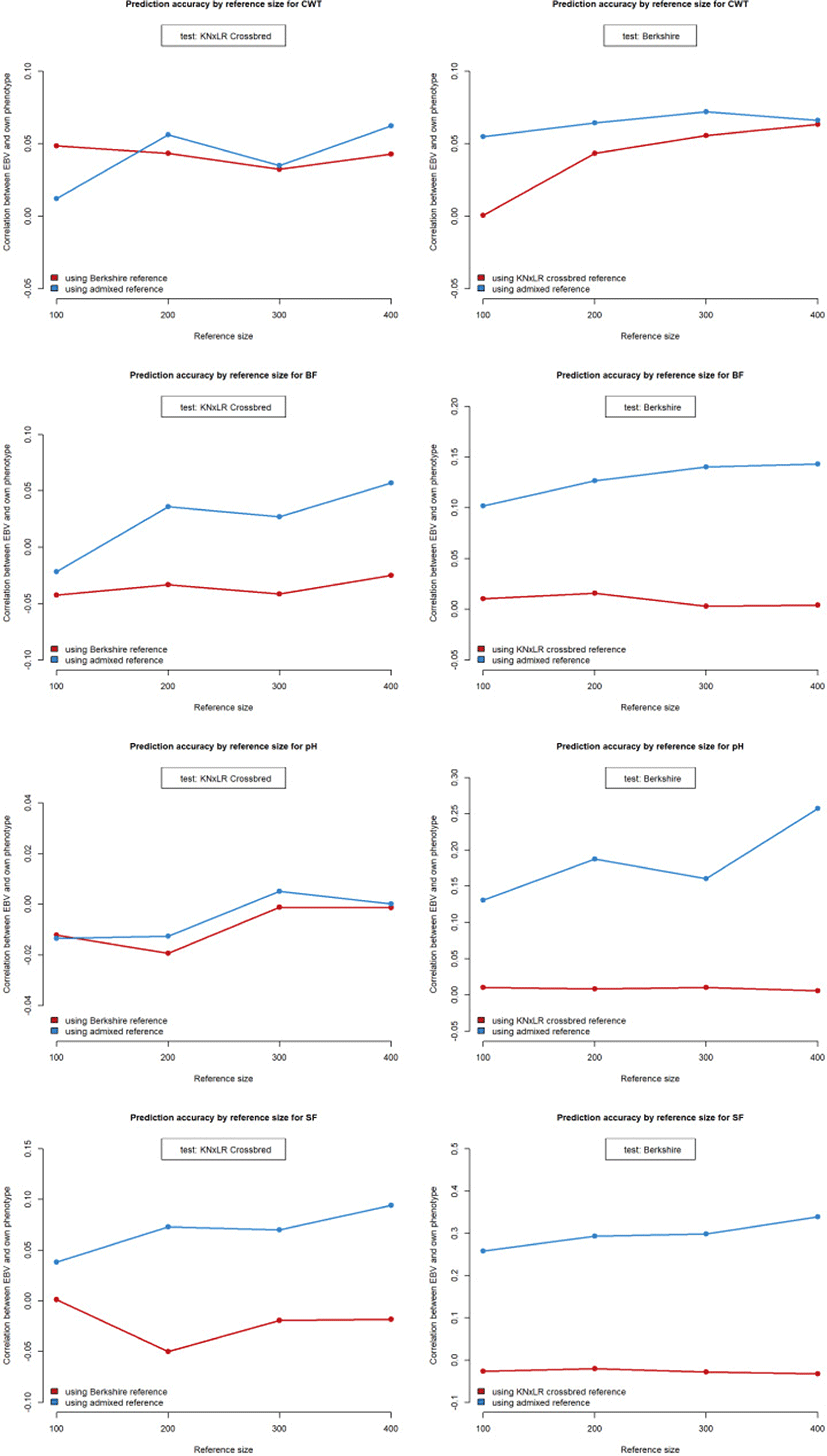
Using CB and BS as the test and reference populations, respectively, the prediction accuracy was zero or negative for all traits except CWT. The accuracy of the predictions for the CB population, when using the admixed population as the reference, increased marginally with increasing size of the reference population, but was not markedly higher compared to when the BS was the reference population.
DISCUSSION
Our GWAS results showed that the prediction accuracy of breeding value varied according to the degree to which a trait is favored. The prediction accuracy of single-breed and admixed reference population-based was shown to depend on the quantitative trait locus (QTL) and relationship among population [13]; the current study did not deal with QTLs, but carefully suggested that GWAS can also be associated with predict breeding value. Prediction accuracy with respect to genomic selection varies by both the LD between markers and QTLs, and genomic relationships (obtained by population structure analysis) [14]. In this study, the prediction accuracy for highly associated traits was higher when the admixed reference population was used, for example for BF, SF, and pH (but not CWT) in the BS population. In contrast, the CB population had no traits that were highly associated with those in the BS population, except pH. For BS, using both the single-breed and admixed reference populations, prediction accuracy for CWT was low compared to the other traits. In CB, the accuracy rates for CWT and pH were not markedly different when using the single-breed or admixed reference population; furthermore, these two traits were less strongly associated in the mixed linear model for the BS population. For CB, prediction accuracy for BF and SF was higher with a larger admixed reference population. When we use the admixed reference population that contains both test population breed in this study, relationship among them possibly be dense. As we mentioned above, following the Wientjes et al. [13], accuracy can be improved how they are related. The haplotypes for specific trait in BS also have a chance to affect accuracy on CB when predicting GEBV. Thus, use of an admixed reference population with traits associated with those in the reference population possibly improved the prediction accuracy of breeding value for test population.
A Bayesian approach is recommended for genomic predictions involving multi-breed populations [15]. A study in dairy cattle indicated that LD does not persist across breeds, except over short genetic distance (< 10 kb) [16]. Some of the putative markers have possibly linked with QTL in LD, while in across breed or multi-breed, low LD relatedness among breeds that already depicted in LD correlation has a small impact on prediction accuracy. Using the Bayesian method also allows us to focus on the QTL rather than LD [17]. As shown in Fig. 6 of this study, the BS population has an advantage with regard to markers with the high genetic contribution in BF, SF, and pH.
This study aimed to provide data that could facilitate improvement and conservation of the KNP. Due to the small size of the KNP population as the reference population, CB (included KNP genotype information) data was also used as the additional reference population. Nevertheless, this approach can be to improve prediction accuracy of breeding value and may facilitate phenotype development by following suggestions. Firstly, LD phases may have been broken down when breeds are crossed, which could be advantageous in some circumstances, for example by increasing the chance of uncovering causal variants for the target trait. Second, the crossing of genetically different populations results in genetic and phenotypic variance, which can lead to high performance animals than those of the previous generation. Though we couldn’t find out putative markers or clear prediction accuracy patterns based on the CB reference, aspect of accuracy with CB using admixed population as a reference can provide valuable information when composing reference population. Furthermore, it is presumed that using the admixed population as a reference population contributes to EBV accuracy by sharing the phenotype associated Berkshire haplotype information while utilizing the relatedness of reference population with the test population.
The current pig improvement system of the Korean pig industry is relying on abroad seed stocks mainly on private farms and pig unions. For this reason, breeding plans and improvement goals are kept confidential and are not disclosed. To address these challenges, the National Institute of Animal Science has been running a Swine Genetic Improvement Network Program since 2008 (https://www.pignet.or.kr). This program aims to select Korean breeding pigs by establishing a system for genetic evaluation at the national level through exchanges and network connection of high-performance pigs among domestic pigs. Therefore, in order to establish a system for selecting and interacting with excellent pigs, it is considered that it is necessary to build an efficient reference population for estimating more accurate EBV as well as understanding the phenotype of the pigs on each farm. The result of this study is expected that the phenotype EBV estimation using the admixed reference population requires verification using various populations and additional samples, but it can provide useful information for the genetic improvement of KNP along with a Swine Genetic Improvement Network Program.
