
INTRODUCTION
In general, corn flakes is produced using a steam chamber. Recently, the production of corn flakes using a pressurized steam chamber (PSC) is increasing in korea. PSC is a system wherein a pressure device is placed in the existing steam chamber. The use of PSC effectively reduce the time for processing, energy, and cost of corn flake production. However, few studies have assessed conditions including chamber temperature, time, and thickness compared to those investigating older steam chambers of historical value [1].
Zinn et al. [2] reported that the quality standards for corn flakes include thickness, density, starch solubility, and enzyme activity. Among these factors, thickness and density in particular are the ones that have a great influence on the quality of corn flakes [3]. Schwandt [4] reported that with a reduction in the space between rolls, corn flake density decreased proportionately with thickness, thereby increasing levels of digestible starch. Furthermore, Plascencia and Zinn [5] and Son et al. [6] reported that dry matter (DM) and starch digestibility increased with a reduction in corn flake thickness. However, excessive low thickness of corn flakes reportedly increased the energy costs [7], increased loss of corn [8], cracking of corn, or excessive flour production [9,10].
The availability of starch in the rumen can vary depending on the thickness of corn flakes. In addition, the productivity (production efficiency, manufacturing cost, etc.) of corn flakes can be influenced by their thickness. Therefore, it is important to determine the optimal thickness of corn flakes produced using the PSC; However, there has been few or no study on the effect of cornflake thickness that produced by PSC on the fermentation properties and nutrient digestibility of rumen. Thus, This study was conducted to evaluate the effect of the thickness of corn flakes produced in a PSC on fermentation characteristics and nutrient degradability in rumen.
MATERIALS AND METHODS
The experimental animals used in this study were approved by the Animal Experiment Ethics Committee of Kangwon National University (KNU No: KIACUC-16-0010).
In this study, six cows with transplanted ruminal cannula were used for the experimental animals. Three Hanwoo cows (average body weight, 335.5 ± 41.2 kg) and three Holstein cows (average body weight, 425.6 ± 37.5 kg).
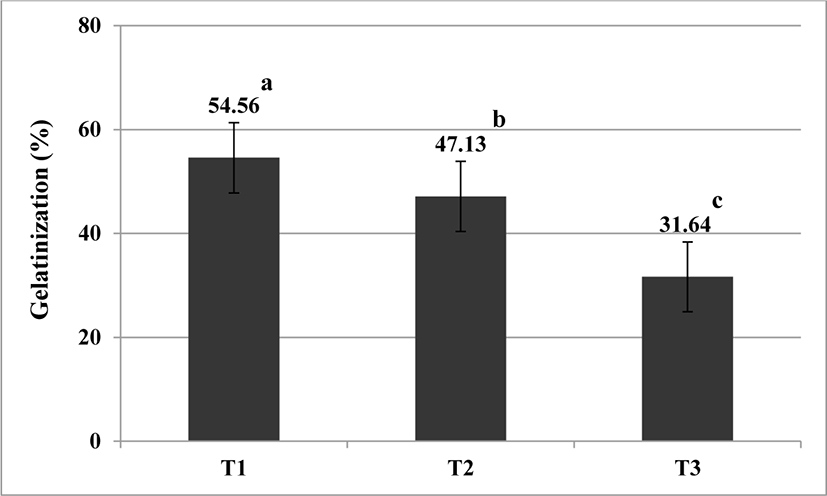
Corn flakes produced by PSC were treated into three groups based on their thickness: < 2.5 mm (T1), 2.5–3.0 mm (T2), and > 3.0 mm (T3). The processing conditions for corn flakes in the PSC were as follows: 1.5 atm, 110°C, 750 s. Chemical compositions and gelatinization of corn flakes are shown in Table 1 and Fig. 1.
Rumen fluid was collected from the rumen cannula, filtered through four layers of gauze, and stored in a thermos flask at 39°C. Thereafter, O2-free CO2 gas was injected for 1 min to eliminate air at the flask, and allowed to stand for 30 min in an incubator at 39°C to be used for inoculum for in vitro.
In vitro culture solutions were prepared by mixing 4,788 mL of buffer solution [11] with 1,200 mL of rumen inoculum. The prepared in vitro culture solutions were divided into three glass jars (4 L) by 2 L each, and sample bags (15 g) was added according to the thickness treatment, and then CO2 gas without O2 was injected. Incubation was carried out for 3, 6, 12, and 24 h in a 39°C incubator, and three times of 15 mL of culture solutions was collected for each hour in jar and used to analyze rumen fermentation characteristics. A total of three repetition experiments were performed in the same method.
For in situ experiment, corn flakes were measured in 5 g each according to the thickness group and placed in a nylon bag (5 × 10 cm). Three nylon bags were produced for each treatment per incubation time, and the nylon bags were placed in a mesh, and then inserted into the rumen cannula. In situ experiments were incubated for 24 h, and meshes were collected through cannula every 3, 6, 12, and 24 h respectively. The nylon bag was washed until clear water was obtained, and then dried in a 70°C forced dry oven for 48 h. A total of theree repetition experiments were performed in the same method.
MEASUREMENTS AND ANALYSIS
Chemical composition of corn flakes were analyzed in accordance with the methods of the AOAC [12], and the contents of neutral detergent fiber (NDF) were measured in accordance with the method of Goering and Van Soest [13]. The contents of non-fiber carbohydrates (NFC) were determined using the following equation:
Starch concentration was determined according to the standard feed analysis method [14], and the gelatinization was analyzed method for titration of Korean food standards codex [15].
The rumen pH was analyzed using a pH meter (Corning 445, Cole-Parmer, Il, USA) in a 4 L jar for each incubation time. The volatile fatty acids (VFA) concentration were analyzed by using a gas chromatograph (Shimadzu-17A, Shimadzu, Kyoto, Japan). After collecting 15 mL of culture solutions in a 4 L jar for each incubation time, then 0.5 mL of saturated HgCl2 and 1 mL of 20% HPO3 were added. The culture solutions were separated via centrifugation at 1,250×g for 15 min, and supernatant was analyzed. The analysis condition is column : 30 m × 0.25 mm × 0.25 um, carrier gas : 37 mL/min (He : 7, H2 : 15, and O2 : 15), column flow rate : 1 uL/min, injection port temperature : 230°C, detection port temperature : 230°C, and oven temperature : 230°C (100°C–230°C : 8°C/min).
DM degradability was calculated on the basis of the weight difference before and after rumen incubation. Starch degradability was calculated based on the weight or differences in DM content and starch before and after ruminal incubation.
All the experimental results were analyzed by GLM Procedure of SAS (2004) 9.2 Software Package. Variance analysis was performed using the square sum of TYPE III, suitable for the unbalanced data among the four squares resulting from the SAS/GLM analysis. To investigate the effects of thickness of corn flakes produced in a PSC on fermentation characteristics, the following linear model was used to analyze the variance.
Where, Yijkl = individual observations, µ = overall mean, TT = effect of i th treatment (3 conditions), TMj = effect of j th incubation time (j = 3, 6, 9, 12, and 24 h), Bk = effect of k th breed (k = Holstein, Hanwoo), (TT×TM)ij = the interaction effects of i th treatment and j th incubation time, (TT×B)ik = the interaction effect of the i th treatment and the k th breed, (TM×B)jk = the interaction effect of the j th incubation time and k th breed, eijkl = random error.
Degradability of DM and starch were analyzed using the following linear model.
Where, Yijkl = individual observations, µ = overall mean, TMj = the effect of the j th incubation time (j= 3, 6, 9, 12, and 24 h), Bk = the effect of k th breed (k = Holstein, Hanwoo), (TT×TM)ij = the interaction effect of i th treatment and j th incubation time, (TT×B)ik = the interaction effect of i th treatment and k th breed, (TM×B)jk = the interaction effect of j th incubation time and k th breed, A(B)ik = the effect of i th animal (6 conditions) overlapped on the k the breed, eijklm = random error.
Duncan’s multiple range test was used to compare differences in parameter mean values, and the t-test was used to determine the effect of the breed. Significant differences were accepted if p < 0.05.
RESULTS
The least squares mean of fermentation characteristics on corn flake thickness are shown in Table 2. The rumen pH value was lower in T1 and T2 than in T3 groups (p < 0.01), and acetate concentration was higher in T1 than T2 and T3 groups (p < 0.05). Propionate concentration tended to increase with a reduction in corn flake thickness and was significantly higher in T1 than in T3 (p < 0.05). Total-volatile fatty acids (T-VFA) concentration was significantly higher in T1 than in T3 (p < 0.05) and was similar between T1 and T2.
The least squares mean of the breed in fermentation characteristics on corn flake thickness are shown in Table 3. In the case of Holstein cows, rumen pH value was significantly higher in T3 than in T2 (p < 0.05) and similar between T1 and T2. Acetate concentration was higher in T1 than T2 and T3 (p < 0.05); propionate, higher in T1 and T2 (p < 0.05) than in T3; butyrate, slightly but not significantly higher in T2 than T1 and T3. T-VFA concentration increased slightly, but not significantly, with a reduction in corn flake thickness. In the case of Hanwoo cows, the rumen pH value decreased with a reduction in corn flake thickness (p < 0.05). Acetate, butyrate, and T-VFA concentrations were slightly but not significantly higher in T2 than in T1 and T3. Propionate concentration was greater in T1 and T2 than in T3 (p < 0.05).
Changes in rumen pH values and VFA concentrations based on the thickness of corn flakes produced using the PSC are shown in Table 4. The rumen pH value was significantly lower in T1 and T2 than in T3 at 12 h (p < 0.05). Acetate and butyrate concentrations were not significantly different throughout the incubation time. Propionate concentration was significantly higher in T1 than in T2 and T3 at 3 h (p < 0.05) and significantly higher in T2 than in T3 at incubation 12 h (p < 0.05). T-VFA concentrations were the highest in T1 from 6 to 24 h, but there was no significant difference between treatments.
The least squares mean of DM and starch degradability based on corn flake thickness are shown in Table 5. DM and starch degradability increased significantly with a reduction in corn flake thickness (p < 0.01).
| Item | Treatments1) | SEM | ||
|---|---|---|---|---|
| T1 | T2 | T3 | ||
| Dry matter (%) | 37.50a | 35.73b | 26.17c | 1.14 |
| Starch (%) | 49.23a | 47.20b | 41.41c | 0.86 |
The least squares mean of the breed in the DM and starch degradability based on corn flake thickness are shown in Table 6. In the case of Holstein cows, DM degradability increased significantly with a reduction in corn flake thickness (p < 0.01). Starch degradability was significantly higher in T1 than in T3 (p < 0.01) and similar between T1 and T2. In Hanwoo cows, DM and starch degradability increased significantly with a reduction in corn flake thickness (p < 0.01). Regardless of the breed, DM and starch degradability increased significantly with a reduction in corn flake thickness (p < 0.01) but was similar between T1 and T2.
Changes in DM and starch degradability based on corn flake thickness are shown in Table 7. Throughout the incubation time, DM and starch degradability were significantly lower in T3 than in T1 and T2 (p < 0.01) but were similar between T1 and T2.
DISCUSSION
In general, increase in thickness or density of corn flakes can improve the availability of corn flakes in the rumen [16,17]. Zinn et al. [2] reported that corn flake density varies depending on the production conditions (species, country of origin, climate, harvest time, etc.) of the corn, size of the chamber, loss of moisture, grain handling, etc.; however, corn flake thickness can be maintained constant. Therefore, corn flake thickness is considered an important factor to control the quality of corn flakes.
In the present study, a reduction in corn flake thickness was accompanied by an increase in gelatinization. This result is concurrent with that of Wang et al. [18], wherein a reduction in corn flake density was accompanied with an increase in the degree of gelatinization.
In the present study, a reduction in corn flake thickness led to reduced ruminal pH and increased volatile fatty acid (especially propionate) concentration. This result could be due to the increase in ruminal degradation and fermentation of starch owing to the increased gelatinization of corn flake starch. In addition, the present finding is concurrent with that of Reinhardt et al. [7], wherein a reduction in corn flake density was accompanied by a reduction in ruminal pH; however, the volatile fatty acid concentration increased.
Furthermore, a reduction in corn flake thickness was accompanied with a reduction in ruminal pH and an increased possibility of acute acidosis, which could adversely affect the health and productivity of the cattle [19]. Zinn [20] reported a reduction in feed efficiency resulting from feeding of corn flakes of 1.68 mm thickness compared to corn flakes of 1.83 mm and 2.23 mm thickness, owing to digestive dysfunction. In the present study, differences in pH and volatile fatty acid concentration upon feeding less than 2.5 mm thick and 2.5–3.0 mm thick corn flakes were small; therefore, the optimal corn flake thickness produced using the pressurized chamber was estimated to be 2.5–3.0 mm.
Schwandt [21] reported that a reduction in corn flake thickness is accompanied with a reduction in density and an increase in the amount of digestible starch. Zinn et al. [2] reported that corn flake thickness is closely associated with the solubility and enzyme reactivity of starch. In the present study, concurrent with previous reports, the thinning of corn flakes improved the dry matter and starch degradability probably owing to an increase in digestible starch in the rumen owing to increased solubility of starch with an increase in gelatinization (Fig. 1). Son et al. [6] reported that an increase in the dry matter and starch digestibility owing to thinning of corn flakes was attributable to the ease of ruminal microbial penetration into the corn flakes, the increase in α-starch, and destruction of the protein membrane around starch. These results are concurrent with the present results wherein the thinner the corn flakes, the higher the degradability of the dry matter and starch. In addition, the present findings are also similar to those of Swingle et al. [22], wherein starch degradability was increased with a reduction in corn flake density from 421 g/L to 257 g/L.
However, in the present study, owing to the slight difference in gelatinization and starch degradability between corn flakes less than 2.5 mm and those measuring 2.5–3.0 mm, proper thickness is more important than too thin processing for quality control of corn flakes.
Plascencia and Zinn [5] reported that a reduction in corn flake thickness (1.66, 1.88, and 2.45 mm) is accompanied by an increase in solubility and digestibility of starch and an increase in the feed value of corn flakes; however, the optimal thickness of corn flakes was 1.88–2.45 mm. Zinn [23] reported that on comparing the feed values between corn flakes measuring 0.95 mm and 1.35 mm, there was no obvious benefit (improvement in feed value) for reducing corn flake thickness to less than 1.3 mm. In addition, to reduce corn flake thickness, the production costs of gas and electricity increased owing to overloading of the rolls [24]. Reinhardt et al. [7] reported that, compared to the corn flake density was 361 g/L, production cost per ton of corn flakes increased by 26.9% and 67.5% at 322 and 238 g/L, respectively. Furthermore, as the space between the rolls is reduced to reduce corn flake thickness, the rate of loss of corn is increased and the value of the corn flakes may be reduced owing to cracking or increased flour production. Thus, considering the difference in ruminal starch degradability and economic feasibility between T1 (< 2.5 mm) and T2 (2.5–3.0 mm), the optimal corn flake thickness upon using the PSC is recommended at 2.5–3.0 mm.
On the other hand, rumen fermentation and digestion are influenced by the type of microorganism, feed, age, livestock, and body weight [25], and it has been reported that the rumen fermentation rate increases as body weight increases [26]. In this study, the tendency was the same among the varieties (Holstein and Hanwoo) according to the corn flake thickness treatment produced in PSC, but it was considered that the weight and microbial groups had an effect on the differences among varieties. Bartocci et al. [27] reported a difference in the rumen passage rate of feed between livestock (buffalo, bull and goat), and Voigt et al. [28] reported that dairy cattle showed a more efficient rumen digestion process compared to Galloway and Highland bull. Therefore, in general, it is considered that the treatment effect according to corn flake thickness can be more effectively applied in Holstein, which has a higher weight and digestibility than Hanwoo.
CONCLUSION
In this study, the thickness of corn flakes produced using a pressurized steam chamber was found to significantly affect gelatinization, rumen pH, concentration of propionic acid, and degradability of dry matter and starch. As the corn flake thickness decreased, energy availability improved, but the greater part of result between the thickness of < 2.5 mm and 2.5–3.0 mm was not significantly different, and the excessive thickness reduction may cause problems such as a rapid decrease in rumen pH and an increase in processing cost. Thus, considering the production efficiency and economic feasibility, the optimal thickness of corn flakes produced in a PSC is recommended to be 2.5–3.0 mm.