Journal of Animal Science and Technology
Korean Society of Animal Sciences and Technology
RESEARCH ARTICLE

Optimizing the composition of the medium for the viable cells of Bifidobacterium animalis subsp. lactis JNU306 using response surface methodology

Thi Duyen Dang1,2https://orcid.org/0000-0002-4202-8808, Cheng Chung Yong1https://orcid.org/0000-0003-0531-6381, Sungsue Rheem3,*https://orcid.org/0000-0001-7009-3343, Sejong Oh1,*https://orcid.org/0000-0002-5870-3038
1Department of Animal Science, Chonnam National University, Gwangju 61186, Korea
2Western Highlands Agriculture and Forestry Science Institute, Buon Ma Thuot, Dak Lak Province 63161, Viet Nam
3Graduate School of Public Administration, Korea University, Sejong 30019, Korea
*Corresponding author: Sungsue Rheem, Graduate School of Public Administration, Korea University, Sejong 30019, Korea. Tel: +82-44-860-1554, E-mail: rheem@korea.ac.kr
*Corresponding author: Sejong Oh, Department of Animal Science, Chonnam National University, Gwangju 61186, Korea. Tel: +82-62-530-2116, E-mail: soh@jnu.ac.kr

© Copyright 2021 Korean Society of Animal Science and Technology. This is an Open-Access article distributed under the terms of the Creative Commons Attribution Non-Commercial License (http://creativecommons.org/licenses/by-nc/4.0/) which permits unrestricted non-commercial use, distribution, and reproduction in any medium, provided the original work is properly cited.

Received: Jan 26, 2021; Revised: Feb 02, 2021; Accepted: Feb 04, 2021

Published Online: May 31, 2021

Abstract

This research improved the growth potential of Bifidobacterium animalis subsp lactis strain JNU306, a commercial medium that is appropriate for large-scale production, in yeast extract, soy peptone, glucose, L-cysteine, and ferrous sulfate. Response surface methodology (RSM) was used to optimize the components of this medium, using a central composite design and subsequent analyses. A second-order polynomial regression model, which was fitted to the data at first, significantly lacked fitness. Thus, through further analyses, the model with linear and quadratic terms plus two-way, three-way, and four-way interactions was selected as the final model. Through this model, the optimized medium composition was found as 2.8791% yeast extract, 2.8030% peptone soy, 0.6196% glucose, 0.2823% L-cysteine, and 0.0055% ferrous sulfate, w/v. This optimized medium ensured that the maximum biomass was no lower than the biomass from the commonly used blood-liver (BL) medium. The application of RSM improved the biomass production of this strain in a more cost-effective way by creating an optimum medium. This result shows that B. animalis subsp lactis JNU306 may be used as a commercial starter culture in manufacturing probiotics, including dairy products.

Keywords: Bifidobacterium animalis; Medium; Yeast extract - Soy Peptone - Glucose (YPG); Optimization; Response surface methodology (RSM)

INTRODUCTION

Bifidobacteria is indicated to affect the gastrointestinal health of humans and animals significantly. Numerous intensive studies have been conducted on gut health in relation to these bacteria [1]. These studies have enabled the use of bifidobacteria as probiotic strains, which are live beneficial microflora orally administered to humans for their dominance in the intestine.

The third commonly used genus in probiotics application, bifidobacteria were first used by Mayer in 1949 in making baby food. Later in 1968, Schuler Malyoth and his colleague showed that this bacterium can also be cultivated in dairy products [1], and the bacteria gained importance in the industry due to many health benefits. For only a few past decades, hundreds of bifidobacteria-containing foods have been produced and made available under trademarks worldwide [2].

One of the widest uses of bifidobacteria in probiotic products is their inclusion in dairy products that have been historically consumed by humans [3]. Regarding this, Bifidobacterium animalis subsp. lactis is the most widely used Bifidobacterium species. They appear in various arrays of dietary supplements and foods, especially fermented milk and junk foods. This organism is also considered the organism of choice technologically due to the high survival ability in the human gastrointestinal tract, and better feasibility compared to other bifidobacteria [47]. Therefore, it is important that we cultivate B. animalis subsp. lactis on a large-scale for manufacturing.

Bifidobacterium animalis subsp. lactis is possibly the best-known of the Bifidobacterium family, which requires nutrition media containing numerous amino acids, vitamins and related growth factors, for instance low oxidation and miner components [8]. Although various bifidobacteria growth media has been studied, these are unsuitable for large-scale production due to low cell mass production, unavailable materials, complex process, cost, and difficult harvesting problems [1,8,9]. Therefore, prevalent commercial media, which can limit the defects of previous ones, are required.

Yeast extract - Soy Peptone - Glucose (YPG) medium is considered a nutrient medium with rich amino acid and carbohydrate deposits [10], and with the addition of growth stimulated factors such as L-cysteine and Ferrous sulfate, YPG meets the requirements for the production of mass cell concentrations of bifidobacteria. Moreover, by using inexpensive materials, a new medium should be cost-effective and feasible during manufacturing.

Besides, one of the major components in designing new fermentation media is numerous experiments. Response surface methodology (RSM) is a collection of statistical and mathematical techniques including factual designs and regression analysis, which is more suitable for accessing multifactor experiments [1113]. Therefore, using RSM provides a unique solution to determine the optimized growth conditions of Bifidobacterium in YPG medium.

This study outlines the optimized mass cell production of B. animalis subsp. lactis JNU306 in Yeast extract-Peptone Soy-Glucose -based medium using RSM.

MATERIALS AND METHODS

Microorganism and growth media

Bifidobacterium animalis subsp. lactis strain JNU306 was originally isolated from infant feces and used as a freeze storage strain at Chonnam National University. The Skim Milk medium [14] and blood-liver (BL) medium [15] were used as storage and activation media, respectively, for B. animalis subsp. lactis JNU306. This strain was stored at −70°C. The bacterium was activated by inoculating a colony in BL medium anaerobically at 37°C for 48 h. The strain was further propagated by incubating twice in BL broth to obtain a biomass concentration of 108 CFU/mL. To limit the carryover of the previous medium, the culture was centrifuged at 3,000 rpm for 15 min at 4°C to harvest cells, and the cells were resuspended in the same medium before incubating (0.1%) in various media.

Preparation of experimental media and fermentation conditions

The test media components used in the experiment comprised yeast extract (HY-YEST 501, Kerry bioscience, Beloit, WA, USA), peptone soy (Peptone S, Daejung, Siheung, Korea), glucose (D[+]-glucose, Junsei, Tokyo, Japan), L-cysteine (L-cysteine hydrochloride monohydrate, Sigma, St. Louis, MO, USA) and ferrous sulfate (Iron (II) Sulfate, Wako, Richmond, VA, USA). The media were autoclaved at 121°C for 15 minutes and cooled to room temperature before inoculation with cell pellets. The culture was incubated in 50-mL screw cap glass tubes (Cole-Parmer, Montreal, QC, Canada) containing 30 mL of broth and 5 mL of paraffin liquid to create an anaerobic environment. The fermentation was conducted in a water bath at 37°C for 24 h and at pH 7.0–7.2.

Microbial analysis

Viable cell enumeration was performed by diluting samples several times in a buffered saline solution containing (in g/L): potassium phosphate monobasic 4.5; sodium phosphate dibasic, 6; L-cysteine, 0.5, and Tween 80, 0.5. The resulting mixture was stirred using a magnetic stirrer until absolute homogenization to give a 10-fold dilution (wet weight/volume). Aliquots (1 mL) of each dilution were evenly spread on plates of freshly prepared BL media. Plates were incubated at 37°C for 48 h by both methods of anaerobic jars and steel wool in anaerobic incubator (Anarorator, Hanteck, Uiwang, Korea) and anaerobic packs (AnaeroPack, Mitsubishi Gas Chemical, Tokyo, Japan).

Experimental design and data

The culture medium was incubated after various treatment combinations under anaerobic conditions at 37°C for 24 h. After incubation, the number of viable cells was estimated by plate counting. Bacterial growth was tested with 30 mL volumes of medium in a 50-mL tube. For the factors for our response surface experiment, peptone soy, yeast extract, glucose, L-cysteine, and ferrous sulfate were selected. As our response surface design, the five-level-five-factor central composite design (CCD) was chosen. Table 1 displays the factors and their levels in our CCD. Table 2 shows our CCD, which consists of 32 factorial, 10 axial, and 6 center runs, and the responses from these 48 runs. The responses represent maximum biomass counts at 24 h. With Log 10 CFU/mL as their unit, the responses ranged from 7.99 to 10.29.

Table 1. Factors and their levels in our central composite design (CCD)
Actual factor (Coded factor) Actual factor level corresponding to the coded factor level
2.366 −1 0 1 2.366
Peptone soy (X1) (% [w/v]) 0.000 1.155 2.000 2.845 4.000
Yeast extract (X2) (% [w/v]) 0.000 1.155 2.000 2.845 4.000
Glucose (X3) (% [w/v]) 0.000 0.577 1.000 1.423 2.000
L-cystein (X4) (% [w/v]) 0.000 0.289 0.500 0.711 0.100
Ferrous sulfate (X5) (% [w/v]) 0.000 0.006 0.010 0.014 0.020
Download Excel Table
Table 2. CCD in coded factor levels and maximum biomass as the response
Run Treatment Peptone soy (X1) Yeast extract (X2) Glucose (X3) L-cystein (X4) Ferrous sulfate (X5) Maximum biomass (Y1))
1 1 −1 −1 −1 −1 −1 7.99
2 2 −1 −1 −1 −1 1 9.06
3 3 −1 −1 −1 1 −1 9.15
4 4 −1 −1 −1 1 1 9.38
5 5 −1 −1 1 −1 −1 9.68
6 6 −1 −1 1 −1 1 8.92
7 7 −1 −1 1 1 −1 9.23
8 8 −1 −1 1 1 1 9.19
9 9 −1 1 −1 −1 −1 9.35
10 10 −1 1 −1 −1 1 9.11
11 11 −1 1 −1 1 −1 10.12
12 12 −1 1 −1 1 1 9.45
13 13 −1 1 1 −1 −1 9.30
14 14 −1 1 1 −1 1 9.25
15 15 −1 1 1 1 −1 9.39
16 16 −1 1 1 1 1 9.38
17 17 1 −1 −1 −1 −1 9.17
18 18 1 −1 −1 −1 1 9.42
19 19 1 −1 −1 1 −1 9.39
20 20 1 −1 −1 1 1 9.36
21 21 1 −1 1 −1 −1 9.07
22 22 1 −1 1 −1 1 9.11
23 23 1 −1 1 1 −1 9.32
24 24 1 −−1 1 1 1 9.00
25 25 1 1 −1 −1 −1 10.29
26 26 1 1 −1 −1 1 9.18
27 27 1 1 −1 1 −1 9.45
28 28 1 1 −1 1 1 9.44
29 29 1 1 1 −1 −1 9.39
30 30 1 1 1 −1 1 9.32
31 31 1 1 1 1 −1 9.44
32 32 1 1 1 1 1 9.43
33 33 −2.366 0 0 0 0 9.03
34 34 2.366 0 0 0 0 9.30
35 35 0 −2.366 0 0 0 8.54
36 36 0 2.366 0 0 0 9.44
37 37 0 0 −2.366 0 0 9.19
38 38 0 0 2.366 0 0 9.11
39 39 0 0 0 −2.366 0 9.31
40 40 0 0 0 2.366 0 9.61
41 41 0 0 0 0 −2.366 9.16
42 42 0 0 0 0 2.366 9.18
43 43 0 0 0 0 0 9.20
44 43 0 0 0 0 0 9.34
45 43 0 0 0 0 0 9.35
46 43 0 0 0 0 0 9.31
47 43 0 0 0 0 0 9.33
48 43 0 0 0 0 0 9.16

Maximum biomass count achieved at 20 h, expressed in Log10 CFU/mL.

CCD, central composite design.

Download Excel Table
Statistical analysis

Data were analyzed using SAS software. SAS/STAT [16] was employed for the statistical modeling of the data. Graphs were produced using SAS/GRAPH [16].

RESULTS

Developing an analysis model

First, the second-order polynomial regression model was used to model the experimental data in Table 2. However, this model turned out to be inadequate, as indicated by the analysis of variance (Table 3); the model was non-significant (p = 0.1116 > 0.05), the r2 was low (r2 = 0.5501), and the lack of fit was significant (p = 0.0032 < 0.05).

Table 3. Analysis of variance for the initial model
Regression DF Type 1 sum of squares R-square F-value p-value
Linear 5 1.601320 0.3190 3.83 0.0095
Quadratic 5 0.234238 0.0467 0.56 0.7296
2-Way interactions 10 0.926281 0.1845 1.11 0.3920
Total model 20 2.761839 0.5501 1.65 0.1116
Residual DF Sum of squares Mean square F-value p-value
Lack of fit 22 2.225909 0.101178 15.48 0.0032
Pure error 5 0.032683 0.006537
Total error 27 2.258593 0.083652

DF, degrees of freedom.

Download Excel Table

Next, the following trials were made for improving the second-order model. First, cubic terms were added to the second-order model, but this did not enhance the model. Second, three-way interaction terms were added to the second-order model, yet, the improvement made by this attempt was insufficient. Third, three-way and four-way interaction terms were added to the second-order model, and this augmented model turned out to be satisfactory (Table 4), as displayed by the ANOVA; the model was significant (p = 0.0001 < 0.05), the r2 was high (r2 = 0.9646), and the lack of fit was nonsignificant (p = 0.1110 > 0.05). Thus, this model, with 5 linear, 5 quadratic, 10 two-way interaction, 10 three-way interaction, and 5 four-way interaction terms as its explanatory variables, was selected as the final model. The coefficients in this final model are indicated in Table 5.

Table 4. Analysis of variance for the final model
Regression DF Sum of squares R-square F-value p-value
Linear 5 1.601320 0.3190 21.60 0.0000
Quadratic 5 0.234238 0.0467 3.16 0.0476
2-Way interactions 10 0.926281 0.1845 6.25 0.0020
3-Way interactions 10 1.443231 0.2875 9.73 0.0002
4-Way interactions 5 0.637441 0.1270 8.60 0.0012
Total model 35 4.842511 0.9646 9.33 0.0001
Residual DF Sum of squares Mean square F-value p-value
Lack of fit 7 0.145237 0.020748 3.17 0.1110
Pure error 5 0.032683 0.006537
Total error 12 0.177921 0.014827

DF, degrees of freedom.

Download Excel Table
Table 5. Coefficient estimates and related statistics in the final model
Model terms Coefficient estimate Standard error t-value p-value
Intercept b0 = 9.2985270 0.0492900 188.65 < .0001
X1 b1 = 0.0571540 0.0185268 3.08 0.0095
X2 b2 = 0.1615755 0.0185268 8.72 < .0001
X3 b3 = −0.0249857 0.0185268 −1.35 0.2024
X4 b4 = 0.0745395 0.0185268 4.02 0.0017
X5 b5 = −0.0389546 0.0185268 −2.10 0.0573
X12 b11 = −0.0087420 0.0171463 −0.51 0.6194
X22 b22 = −0.0400034 0.0171463 −2.33 0.0379
X32 b33 = −0.0114216 0.0171463 −0.67 0.5179
X42 b44 = 0.0439558 0.0171463 2.56 0.0248
X52 b55 = −0.0078488 0.0171463 −0.46 0.6553
X1 × X2 b12 = −0.0203125 0.0215252 −0.94 0.3640
X1 × X3 b13= −0.0734375 0.0215252 −3.41 0.0052
X1 × X4 b14 = −0.0859375 0.0215252 −3.99 0.0018
X1 × X5 b15 = −0.0246875 0.0215252 −1.15 0.2738
X2 × X3 b23 = −0.0653125 0.0215252 −3.03 0.0104
X2 × X4 b24 = −0.0215625 0.0215252 −1.00 0.3362
X2 × X5 b25 = −0.0815625 0.0215252 −3.79 0.0026
X3 × X4 b34 = −0.0571875 0.0215252 −2.66 0.0209
X3 × X5 b35 = −0.0221875 0.0215252 −1.03 0.3230
X4 × X5 b45 = 0.0003125 0.0215252 0.01 0.9887
X1 × X2 × X3 b123 = 0.0690625 0.0215252 3.21 0.0075
X1 × X2 × X4 b124 = −0.0234375 0.0215252 −1.09 0.2976
X1 × X3 × X4 b134 = 0.1021875 0.0215252 4.75 0.0005
X2 × X3 × X4 b234 = 0.0478125 0.0215252 2.22 0.0463
X1 × X2 × X5 b125 = 0.0103125 0.0215252 0.48 0.6405
X1 × X3 × X5 b135 = 0.0559375 0.0215252 2.60 0.0233
X2 × X3 × X5 b235 = 0.1403125 0.0215252 6.52 <.0001
X1 × X4 × X5 b145 = 0.0321875 0.0215252 1.50 0.1607
X2 × X4 × X5 b245 = 0.0478125 0.0215252 2.22 0.0463
X3 × X4 × X5 b345 = 0.0284375 0.0215252 1.32 0.2111
X1 × X2 × X3 × X4 b1234 = −0.0003125 0.0215252 −0.01 0.9887
X1 × X2 × X3 × X5 b1235 = −0.0440625 0.0215252 −2.05 0.0632
X1 × X2 × X4 × X5 b1245 = 0.0646875 0.0215252 3.01 0.0110
X1 × X3 × X4 × X5 b1345 = −0.0984375 0.0215252 −4.57 0.0006
X2 × X3 × X4 × X5 b2345 = −0.0640625 0.0215252 −2.98 0.0116
Download Excel Table
Finding the optimum point of the factors

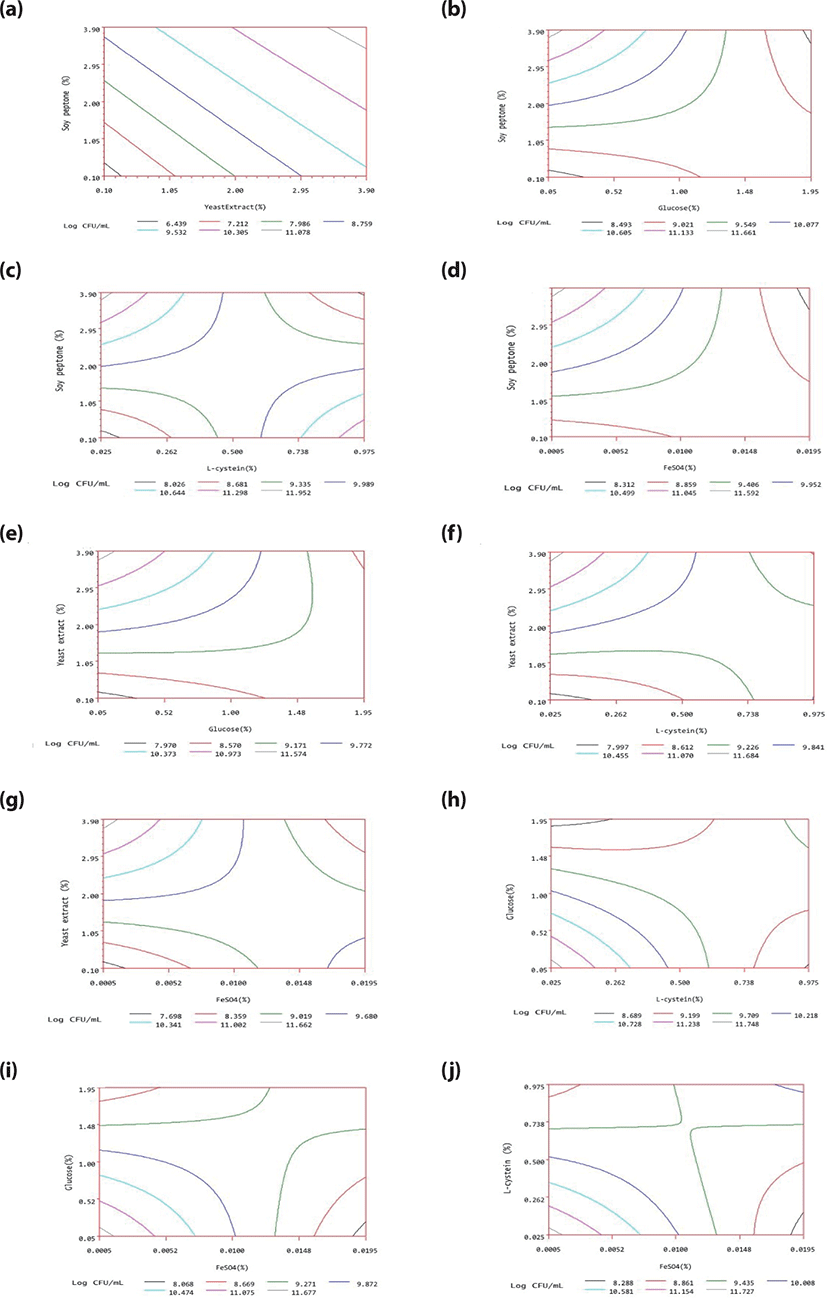
Through a search on a grid [17], we maximized the predicted response from the model having the coefficients in Table 5. The bounds for the factor levels were 5_Xj_5,j=1,2,3,4,5, because the radius of the spherical region of the experimental design displayed in Table 2 was 5 Thus, with the intervals of 5_Xj_5,j=1,2,3,4,5, we made a search within the spherical region having the radius of 5 for which the constraint was X12+X22+X32+X42+X52_5. This search, which was conducted using SAS data-step programming, determined the optimum point described in Table 6, which states the estimated maximum of the response (Logs10 CFU/mL) as 10.265.

Table 6. Optimization results for the maximization of the response
Estimated maximum of the response (Log10 CFU /mL) X1 X2 X3 X4 X5 Soy peptone (%) Yeast extract (%) Glucose (%) L-Cysteine (%) FeSO4 (%)
10.265 0.95 1.04 0.90 −1.03 −1.07 2.8030 2.8791 0.6196 0.2823 0.0055
Download Excel Table
Drawing response surface contour plots

A plot of response surface contours was drawn for two of the five factors; the vertical axis and the two horizontal axes represented the response predicted from the model and the actual levels of the two explanatory factors, respectively. Fig. 1 contains all 10 such plots. In each plot, the factors not represented by the two horizontal axes are fixed at their optimum actual levels.

jast-63-3-603-g1
Fig. 1. Response surface contour plots of maximum biomass as the function of components. (a) soy peptone and yeast extract, (b) soy peptone and glucose, (c) soy peptone and L-cystein, (d) soy peptone and ferrous sulfate, (e) yeast extract and glucose, (f) yeast extract and L-cystein, (g) yeast extract and ferrous sulfate, (h) glucose and L-cystein, (i) glucose and ferrous sulfate, (j) L-cystein and ferrous sulfate.
Download Original Figure
Experimenting for validation

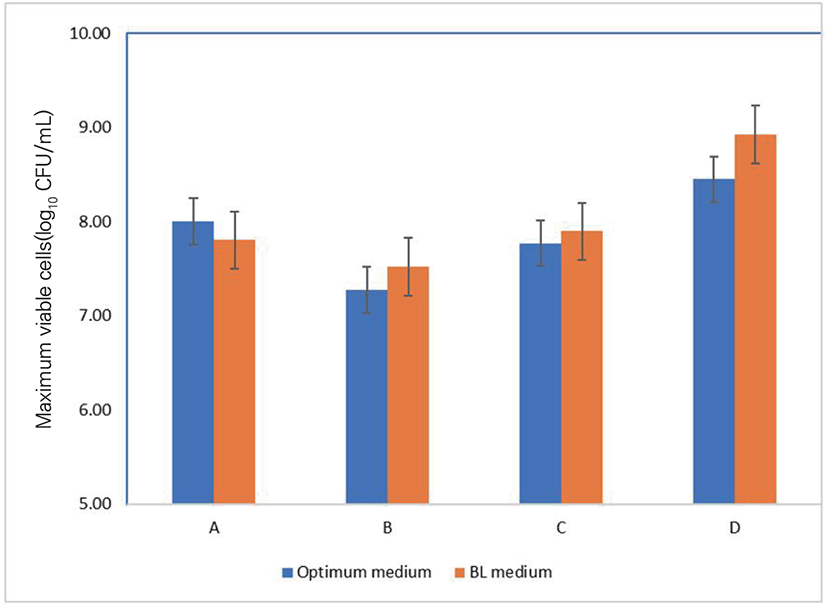
To measure the adequacy of the model (Table 7), a validation experiment was performed at the optimum point of 2.8791% yeast extract, 2.8030% peptone soy, 0.6196% glucose, 0.2823% L-cysteine, and 0.0055% ferrous sulfate, to verify the validity of the optimum medium. Besides, to assess the application potential in manufacturing, it was appropriate to test the mass cell- producing ability of several organism strains as well as assess the economical optimization of the medium. Therefore, three bifidobacterial strains including B. longum ATCC 15907, B. bifidum ATCC 35914 and B. aminalis subsp. lactis BB12 were used in cell count evaluation as well.

Table 7. Optimum medium and the results of the validation experiment
Components BL medium (%) Optimum medium (%)
Meat extract 0.3 -1)
Proteose peptone No.3 1 -
Trypticase 0.5 -
Peptone 0.3 28.030
Yeast extract 0.5 28.791
Liver extract (mL) 15 -
Glucose 1 6.196
Soluble starch 0.05 -
Potassium phosphate buffer (mL) 1 -
 K2HPO4 0.1 -
 KH2PO4 0.1 -
Mineral mixture (mL) 0.5 -
 MgSO4 0.001 -
 FeSO4 0.02 0.055
 NaCl 0.000674 -
 MnSO4 0.001 -
Tween 80 0.1 -
L-Cysteine 0.05 2.823
Distilled water (mL) 1,000 1,000
Price for 250 litters of broth (USD) 515.684 407.638
Cost effect (%) - 79.04

Absence of constituent.

BL, blood-liver.

Download Excel Table

The maximum biomass production at 20 h incubation of bifidobacteria strains was expressed via Fig. 2 and the economical-effect of optimum medium was calculated and shown in Table 7. Fig. 2 showed that in the two media, the numbers of viable cells of all bacterial strains after a 20 h-incubation were similar and there were no concrete differences between the two media. Moreover, the price for producing 250 liters of the media was ≥ $100 US dollars less than the same volume of the BL broth; the new medium costs 79.04% the price of the BL medium (Table 7).

jast-63-3-603-g2
Fig. 2. Biomass production of different bifidobacteria strains in optimized medium and BL medium after 20 h fermentation. (A) Bifidobacterium animalis subsp. lactis JNU306, (B) B. longum ATCC 15907, (C) B. bifidum ATCC 35914, (D) B. aminalis subsp lactis BB12. BL, blood-liver.
Download Original Figure

DISCUSSION

In a similar research to optimize growth conditions of Bifidobacterium pseudocatenulatum G4, a candidate probiotic organism achieved a maximum biomass production of 9.129 Log 10 CFU/mL [9]. Hussain et al. [17] recently reported on the optimal growth conditions of B. bifidum in small scale fermentation, and observed the maximum wet-cell weight at optimized growth condition was 34.1 g/L. The final viable cells increased to 9.398 Log 10 CFU/mL under constant pH condition.

Besides, many intensive studies have been conducted on aspect finding optimized medium for maximum biomass production of many different bacterial species via different parameters such as viable cells Log 10 CFU/mL [9,18,19], maximum specific growth rate per hour [20] or dry cell weight, gram per liter [21]. Thus, in comparison with these published papers, the result of this study is limited. Furthermore, since growth performance is a specific strain, which was very popularly used in manufacturing the optimum medium should be compared on commonly used commercial media with the individual strain.

To test the mass cell-producing ability of several bacterial strains, the maximum biomass obtained from the optimized medium was compared with growth performance in BL broth, which is frequently used as optimal medium [15].

In the two media, the numbers of viable cells of all bacteria were similar and there were no practical differences between the two media. These results suggested the applicability of the optimum medium. Moreover, the cost of the new medium is lower than that of BL medium. These results confirmed that our new optimum medium has potential application in manufacture.

CONCLUSIONS

The use of a new response surface approach as a statistical tool to improve the growth of B. animalis subsp. lactis strain JNU306 within yeast extract, soy-peptone, glucose, L-cysteine, and ferrous sulfate components has been demonstrated in this study. This work has developed a statistical model to assess the third-order polynomial effects between components and established their estimated optimum levels to maximize biomass production. One of the highest viable cell counts was observed: the optimum point was 2.8791% yeast extract, 2.8030% soy-peptone, 0.6196% glucose, 0.2823% L-cysteine, and 0.0055% ferrous sulfate. Through a validation experiment, the optimum medium turned out to be economically viable in that its cultivation amount was the same but production was more cost-effective than BL medium.

Competing interests

No potential conflict of interest relevant to this article was reported.

Funding sources

This work was financially supported by the Graduate School of Public Administration at Korea University in 2020. And also this work was supported by the Basic Science Research Program through the National Research Foundation of Korea (NRF) funded by the Minister of Education, Science, and Technology (NRF-2016R1A2B4007519 and NRF-2019R1A2C108764811).

Acknowledgements

Not applicable.

Availability of data and material

Upon reasonable request, the datasets of this study can be available from the corresponding author.

Authors’ contributions

Conceptualization: Oh S.

Data curation: DangTD.

Formal analysis: Rheem S.

Methodology: DangTD.

Software: Rheem S.

Validation: DangTD, Yong CC.

Investigation: DangTD.

Writing-original draft: DangTD, Yong CC, Rheem S.

Writing-review & editing: Rheem S, Oh S.

Ethics approval and consent to participate

This article does not require IRB/IAUCUC approval because there are no human and animal participants.

REFERENCES

1.

Arunachalam KD. Role of bifidobacteria in nutrition, medicine and technology. Nutr Res. 1999; 19:1559-97

2.

Dave RI, Shah NP. Evaluation of media for selective enumeration of Streptococcus thermophilus, Lactobacillus delbrueckii ssp. bulgaricus, Lactobacillus acidophilus, and bifidobacteria. J Dairy Sci. 1996; 79:1529-36

3.

Masco L, Huys G, De Brandt E, Temmerman R, Swings J. Culture-dependent and culture-independent qualitative analysis of probiotic products claimed to contain bifidobacteria. Int J Food Microbiol. 2005; 102:221-30

4.

Ventura M, Canchaya C, Van Sinderen D, Fitzgerald GF, Zink R. Bifidobacterium lactis DSM 10140: identification of the atp (atpBEFHAGDC) operon and analysis of its genetic structure, characteristics, and phylogeny. Appl Environ Microbiol. 2004; 70:3110-21

5.

Sánchez B, Champomier-Vergès MC, Stuer-Lauridsen B, Ruas-Madiedo P, Anglade P, Baraige F, et al. Adaptation and response of Bifidobacterium animalis subsp. lactis to bile: a proteomic and physiological approach. Appl Environ Microbiol. 2007; 73:6757-67

6.

Barrangou R, Briczinski EP, Traeger LL, Loquasto JR, Richards M, Horvath P, et al. Comparison of the complete genome sequences of Bifidobacterium animalis subsp. lactis DSM 10140 and Bl-04. J Bacteriol. 2009; 191:4144-51

7.

Taipale T, Pienihäkkinen K, Isolauri E, Larsen C, Brockmann E, Alanen P, et al. Bifidobacterium animalis subsp. lactis BB-12 in reducing the risk of infections in infancy. Br J Nutr. 2011; 105:409-16

8.

Bezcorovainy A, Catchpole RM. Biochemistry and physiology of bifidobacteria. Boca Raton, FL: CRC press. 1989

9.

Stephenie W, Kabeir BM, Shuhaimi M, Rosfarizan M, Yazid AM. Growth optimization of a probiotic candidate, Bifidobacterium pseudocatenulatum G4, in milk medium using response surface methodology. Biotechnol Bioprocess Eng. 2007; 12:106-13

10.

Rašić J, Kurmann JA. Bifidobacteria and their role: microbiological, nutritional-physiological, medical and technological aspects and bibliography. Basel: Birkhäuser Verlag. 1983

11.

Montgomery DC. Design and analysis of experiments. Hoboken, NJ: John Wiley & Sons. 1984

12.

Bezerra MA, Santelli RE, Oliveira EP, Villar LS, Escaleira LA. Response surface methodology (RSM) as a tool for optimization in analytical chemistry. Talanta. 2008; 76:965-77

13.

Khuri AI, Mukhopadhyay S. Response surface methodology. Wiley Interdiscip Rev Comput Stat. 2010; 2:128-49

14.

Brown M, Foster JHS. A simple diagnostic milk medium for Pseudomonas aeruginosa. J Clin Pathol. 1970; 23:172-7

15.

Ochi Y, Tomottari M. Studies on Lactobacilli. Jpn J Vet Sci. 1958; 20:71-81

16.

SAS Institute. SAS/STAT user’s guide, release 6.04. Cary, NC: SAS Institute. 1986

17.

Hussain SM, Naik M, Ahmed LA, Udipi M, Sukumaran SK. Bioprocess development for enhanced production of probiotic Bifidobacterium bifidum. Current Sci. 2020; 118:280-5

18.

Oh S, Rheem S, Sim J, Kim S, Baek Y. Optimizing conditions for the growth of Lactobacillus casei YIT 9018 in tryptone-yeast extract-glucose medium by using response surface methodology. Appl Environ Microbiol. 1995; 61:3809-14

19.

Liew S, Ariff AB, Raha AR, Ho YW. Optimization of medium composition for the production of a probiotic microorganism, Lactobacillus rhamnosus, using response surface methodology. Int J Food Microbiol. 2005; 102:137-42

20.

Kiviharju K, Leisola M, Eerikäinen T. Optimization of a Bifidobacterium longum production process. J Biotechnol. 2005; 117:299-308

21.

Sen R, Babu KS. Modeling and optimization of the process conditions for biomass production and sporulation of a probiotic culture. Process Biochem. 2007; 40:2531-8