Journal of Animal Science and Technology
Korean Society of Animal Sciences and Technology
RESEARCH ARTICLE

Accuracy of genotype imputation based on reference population size and marker density in Hanwoo cattle

DooHo Lee1https://orcid.org/0000-0002-2174-7897, Yeongkuk Kim1https://orcid.org/0000-0002-6530-2304, Yoonji Chung1https://orcid.org/0000-0002-6906-6468, Dongjae Lee1https://orcid.org/0000-0002-8140-014X, Dongwon Seo1https://orcid.org/0000-0003-0548-7068, Tae Jeong Choi2https://orcid.org/0000-0002-8299-9342, Dajeong Lim3https://orcid.org/0000-0003-3966-9150, Duhak Yoon4https://orcid.org/0000-0002-3983-9757, Seung Hwan Lee1,*https://orcid.org/0000-0003-1508-4887
1Division of Animal and Dairy Science, Chungnam National University, Daejeon 34134, Korea
2National Institute of Animal Science, Cheonan 31000, Korea
3Animal Genomics and Bioinformatics Division, National Institute of Animal Science, Wanju 55365, Korea
4Department of Animal Science & Biotechnology, Kyungpook National University, Sangju 37224, Korea
*Corresponding author: Seung Hwan Lee, Division of Animal and Dairy Science, Chungnam National University, Daejeon 34134, Korea., Tel: +82-42-821-5772, E-mail: slee46@cnu.ac.kr

© Copyright 2021 Korean Society of Animal Science and Technology. This is an Open-Access article distributed under the terms of the Creative Commons Attribution Non-Commercial License (http://creativecommons.org/licenses/by-nc/4.0/) which permits unrestricted non-commercial use, distribution, and reproduction in any medium, provided the original work is properly cited.

Received: Sep 30, 2021; Revised: Oct 13, 2021; Accepted: Oct 14, 2021

Published Online: Nov 30, 2021

Abstract

Recently, the cattle genome sequence has been completed, followed by developing a commercial single nucleotide polymorphism (SNP) chip panel in the animal genome industry. In order to increase statistical power for detecting quantitative trait locus (QTL), a number of animals should be genotyped. However, a high-density chip for many animals would be increasing the genotyping cost. Therefore, statistical inference of genotype imputation (low-density chip to high-density) will be useful in the animal industry. The purpose of this study is to investigate the effect of the reference population size and marker density on the imputation accuracy and to suggest the appropriate number of reference population sets for the imputation in Hanwoo cattle. A total of 3,821 Hanwoo cattle were divided into reference and validation populations. The reference sets consisted of 50k (38,916) marker data and different population sizes (500, 1,000, 1,500, 2,000, and 3,600). The validation sets consisted of four validation sets (Total 889) and the different marker density (5k [5,000], 10k [10,000], and 15k [15,000]). The accuracy of imputation was calculated by direct comparison of the true genotype and the imputed genotype. In conclusion, when the lowest marker density (5k) was used in the validation set, according to the reference population size, the imputation accuracy was 0.793 to 0.929. On the other hand, when the highest marker density (15k), according to the reference population size, the imputation accuracy was 0.904 to 0.967. Moreover, the reference population size should be more than 1,000 to obtain at least 88% imputation accuracy in Hanwoo cattle.

Keywords: Single nucleotide polymorphism (SNP); Imputation; Hanwoo cattle; Reference population size; Marker density

INTRODUCTION

The complete cattle genome has been sequenced, and Illumina (San Diego, CA, USA) and Affymetrix (Santa Clara, CA, USA) have developed commercial single nucleotide polymorphism (SNP) chips that use chip-based array technology [1]. The development of SNP panels has enabled many studies, such as genome-wide association studies (GWAS) and best linear unbiased prediction (BLUP) studies [2]. Many genetic markers associated with objective breeding traits have been identified for marker-assisted selection [3]. Using a high-density SNP panel in a GWAS increases the probability of finding quantitative trait locus regions [4]. Improved high-density SNP panels also increase the accuracy of genomic breeding value estimations using genomic BLUP [58].

However, it is very difficult to genotype all animals in a population because of the cost of high-density chips. In addition, SNP panels for different platforms, which may differ in density or chip data versions, are not completely compatible. Imputation methods for converting from low- to high-density data are an alternative [9].

Genotype imputation refers to statistical inference of genotype and includes family and population-based methods. Family based methods require sufficient pedigree information to compare reference and test groups, so are difficult to apply when there is no pedigree information or insufficient pedigree depth [10,11]. Population-based methods predict low-density genotypes of animals by referring to a reference population genotyped at high density. This method uses a library and haplotype clustering to find the most appropriate haplotype and genotype [1215]. Many factors affect the imputation accuracy of this method, including the reference population size, relationship between animals in the reference and test populations, minor allele frequency of the SNP to be imputed, proportion of missing genotypes on the low- and high-density panels, marker density, population structure, and the level of linkage disequilibrium (LD) [16]. Generally, family based methods aim to identify the animals to be sequenced, while population-based methods aim at imputation of the genotypes of unrelated individuals. Many studies have examined ways to increase imputation accuracy using population-based imputation software, such as fastPHASE [17], Beagle [18], Minimac [19], and findhap.f90 [20]. However, no studies have examined imputation accuracy in Hanwoo cattle according to the reference population size and marker density. Hanwoo cattle is a native taurine cattle breed in Korea and has been bred as a draft animal since 5,000 years ago. Over time, Hanwoo cattle have been bred for meat production and have become very popular despite high prices due to marbling fat, softness, juiciness, and unique flavor. [21]

Therefore, this study investigated the efficacy of genotyping by imputation of a high-density chip from a low-density one, according to the reference population size and marker density, and proposes an appropriate reference population size for high-quality imputation in Hanwoo cattle.

MATERIALS AND METHODS

Genotypes data

All the data-set (50K genotypes) used in this study was provided from the previous Research Project (BioGreen21, Hanwoo Research Institutes of National Institute of Animal Science, RDA) and current research project (Bridge Project of NIAS, RDA). To investigated imputation accuracy, the 3,821 animals were randomly selected from the population.

Quality control

Genotype data was modified using GenomeStudio (Illumina) ver. 2.0 software with a genotyping module to fit the analysis software format: Illumina data file (.bsc) to genotype file format (.ped). We removed SNPs in unknown chromosomes and sex chromosomes for the next steps. The quality control procedure was performed using plink1.9 software [22]. The raw data has a 95.55% genotyping rate, so missing genotype data phasing was performed as a pre-imputation task for the imputation accuracy as a reference population. SNP data were subjected to strict quality control to minimize the impact of the imputation accuracy on genotyping error: minor allele frequency (0.01), genotyping call rate (0.9), missing individuals (0.1), Hardy-Weinberg equilibrium test p-value (0.0001). After quality control, a total of 38,933 SNPs were used for analysis. the number of SNPs on each chromosome before and after quality control is described in Table 1.

Table 1. Number of SNPs on each chromosomes between before and after in quality control
Chromosome Before QC After QC Removed No. SNP
No. SNP No. SNP
1 3,133 2,567 566
2 2,553 2,037 516
3 2,279 1,905 374
4 2,357 1,901 456
5 2,050 1,611 439
6 2,373 1,980 393
7 2,141 1,725 416
8 2,181 1,786 395
9 1,899 1,541 358
10 1,977 1,618 359
11 2,058 1,666 392
12 1,599 1,280 319
13 1,666 1,370 296
14 1,687 1,386 301
15 1,583 1,255 328
16 1,542 1,222 320
17 1,442 1,189 253
18 1,249 1,001 248
19 1,274 1,047 227
20 1,408 1,144 264
21 1,313 1,048 265
22 1,194 957 237
23 976 817 159
24 1,209 990 219
25 905 747 158
26 1,012 810 202
27 895 727 168
28 889 730 159
29 966 796 170
30 1,044 80 964
Total 48,854 38,933 9,921

SNP, single nucleotide polymorphism; QC, quality control.

Download Excel Table
Imputation scenarios

Imputation scenarios are set based on population size and marker density. The population size controls the size of the reference population, and the marker density controls the maker density of the test population. The test population was selected by the lowest birth year belonging to the data set. Thus, the test population consists of 889 animals, and these were divided into four validation sets. In the reference population, five reference populations were constructed. First, 500, 1,000, 1,500, and 2,000 animals are selected based on the individuals not included in the test population. In addition, 2,000 animals and the remaining test populations not included in each validation were included as reference groups to constitute over 2,000 (3,600) reference groups. When increasing the number of reference populations, the first 500 animals were randomly selected from the data set using the R program ver 3.6 [23], and another 500 animals were added from the remaining individuals. Thus, each scenario set is described in Table 2. and Fig. 1. In addition, three low-density SNP panels are created to use for validation marker density. Each SNP panel selected evenly spaced 5k, 10k, and 15k from a 50k Illumina chip, and the number and average distance of SNPs for each chromosome of these panels are described in Table 3. The test population data were analyzed using the generated low-density SNP panel information. A schematic diagram of the imputation scenario is illustrated in Fig. 2.

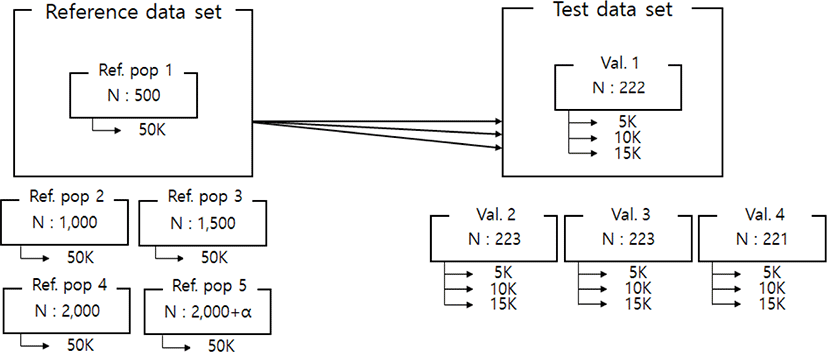
Table 2. Summary of imputation scenarios using different reference population size and validation data set
Scenario set Reference SNP data Reference set Test set Total animal
Validation 1 Validation 2 Validation 3 Validation 4
N % N % N % N % N %
Ref 500 50k 500 0.69 222 0.31 223 0.31 223 0.31 221 0.31 721–723
Ref 1,000 50k 1,000 0.82 222 0.18 223 0.18 223 0.18 221 0.18 1,221–1,223
Ref 1,500 50k 1,500 0.87 222 0.13 223 0.13 223 0.13 221 0.13 1,721–1,723
Ref 2,000 50k 2,000 0.90 222 0.10 223 0.10 223 0.10 221 0.10 2,221–2,223
Ref 2,000+ 50k 3,600 0.94 222 0.06 223 0.06 223 0.06 221 0.06 3,821

Total animal, The total number of the reference population and validation animals; Ref, reference population; SNP, single nucleotide polymorphism.

Download Excel Table
jast-63-6-1232-g1
Fig. 1. Organizing or analyzing data. The raw data consisted of a total of 3,821 individuals born between 1989 and 2013. First, the youngest individuals in the dataset were selected as the validation set. Then, the others were configured as a reference group. The reference group was constructed by changing the group size and the validation group by changing the number of markers. Val, validation.
Download Original Figure
Table 3. Each chromosome information about the number of SNP and average distance according to marker density
Chr Length (Mb) 5k 10k 15k 50k
No. SNP Average distance (kb) No. SNP Average distance (kb) No. SNP Average distance (Kb) No. SNP Average distance (kb)
1 158.1 330 0.48 660 0.24 990 0.16 2,567 0.06
2 136.7 262 0.52 524 0.26 786 0.17 2,037 0.07
3 121.1 245 0.49 490 0.25 735 0.16 1,905 0.06
4 120.5 245 0.49 490 0.24 735 0.16 1,901 0.06
5 121.1 208 0.58 415 0.29 623 0.19 1,611 0.08
6 119.0 256 0.46 512 0.23 768 0.15 1,980 0.06
7 112.4 222 0.50 444 0.25 666 0.17 1,725 0.07
8 113.0 230 0.49 460 0.24 689 0.16 1,786 0.06
9 105.0 198 0.52 396 0.26 594 0.17 1,541 0.07
10 103.1 208 0.49 416 0.25 624 0.16 1,618 0.06
11 107.1 214 0.50 428 0.25 643 0.17 1,666 0.06
12 90.9 164 0.55 328 0.28 493 0.18 1,280 0.07
13 83.9 176 0.48 352 0.24 528 0.16 1,370 0.06
14 83.1 178 0.47 356 0.23 534 0.16 1,386 0.06
15 84.2 162 0.52 324 0.26 485 0.17 1,255 0.07
16 81.2 158 0.51 316 0.25 473 0.17 1,222 0.07
17 74.8 153 0.49 306 0.24 459 0.16 1,189 0.06
18 65.2 128 0.51 256 0.25 384 0.17 1,001 0.07
19 63.5 135 0.46 270 0.23 405 0.15 1,047 0.06
20 71.5 147 0.48 294 0.24 442 0.16 1,144 0.06
21 71.1 136 0.51 272 0.26 407 0.17 1,048 0.07
22 61.1 124 0.49 248 0.24 371 0.16 957 0.06
23 52.2 105 0.50 210 0.25 315 0.17 817 0.06
24 62.1 127 0.49 254 0.24 381 0.16 990 0.06
25 42.7 96 0.44 192 0.22 288 0.15 747 0.06
26 51.0 104 0.49 208 0.24 312 0.16 810 0.06
27 45.3 94 0.48 188 0.24 282 0.16 727 0.06
28 46.2 94 0.49 188 0.25 281 0.16 730 0.06
29 51.1 103 0.48 206 0.24 309 0.16 796 0.06

SNP, single nucleotide polymorphism.

Download Excel Table
jast-63-6-1232-g2
Fig. 2. Imputation scenarios. This figure shows reference population1 and validation1 as examples, and imputation was performed on each marker density (5k, 10k, and 15k). Since the reference data set consists of 5 groups, and the test set consists of 4 validation groups, the imputation process ran 60 times. Ref, reference Val, validation.
Download Original Figure
Linkage disequilibrium

We analyzed the LD level, which is one of the factors affecting imputation accuracy. Because imputation uses haplotype information, imputation accuracy will decrease if the LD levels of the reference population and test population LD levels are different. LD value (r2) between SNPs within 1Mb distance was measured using plink1.9 software. This means that the maximum distance between the markers is 1Mb, and the average r2 value is estimated for each autosomal chromosome. The following formula is used for LD estimation [24].

r 2 = ( p A 1 B 1 p A 1 p B 1 ) 2 p A 1 p A 2 p B 1 p B 2

Where, A1, A2, B1, and B2 are the alleles of SNP A and SNP B, and PA1, PA2, PB1, and P B2 are the corresponding allele frequencies. P A1B1 is the haplotype frequency of A1B1. The average LD levels of the reference and test populations used in all scenarios were analyzed whether they showed a similar pattern according to the SNPs’ distance. Also, the LD pattern was investigated in the test population according to the marker density (5k, 10k, 15k, and 50k).

Genotype imputation

Imputation of low-density (5k, 10k, 15k) data set to high-density (50k) genotypes was performed with the beagle program ver. 3.3 [25]. The beagle program, which is a population-based method, does not require pedigree information. The beagle program clusters haplotypes in each marker using a localized haplotype cluster model and then uses the Hidden Markov Model (HMM) to find the most probable haplotype based on the known genotype of each individual [26]. Therefore, collecting haplotype information and imputing un-genotyped SNP in the reference population is important for imputing validation data from low-density to high-density. The imputation was performed for each chromosome by pairing the reference data set and the validation data set in all scenarios. After imputation, the genotype was recorded for accuracy comparison, the AA, AB, and BB types were changed to 0, 1, and 2, respectively. The ratio was used as the imputation accuracy by direct genotype comparison of raw genotype and imputed genotypes. In addition, how the imputation accuracy changes are checked according to the minor allele frequency, reference population size, and marker density.

RESULTS

Linkage disequilibrium

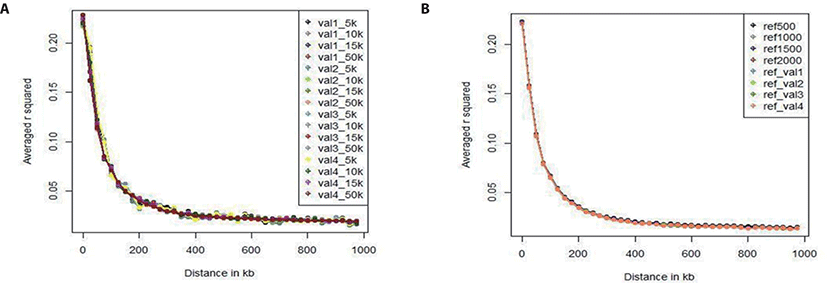
We investigated the LD pattern of all of our scenario sets (Fig. 3). Fig. 3A shows the LD pattern of the four validation sets according to marker density (5k, 10k, and 15k). In all validation sets, the overall LD estimation results showed very similar tendency; the level of LD decreases as the distance to the SNP increases. In each validation set, the LD pattern also differed slightly with the marker density, but the difference was less than 0.01. As there was no difference among the validation sets, the data were free from bias. Fig. 3B shows the LD pattern of the reference sets according to population size. The LD levels of the reference sets used in all scenarios were similar when the reference population size was 500, 1,000, 1,500, 2,000, or 3,600. Because the population size is larger than the validation set, the LD level does not change as the population size changes relative to the reference population. In addition, the LD level difference among the reference groups was smaller than the LD level difference among the validation sets. Comparing the validation set with the reference population set showed that the LD levels have similar patterns. In particular, the distance between SNPs can be divided into 0–20, 20–50, 50–100, 100–200, 200–500, 500–1,000 kb. Table 4 gives the number of SNP pairs in the reference and validation sets, and the average r-square (r2) values and deviations. As the distance between SNPs increased, the number of SNP pairs gradually increased; there were 750 pairs at 0–20 kb and 500,000 at 200–1,000 kb. The r2 value was 0.28 (0.32) at 0–20 kb and 0.02 (0.04) at 200–1,000 kb; it decreased rapidly up to the first 200 kb, and decreased slowly thereafter.

Table 4. Linkage disequilibrium (r2) information in all scenario data sets
Data type 0–20 kb interval 20–50 kb interval 50–100 kb interval 100–200 kb interval 200–1,000 kb interval
No. SNP pair Average r2 (SD) No. SNP pair Average r2 (SD) No. SNP pair Average r2 (SD) No. SNP pair Average r2 (SD) No. SNP pair Average r2 (SD)
Val 1 750 0.28 (0.33) 22,732 0.17 (0.25) 33,014 0.10 (0.17) 64,732 0.06 (0.11) 500,518 0.02 (0.04)
Val 2 751 0.28 (0.33) 22,722 0.17 (0.25) 33,002 0.10 (0.17) 64,713 0.06 (0.11) 500,429 0.02 (0.04)
Val 3 751 0.28 (0.33) 22,731 0.17 (0.25) 33,010 0.10 (0.17) 64,732 0.06 (0.11) 500,464 0.02 (0.04)
Val 4 752 0.28 (0.33) 22,727 0.17 (0.25) 33,006 0.10 (0.17) 64,704 0.06 (0.11) 500,397 0.02 (0.04)
Ref 500 744 0.27 (0.32) 22,572 0.17 (0.24) 32,793 0.09 (0.16) 64,243 0.05 (0.10) 496,752 0.02 (0.04)
Ref 1,000 749 0.27 (0.32) 22,604 0.17 (0.24) 32,814 0.09 (0.16) 64,299 0.05 (0.10) 497,219 0.02 (0.04)
Ref 1,500 749 0.27 (0.32) 22,618 0.17 (0.24) 32,827 0.09 (0.16) 64,374 0.05 (0.10) 497,641 0.02 (0.04)
Ref 2,000 750 0.27 (0.32) 22,646 0.17 (0.24) 32,877 0.09 (0.16) 64,488 0.05 (0.10) 498,467 0.02 (0.04)
Ref 2,000 + (val 1) 752 0.27 (0.32) 22,739 0.17 (0.24) 33,025 0.09 (0.16) 64,758 0.05 (0.10) 500,701 0.02 (0.04)
Ref 2,000 + (val 2) 752 0.27 (0.32) 22,739 0.17 (0.24) 33,025 0.09 (0.16) 64,758 0.05 (0.10) 500,701 0.02 (0.04)
Ref 2,000 + (val 3) 752 0.27 (0.32) 22,739 0.17 (0.24) 33,025 0.09 (0.16) 64,758 0.05 (0.10) 500,701 0.02 (0.04)
Ref 2,000 + (val 4) 752 0.27 (0.32) 22,739 0.17 (0.24) 33,025 0.09 (0.16) 64,758 0.05 (0.10) 500,701 0.02 (0.04)

SNP, single nucleotide polymorphism; Val, validation, Ref, reference population.

Download Excel Table
Imputation accuracy

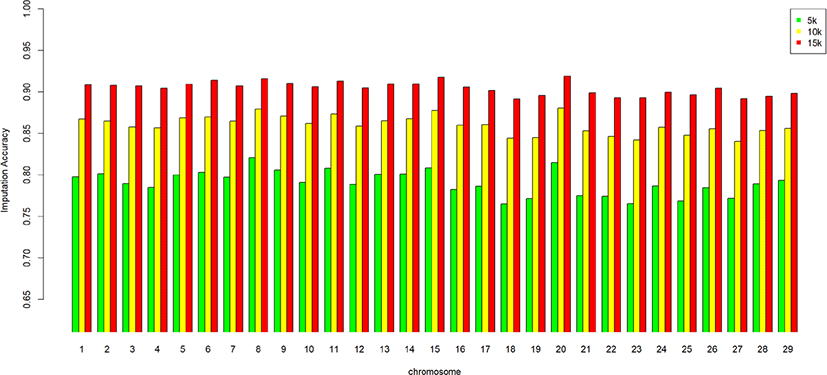
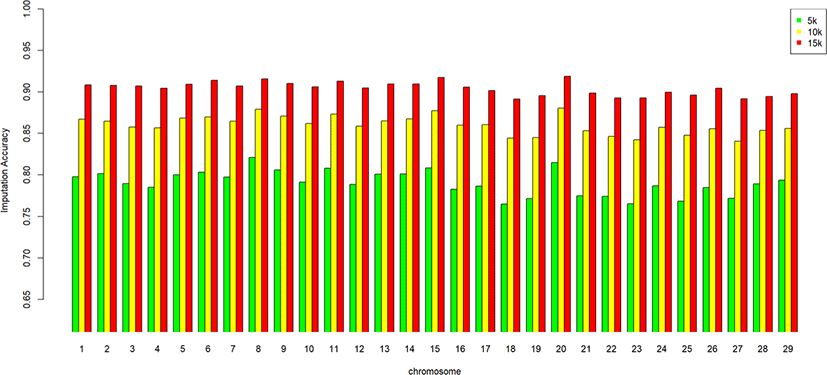
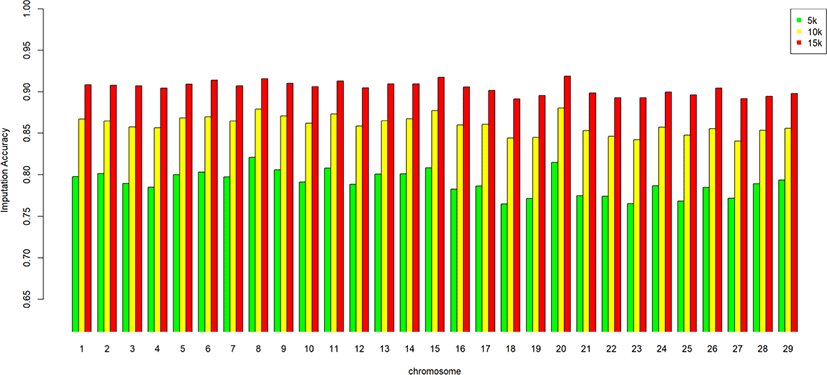
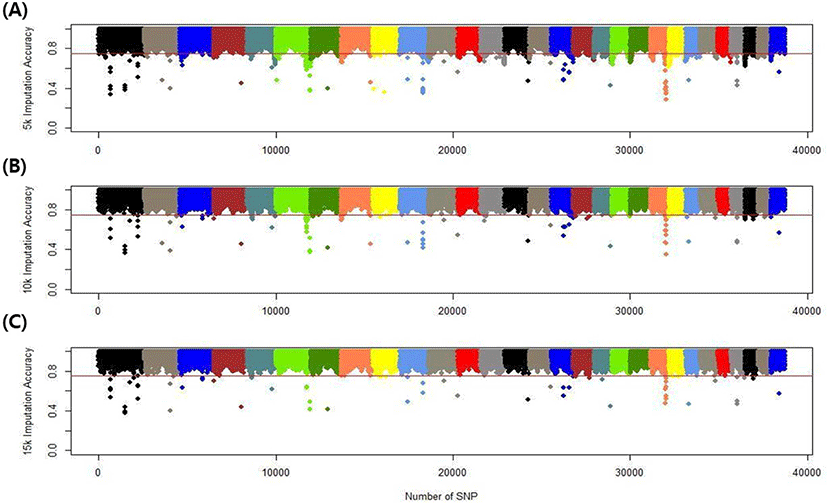
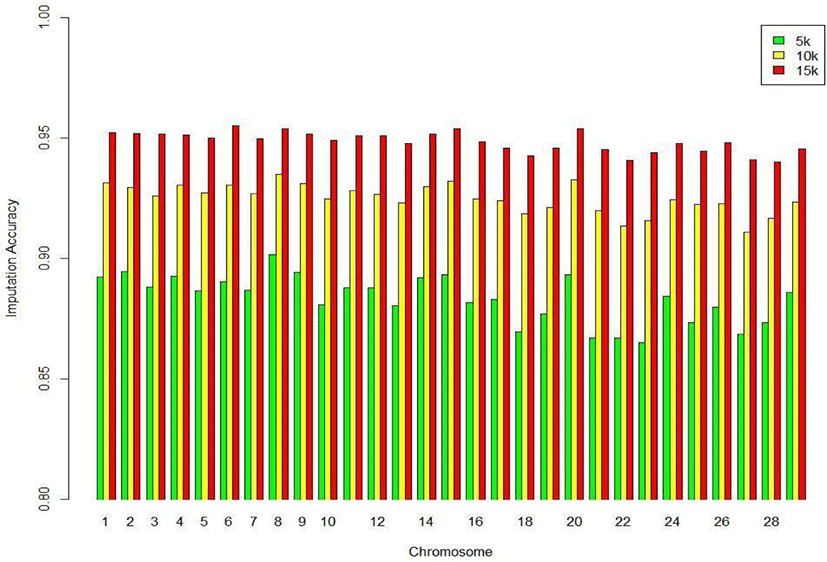
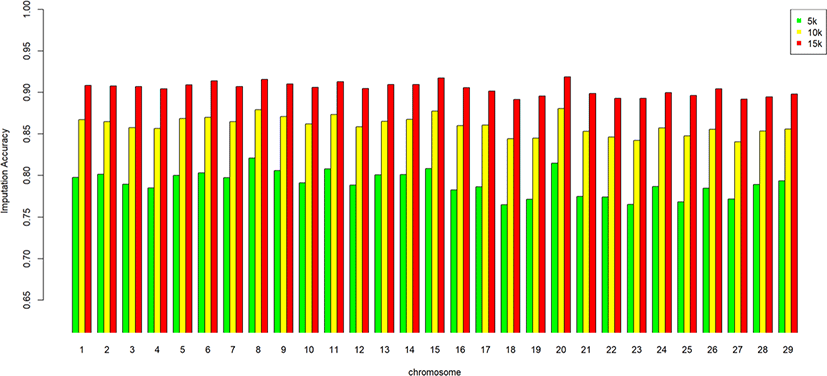
We assessed the genotype imputation accuracy according to the SNP panel density and reference population size. The average of the four validation sets represents the accuracy of each scenario. The lowest imputation accuracy was 79% with 5k marker density and a reference population of 500, and the highest accuracy was 97% with 15k marker density and a reference population over 2,000 (3,600). When we assessed the accuracy of each validation set, the maximum difference among the sets was about 4%, when the reference population size was 1,000 and the marker density 5k. The other scenarios had similar imputation accuracies. Fig. 4 plots the accuracy according to the marker density of each chromosome for a reference population of 1,500 (The imputation accuracies for each chromosome for reference population sizes 500, 10,00, 2,000, and over 2,000 are presented in Figs. 58); chromosome 21 show maximum variability in imputation accuracy. Fig. 9 plots the misplaced SNPs on the entire autosomal segment with markers of 5k (A), 10k (B), and 15k (C) from above and confirms the presence of several regions with poor imputation quality. Based on 0.75 as a threshold, 1275 SNPs were identified as substandard at 5k, 151 SNPs at 10k, and 65 SNPs were identified as substandard at 15k.
jast-63-6-1232-g3
Fig. 3. The interval means linkage disequilibrium (r2) value between marker pairs about the marker distance according to the test set (A) and reference set (B). (A) Total four validation data sets have different marker density consisted of 5k, 10k, 15k, and 50k for imputation. (B) Total five reference data sets consisted of 500, 1,000, 1,500, 2,000, and over 2,000 (3,600). In addition, over 2,000 reference data include other validation data also into reference data.
Download Original Figure
jast-63-6-1232-g4
Fig. 4. Average imputation accuracy of each chromosome different marker density in reference population size 1,500. The average accuracy of each chromosome is indicated by a different color depending on the marker density of the test data set, which is 5k, 10k, 15k represented to green, yellow, and red, respectively.
Download Original Figure
jast-63-6-1232-g5
Fig. 5. Average imputation accuracy of each chromosome different marker density in reference population size 500. The average accuracy of each chromosome is indicated by a different color depending on the marker density of the test data set, which is 5k, 10k, 15k represented to green, yellow, and red, respectively.
Download Original Figure
jast-63-6-1232-g6
Fig. 6. Average imputation accuracy of each chromosome different marker density in reference population size 1,000. The average accuracy of each chromosome is indicated by a different color depending on the marker density of the test data set, which is 5k, 10k, 15k represented to green, yellow, and red, respectively.
Download Original Figure
jast-63-6-1232-g7
Fig. 7. Average imputation accuracy of each chromosome different marker density in reference population size 2,000. The average accuracy of each chromosome is indicated by a different color depending on the marker density of the test data set, which is 5k, 10k, 15k represented to green, yellow, and red, respectively.
Download Original Figure
jast-63-6-1232-g8
Fig. 8. Average imputation accuracy of each chromosome different marker density in reference population size over 2,000. The average accuracy of each chromosome is indicated by a different color depending on the marker density of the test data set, which is 5k, 10k, 15k represented to green, yellow, and red, respectively.
Download Original Figure
jast-63-6-1232-g9
Fig. 9. Average imputation accuracy of each SNPs different marker density in reference population size 1,500. We did genome-wide plotting for each SNP imputation accuracy to find a region where the low imputation efficiency. Each chromosome has a different color, and the inferior area exists at the end of the chromosome. As the marker density increases; (A) 5k, (B) 10k and (C) 15k from above, the overall imputation accuracy also increases. 1,275 SNPs were identified as substandard at 5k, 151 SNPs at 10k, and 65 SNPs were identified as substandard at 15k. Brown horizontal threshold set to 0.75. SNP, single nucleotide polymorphism.
Download Original Figure
Imputation accuracy by marker density

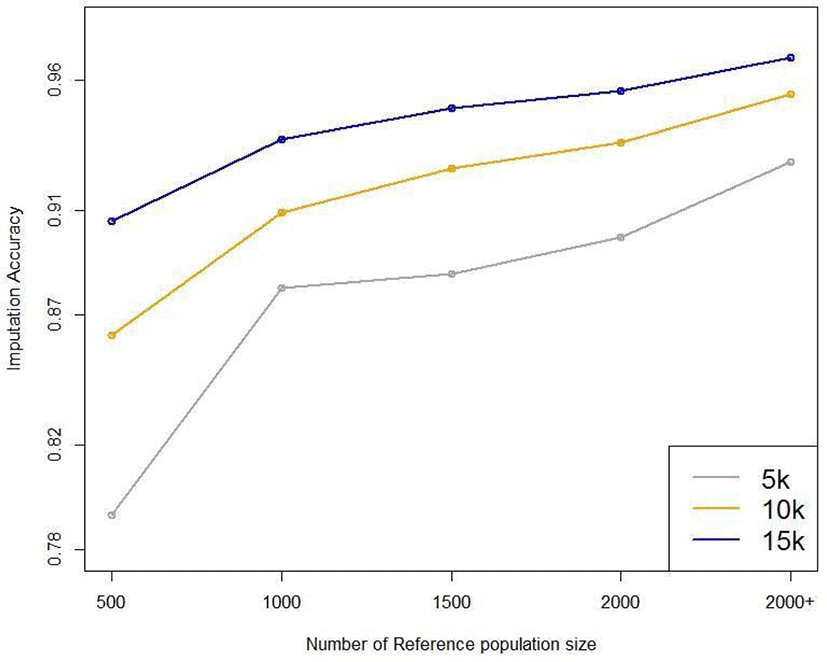
This study investigated the effect of marker density on imputation accuracy. Three low-density (5k, 10k, and 15k) datasets were used as marker data for validation and imputed to high-density (50k; 38,933). In the 5k marker dataset, the imputation accuracy was 0.793–0.929, with a 13.6% accuracy difference according to the reference population size. In comparison, in the 15k marker dataset, the imputation accuracy was 0.904–0.967, with a 6.3% accuracy difference according to the reference population size (Table 5). This shows that the higher the density of the validation set, the greater the imputation accuracy; moreover, the imputation accuracy difference according to reference population size is much greater at low than high density. The difference in imputation accuracy between 5k and 10k is also more significant than that between 10k and 15k. The efficiency of imputation increased with marker density in the validation set. Imputation took a comparatively long time when the marker density of the validation set was low. Time costs are not shown in this study.

Table 5. Average imputation accuracy of validation data sets
Density No. Ref Val 1 Val 2 Val 3 Val 4 Average SD
5k 500 0.796 0.789 0.797 0.792 0.793 0.004
1,000 0.862 0.938 0.862 0.861 0.881 0.038
1,500 0.886 0.883 0.888 0.886 0.886 0.002
2,000 0.899 0.897 0.902 0.9 0.9 0.002
2,000+ 0.929 0.926 0.931 0.929 0.929 0.002
10k 500 0.864 0.859 0.864 0.861 0.862 0.002
1,000 0.909 0.907 0.911 0.91 0.909 0.002
1,500 0.927 0.924 0.928 0.927 0.926 0.001
2,000 0.936 0.934 0.938 0.937 0.936 0.002
2,000+ 0.955 0.953 0.956 0.955 0.955 0.001
15k 500 0.907 0.904 0.908 0.906 0.906 0.002
1,000 0.938 0.936 0.939 0.938 0.937 0.001
1,500 0.949 0.948 0.951 0.95 0.949 0.001
2,000 0.955 0.954 0.957 0.956 0.956 0.001
2,000+ 0.969 0.967 0.969 0.969 0.969 0.001

Ref, reference Val, validation.

Download Excel Table
Imputation accuracy by reference population size

Five reference populations were examined: 500, 1,000, 1,500, 2,000, and 3,600. When selecting the animals for the reference population, we used random sampling based on birth year; the relatedness of the animals was not considered. Fig. 10 plots the average imputation accuracy according to reference population size and test data marker density. For the smallest reference population (n = 500), the imputation accuracy was 0.793–0.906, differing by 11.3% according to marker density. For the largest reference population (3,600), the imputation accuracy was 0.929–0.969, differing by 4% according to marker density (Table 5). These results show that the larger the reference population, the higher the imputation accuracy. Moreover, the difference in imputation accuracy according to marker density is much more significant with small reference populations. When the reference population in Hanwoo cattle exceeds 1,000, the average imputation accuracy exceeds 88%, even using 5 k SNP data (Fig. 10). The imputation efficiency increased with reference population size, and imputation took longer if the reference population was small.
jast-63-6-1232-g10
Fig. 10. The Average accuracy of imputation according to reference population size and validation data marker density. The validations average imputation accuracy was calculated according to the reference population size, which was displayed according to the density of each marker density. Gray, yellow, and blue represent 5k, 10k, and 15k, respectively.
Download Original Figure
Imputation accuracy by minor allele frequency

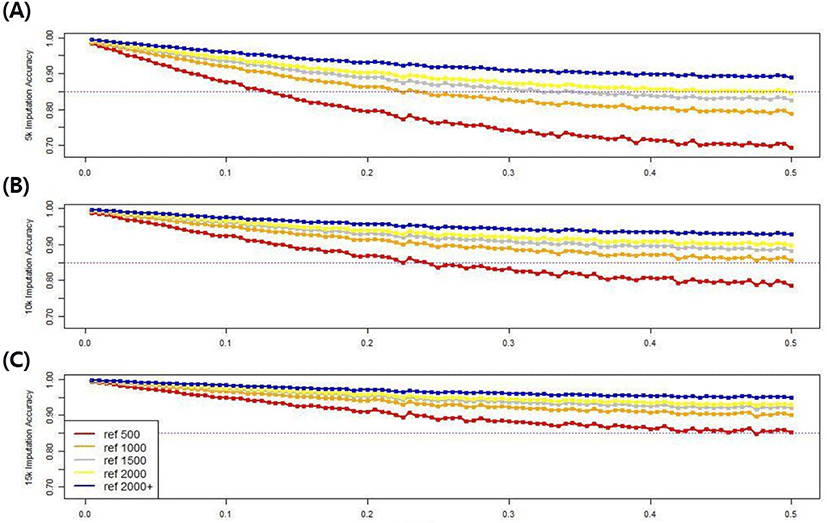
To investigate the effect of minor allele frequency, which affects imputation accuracy, the minor allele frequency of all SNPs was increased from 0 to 0.5 in 0.005 increments, with 100 groups in all scenarios. The imputation accuracy of each minor allele group based on population size and marker density was compared. Fig. 11 shows the imputation accuracy in five reference populations with three different marker densities up to 50k, according to the minor allele frequencies. The imputation accuracy was negatively related to the minor allele frequency, confirming that the imputation accuracy decreased as the minor allele frequency increased. Using the 5k marker data in the validation set, the 0.005 and 0.5 groups had accuracies of 98.3%–99.4% and 69.4%–88.9%, respectively, depending on the size of the reference group, and the difference in accuracy was 10.5%–28.9%. However, when the 15k marker data was used in the validation set, the 0.005 and 0.5 groups had respective accuracies of 99.3%–99.7% and 85.2%–94.9%, varying depending on the reference population size, and a 4.7%–14.1% accuracy difference. Therefore, as the marker density or reference population size increases, the difference in imputation accuracy decreases, even if the frequency of minor alleles increases. There was a clear distinction among scenarios when the imputation accuracy threshold was 85%. If a 15k marker density was used in all scenarios, the accuracy exceeded the threshold value.
jast-63-6-1232-g11
Fig. 11. The average accuracy of imputation according to marker density and minor allele frequency and reference population. The minor allele frequency was divided into 100 groups between 0 and 0.5 by 0.005, and then calculated the average accuracy of SNPs belonging to the group (A) 5k, (B) 10k and (C) 15k. SNP, single nucleotide polymorphism.
Download Original Figure

DISCUSSION

In this study, we use Hanwoo genotype dataset from BioGreen 21 data set of National Institute of Animal Science, RDA, to generate scenario data for genotype imputation. The validation data were the data set of the youngest 889 animals; and these were divided into four validation sets. The others were used as a reference group to perform imputation using Beagle 3.3, a population-based method.

The imputation accuracy was examined by direct comparison between the true and imputed genotypes. We investigated LD in Hanwoo cattle because the population LD level affects the imputation accuracy. Uemeto et al. (2015) confirmed that Japanese black cattle had 0.1 LD (r2) when there was 200 kb between SNP pairs [27]. Using 16 Holstein breeds, Hoze et al. (2013) reported 0.2 LD (r2) when there was 100 kb between SNP pairs [28]. Thus, high LD means that the association between SNP markers is also high. This increases the probability of appropriate inference for closely located SNPs during imputation. Hanwoo cattle have a lower LD value than other cattle breeds and require a larger reference population to achieve high imputation accuracy.

Imputation accuracy of 95% in Japanese black cattle was obtained with reference populations greater than 400 [27]. In comparison, 90% imputation accuracy was obtained in Holstein cattle with reference populations greater than 300, and 95% imputation accuracy in Fleckvieh cattle with reference populations greater than 400 [29]. In Hanwoo cattle, the imputation accuracy was 88% at low-density (5k) for reference populations greater than 1,000, while it was the same as in Holsteins (where long chromosomes have greater imputation accuracy than short ones) [30].

Imputation accuracy is also influenced by the marker density of the validation data. In dairy cattle, the imputation accuracy of a reference population of 2,406 was 72%, 82%, 91%, 93%, and 97% at marker densities of 384, 768, 1,536, 2,480, and 6,177, respectively [31]. In this study, comparing the results of three low-density panels (5k, 10k, and 15k), the accuracy differed by up to 13.6% according to the marker density. We need to assess imputation accuracy according to the reference population size because, as the population size increases, the haplotype data increase along with the explanatory power of each haplotype, and the imputation error rate decreases. We assessed imputation accuracy according to five reference population sizes, to determine the effect of reference population size on imputation accuracy in Hanwoo cattle. When the imputation was performed with a reference population over 2,000 (3,600), the accuracy was 93% at the lowest density (5k), which is lower than in other breeds.

The minor allele frequency also negatively affects the imputation accuracy. Because imputation imputes missing values through a statistical method, a correct genotype is accidentally introduced more often at a low minor allele frequency [27,32]. However, as the marker density or reference population size increases, the difference in imputation accuracy decreases, even if the frequency of minor alleles increases.

In conclusion, the imputation accuracy difference was 6.3%–13.6% among marker densities, varying depending on the reference population size, and 4%–11.3% among reference population sizes, varying according to marker density. In Hanwoo cattle, a reference population of at least 1,000 is needed to obtain more than 88% imputation accuracy.

Competing interests

No potential conflict of interest relevant to this article was reported.

Funding sources

This study was supported by Research Funding (2020-0534-01) of Chungnam National University.

Acknowledgements

This work was supported by a grant and genomic data for imputation from the BioGreen 21 Program(No. 015658022021), Rural Development Administration, Korea.

Availability of data and material

Upon reasonable request, the datasets of this study can be available from the corresponding author.

Authors’ contributions

Conceptualization: Lee SH.

Data curation: Chung Y, Lee D, Lee SH.

Formal analysis: Lee DH, Kim Y Lee SH.

Methodology: Lee DH, Seo D, Lee SH.

Software: Lee DH, Choi TJ, Lim D.

Validation: Lee DH, Yoon D.

Investigation: Lee DH, Lee SH.

Writing - original draft: Lee DH, Lee SH.

Writing - review & editing: Lee DH, Chung Y, Lee D, Seo D, Choi TJ, Lim D, Yoon D, Lee SH.

Ethics approval and consent to participate

This article does not require IRB/IACUC approval because there are no human and animal participants.

REFERENCES

1.

Meuwissen THE, Hayes BJ, Goddard ME. Prediction of total genetic value using genome-wide dense marker maps. Genetics. 2001; 157:1819-29

2.

Hayes BJ, Visscher PM, Goddard ME. Increased accuracy of artificial selection by using the realized relationship matrix. Genet Res. 2009; 91:47-60

3.

Lande R, Thompson R. Efficiency of marker-assisted selection in the improvement of quantitative traits. Genetics. 1990; 124:743-56

4.

Zheng HJ, Wu AZ, Zheng CC, Wang YF, Cai R, Shen XF, et al. QTL mapping of maize (Zea mays) stay-green traits and their relationship to yield. Plant Breed. 2009; 128:54-62

5.

Zhang Z, Ding X, Liu J, Zhang Q, de Koning DJ. Accuracy of genomic prediction using low-density marker panels. J Dairy Sci. 2011; 94:3642-50

6.

Wang Q, Yu Y, Yuan J, Zhang X, Huang H, Li F, et al. Effects of marker density and population structure on the genomic prediction accuracy for growth trait in Pacific white shrimp Litopenaeus vannamei. BMC Genet. 2017; 18:45

7.

Habier D, Fernando RL, Dekkers JCM. Genomic selection using low-density marker panels. Genetics. 2009; 182:343-53

8.

Meuwissen THE. Accuracy of breeding values of ‘unrelated’ individuals predicted by dense SNP genotyping. Genet Sel Evol. 2009; 41:35

9.

Weigel KA, de los Campos G, González-Recio O, Naya H, Wu XL, Long N, et al. Predictive ability of direct genomic values for lifetime net merit of Holstein sires using selected subsets of single nucleotide polymorphism markers. J Dairy Sci. 2009; 92:5248-57

10.

Cheung CYK, Thompson EA, Wijsman EM. GIGI: an approach to effective imputation of dense genotypes on large pedigrees. Am J Hum Genet. 2013; 92:504-16

11.

Saad M, Wijsman EM. Power of family-based association designs to detect rare variants in large pedigrees using imputed genotypes. Genet Epidemiol. 2014; 38:1-9

12.

Marchini J, Howie B, Myers S, McVean G, Donnelly P. A new multipoint method for genome-wide association studies by imputation of genotypes. Nat Genet. 2007; 39:906-13

13.

Howie BN, Donnelly P, Marchini J. A flexible and accurate genotype imputation method for the next generation of genome-wide association studies. PLOS Genet. 2009; 5e1000529

14.

O’Connell J, Gurdasani D, Delaneau O, Pirastu N, Ulivi S, Cocca M, et al. A general approach for haplotype phasing across the full spectrum of relatedness. PLOS Genet. 2014; 10e1004234

15.

Hickey JM, Kinghorn BP, Cleveland MA, Tier B, van der Wer JHJ. Recursive long range phasing and long haplotype library imputation: building a global haplotype library for Holstein cattle.In Proceedings of the World Congress on Genetics Applied to Livestock Production. 2010; Leipzig, Germany. p p. 0944

16.

Hickey JM, Crossa J, Babu R, de los Campos G. Factors affecting the accuracy of genotype imputation in populations from several maize breeding programs. Crop Sci. 2012; 52:654-63

17.

Scheet P, Stephens M. A fast and flexible statistical model for large-scale population genotype data: applications to inferring missing genotypes and haplotypic phase. Am J Hum Genet. 2006; 78:629-44

18.

Browning SR, Browning BL. Rapid and accurate haplotype phasing and missing-data inference for whole-genome association studies by use of localized haplotype clustering. Am J Hum Genet. 2007; 81:1084-97

19.

Howie B, Fuchsberger C, Stephens M, Marchini J, Abecasis GR. Fast and accurate genotype imputation in genome-wide association studies through pre-phasing. Nat Genet. 2012; 44:955-9

20.

VanRaden PM. Genomic evaluations with many more genotypes and phenotypes.In Proceedings of the World Congress on Genetics Applied to Livestock Production. 2010; Leipzig, Germany. p p. 0027

21.

Sambrook J, Fritsch EF, Maniatis T. Molecular cloning: a laboratory manual. New York: Cold Spring Harbor Laboratory Press. 1989

22.

Purcell S, Neale B, Todd-Brown K, Thomas L, Ferreira MAR, Bender D, et al. PLINK: a tool set for whole-genome association and population-based linkage analyses. Am J Hum Genet. 2007; 81:559-75

23.

R Core Team. R: a language and environment for statistical computing [Internet]. R Foundation for Statistical Computing. 2016 [cited 2021 Aug 7]https://www.R-project.org/

24.

Hill WG, Robertson A. Linkage disequilibrium in finite populations. Theor Appl Genet. 1968; 38:226-31

25.

Browning BL, Yu Z. Simultaneous genotype calling and haplotype phasing improves genotype accuracy and reduces false-positive associations for genome-wide association studies. Am J Hum Genet. 2009; 85:847-61

26.

Browning SR, Weir BS. Population structure with localized haplotype clusters. Genetics. 2010; 185:1337-44

27.

Uemoto Y, Sasaki S, Sugimoto Y, Watanabe T. Accuracy of high-density genotype imputation in Japanese Black cattle. Anim Genet. 2015; 46:388-94

28.

Hozé C, Fouilloux MN, Venot E, Guillaume F, Dassonneville R, Fritz S, et al. High-density marker imputation accuracy in sixteen French cattle breeds. Genet Sel Evol. 2013; 45:33

29.

Pausch H, Aigner B, Emmerling R, Edel C, Götz KU, Fries R. Imputation of high-density genotypes in the Fleckvieh cattle population. Genet Sel Evol. 2013; 45:3

30.

Erbe M, Hayes BJ, Matukumalli LK, Goswami S, Bowman PJ, Reich CM, et al. Improving accuracy of genomic predictions within and between dairy cattle breeds with imputed high-density single nucleotide polymorphism panels. J Dairy Sci. 2012; 95:4114-29

31.

Chen L, Li C, Sargolzaei M, Schenkel F. Impact of genotype imputation on the performance of GBLUP and Bayesian methods for genomic prediction. PLOS ONE. 2014; 9e101544

32.

Zhang Z, Xiao X, Zhou W, Zhu D, Amos CI. False positive findings during genome-wide association studies with imputation: influence of allele frequency and imputation accuracy. Hum Mol Genet. 2021; :ddab203