INTRODUCTION
Pork is the most consumed meat in the world, and has long established its position as a staple food on the market [1]. Consumption of pork is growing rapidly and steadily in the Asian market [2]. To accommodate this growth, the Animal Products Grading Service (APGS) has been established in South Korea, resulting in changes in the livestock product industry. The introduction of the APGS has led to reliable meat distribution and reasonable prices between consumers and suppliers, providing various options of meat cuts and quality [3]. Pork grade information allows consumers to purchase pork at a desired price and increases the production of high-grade pork due to the preference of higher grades [4]. Thus, for the production and consumption of high-quality pork, the accuracy of pig carcass grading service has become important.
As pork consumption increases, the number of abattoirs slaughtering more than 300 pigs per hour rises owing to modernisation and scale-up of slaughter facilities [5]. The increased rate of slaughter in abattoirs has raised the need for rapid and accurate judgement of pig carcasses. Efforts to improve pig carcass judgement have been conducted worldwide through the use of devices that can estimate the lean meat percentage (LMP) of pig carcasses, such as Fat-O-Meat’er (FOM), UltraFOM (UFOM), AutoFOM, and Vision-Based Video Image Analyzer (VCS2000) [6–9]. Accordingly, in Korea, non-destructive automated inspection methods, such as the AutoFOM and VCS2000 systems, have been implemented to improve slaughter efficiency in abattoirs. AutoFOM uses the reflectance of ultrasound to automatically measure LMP and fat thickness [10]. VCS2000 system is an image processing-based method that automatically detects the LMP of half carcasses, capable of measuring pig carcass at an average speed of more than 600 heads per hour [11]. Both non-destructive automated inspection methods for predicting the LMP of a pig carcass passed European standards, but the AutoFOM method showed a lower error rate [12]. Nevertheless, the VCS2000 image processing-based system can automatically detect the LMP of half pig carcasses at high speed [13]. For the efficient calculation of LMP using the VCS2000 system, a calibration equation must be developed from the carcass image parameters. However, because the calibration equation is influenced by the breed and genetic difference of pigs, the existing European equation is not effective for use in Korea [8]. For the effective calculation of LMP utilising the VCS2000 system, a calibration equation for Korean pig breeds is required. Therefore, a calibration equation was developed to the estimation of LMP in Korean whole pig carcasses and lean meat yield of their primal cuts, which is expected to improve the speed, accuracy, and objectiveness of pig carcass judgement [14].
An automated, LMP-based system for pig carcass has been applied in some abattoirs to improve the efficiency of pig slaughter and to obtain objective grading parameters [5]. Domestic pig carcass grading is determined by carcass quality and meat quality, including 21 parameters: backfat thickness (BFT), hot carcass weight (CWT), sex, appearance, meat quality, and defects [15]. Non-destructive method estimated lean meat yield of pig carcass including BFT and CWT, as well as allow for more objective pork grading than conventional manual judgement. Therefore, in order to increase the efficiency of pig slaughter through the non-destructive method, the correct estimation of the automated method that can accommodate the existing pig carcass judgement should be made.
In the present study, we aimed to identify whether the estimated traits accord with the actual measured traits through verifying the previously developed calibration equation. The accuracy of the developed calibration equation based on the relationship between the measured traits (BFT and CWT) and the estimated traits was evaluated considering the effects of sex, abattoir, and season that affect actual slaughter. Furthermore, the optimal estimated regression equation for the measured BFT and CWT traits was formulated. Through this, it is possible to reconsider the efficiency in actual abattoirs, and it is expected that can be used as a parameters for more objective grading judgement.
MATERIALS AND METHODS
A total of 1,069,019 Landrace × Yorkshire × Duroc (LYD) pigs (524,001 females, 6,444 males, and 538,574 castrated males) slaughtered between January and December 2019 were assessed in this study. All the pigs were slaughtered at three abattoirs following standard procedures under the supervision of the Korean Grading Service for Animal Products. BFT and CWT were measured immediately after slaughter. BFT was measured with ruler at the 11th/12th thoracic vertebrae and the 14th thoracic vertebra/1st lumbar vertebra on the left half of each carcass, and the average of two measurements was used for analysis.
The traits of pig carcasses were estimated to non-destructive automated inspection method using the VCS2000 system (E+V Tehchnology GmbH & Co.KG, Oranienburg, Germany). VCS2000 non-destructive method calculates the LMP in half carcass through video image systems [7]. However, because the variables measured by VCS2000 is influenced by the breed and genetic difference of pigs, efficient LMP prediction requires a calibrated equation [8]. Therefore, the traits of pig carcasses were estimated by applying the calibration equation developed for estimating the LMP and lean meat yield of Korean pig carcasses [14]. A total of 46 traits of main cuts were estimated using the non-destructive inspection method, and the estimated traits were then divided into five categories: 5 BFT-related traits (BFT, BFT in the 11th/12th thoracic vertebrae [BFT11/12], BFT in the 14th thoracic vertebra/1st lumbar vertebra [BFT14/1], BFT in the 7th multifidus muscle, and BFT in the 1st/2th thoracic vertebrae), 21 major cut-related traits (rib weight, rib trim weight, rib meat weight, neck weight, neck trim weight, neck meat weight, shoulder weight [SWT], shoulder trim weight, shoulder meat weight, tenderloin weight, tenderloin trim weight, tenderloin meat weight, belly weight, belly trim weight, belly meat weight, loin weight [LWT], loin trim weight, loin meat weight, ham weight, ham trim weight, and ham meat weight), 5 pork belly-related traits (belly fat weight, belly rate, belly trim rate, 10-cm neck fat thickness, and intra-fat thickness), 10 traits related to other parts (CWT, front weight [FWT], middle weight [MWT], rear weight, foreshank weight, front meat weight, diaphragm weight, middle meat weight, hindshank weight, and rear meat weight), and 5 total traits (total skin weight, total fat weight, total bone weight [TBWT], total meat weight, and LMP).
The SAS 9.4 statistical software package (SAS Institute, Cary, NC, USA) was used to calculate the mean, standard deviation, and range of the measured (BFT and CWT) and estimated traits of pig carcasses. Pearson correlation coefficients [16] were used to assess the relationship between two measured traits (BFT and CWT) and 46 estimated traits.
Analysis of variance [17] was performed using the general linear model in SAS to simultaneously consider three fixed effects (abattoir, sex, and season) in the optimal estimated regression equation. The fixed effects comprised 3 abattoirs (abattoir A, B, and C), 3 sexes (females, males, and castrated males), and 2 seasons (summer and non-summer). Seasons were divided into summer (June, July, and August) and non-summer to consider the relationship between the high temperature in summer and productivity [18]. Differences in the measured traits (BFT and CWT) according to each fixed effect were analysed using t-tests [19], which was used to compare means between groups and to determine whether the differences in means were statistically significant [20].
The 46 estimated traits for the two measured traits (BFT and CWT) were further subjected to stepwise regression analysis [21] using the REG procedure in SAS. The inclusion or exclusion of significant traits was set to a common level (p < 0.001). The model was y = β0 + Xb + βnXb + є, where y is the measured trait; β0 is the general intercept; in Xb, X is the design matrix of a fixed effect and b is the fixed effect (abattoir, sex, and season); in βnXb, βn is the estimated regression coefficient for each estimated trait and Xb is the estimated trait; and є is the model error. For each dependent variable, the top three estimated traits that could sufficiently describe the model by considering the coefficient of determination (R2) were used in the final estimated regression model. Each of the top three estimated traits, which could better explain the relationship between the estimated traits for measured BFT and CWT, was used in the simple linear regression model. The accuracy of the estimated regression model was represented by R2 and residual standard deviation. The scatter plots with four pork grades were added to the simple regression model for measured BFT and CWT traits, which are parameters used for pork grading judgement.
RESULTS
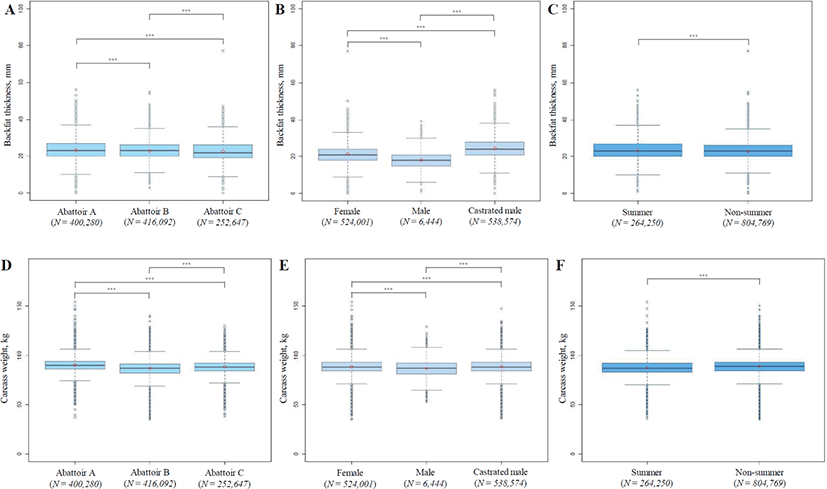
Basic statistical analysis results for the two measured traits (BFT and CWT) and 46 estimated traits are presented in Table 1. The mean, standard deviation, minimum values, and maximum values of the measured and estimated traits were calculated for each abattoir. Analysis of variance demonstrated a significant difference (p < 0.001) in the two measured traits between the three fixed effects (Supplementary Table S1). The quartile range of each fixed effect on the measured trait was visualised in a boxplot (Fig. 1). All three fixed effects showed a significant difference (p < 0.001) in both measured traits. The mean values of measured BFT according to each fixed effect was calculated (abattoir A = 23.282, abattoir B = 22.844, abattoir C = 22.602; female = 21.534, male = 18.238, castrated male = 24.386; summer = 23.342, and non-summer = 22.822). Likewise, the mean values of measured CWT were calculated according to each fixed effect (abattoir A = 90.195, abattoir B = 86.777, abattoir C = 88.419; female = 88.374, male = 86.621, castrated male = 88.536; summer = 87.374, and non-summer = 88.797).

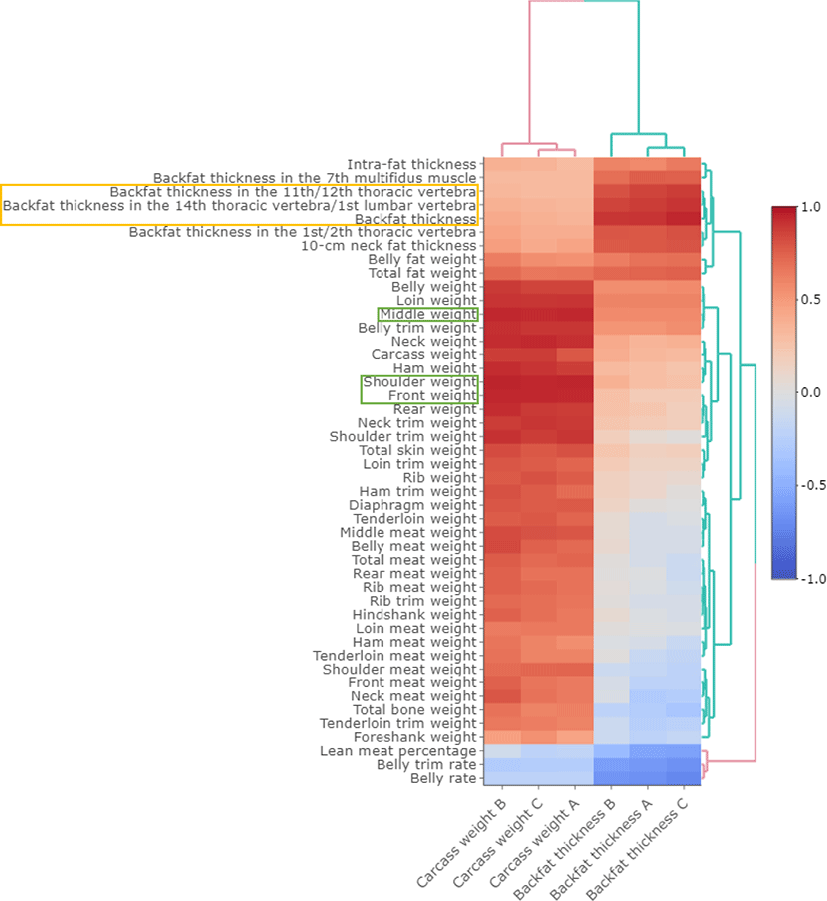
The correlations between the two measured traits (BFT and CWT) and 46 estimated traits were visualised as a heat map (Fig. 2). The results of correlation analysis established a close relationship between the estimated traits and measured BFT trait in all three abattoirs: estimated BFT (abattoir A, R = 0.906; abattoir B, R = 0.900; and abattoir C, R = 0.941), estimated BFT14/1 (abattoir A, R = 0.873; abattoir B, R = 0.855; and abattoir C, R = 0.901), and estimated BFT11/12 (abattoir A, R = 0.852; abattoir B, R = 0.805; and abattoir C, R = 0.878). Moreover, correlation analysis verified a close relationship between the estimated traits and measured CWT trait in all three abattoirs: estimated SWT (abattoir A, R = 0.944; abattoir B, R = 0.949; and abattoir C, R= 0.938), estimated FWT (abattoir A, R = 0.936; abattoir B, R = 0.942; and abattoir C, R = 0.943), and estimated MWT (abattoir A, R = 0.936; abattoir B, R = 0.941; and abattoir C, R = 0.933). The measured traits and estimated traits showed significant correlation in all three abattoirs (p < 0.001), except for correlation between measured BFT trait and estimated diaphragm weight trait at abattoir C (p = 0.737, Supplementary Table S2).

Stepwise regression analysis was performed using measured traits (BFT and CWT) as dependent variables (Supplementary Table S3 and S4). Through partial and model R2 in the entire estimated regression models (R2 = 0.840), the top three estimated traits (BFT, LWT, and TBWT) could sufficiently predict the measured BFT trait. Likewise, it was demonstrated that the top three estimated traits (SWT, LWT, and FWT) could predict measured CWT traits in the overall estimated regression models (R2 = 0.980). The estimated regression models for measured BFT (1) and CWT (2) traits with three fixed effects were as follows (Table 2):
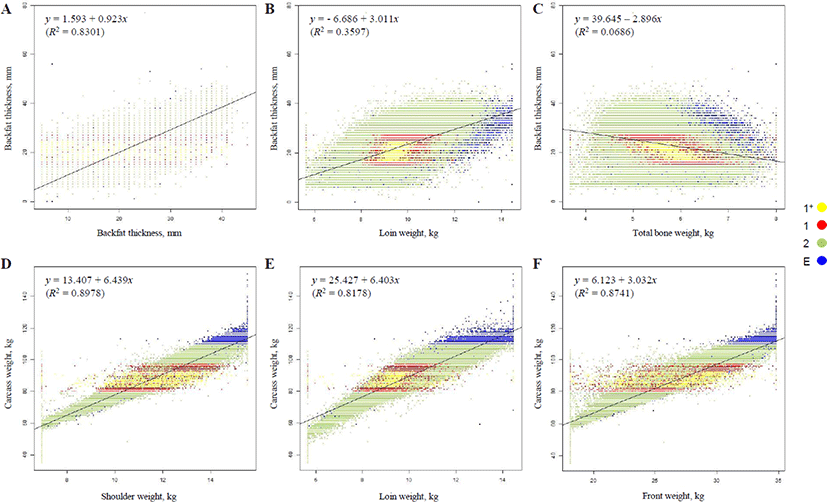
To better elucidate the relationship between the measured and estimated traits, a simple linear regression model describing each of the top three estimated traits was generated and visualised as a dot plot, as shown in Fig. 3. The accuracy of the model for measured BFT trait was determined using simple linear regression analysis (BFT, R2 = 0.8301; LWT, R2 = 0.3597; TBWT, R2 = 0.0686). The model was also evaluated for accuracy in measured CWT trait using simple linear regression analysis (SWT, R2 = 0.8978; LWT, R2 = 0.8178; and FWT, R2 = 0.8741). As shown in Fig. 3, the four pork grades were marked with different colours, and it was confirmed that the higher grades were distributed in the centre.

DISCUSSION
The introduction of an automated-system increase the efficiency of pig slaughter and allow for more objective pork grading rather than conventional manual judgement. In order to increase the efficiency of the pig carcass automated-system, an accurate estimation of the automated-method that can accommodate the existing pig carcass judgement is required. Therefore, the current study verified previously developed calibration equation [14]. The models were based on the relationship between the 46 estimated traits using a non-destructive method and the actual two measured traits (BFT and CWT). We established, using correlation analysis, that measured BFT trait had a high correlation with estimated BFT-related traits (BFT, BFT11/12, and BFT14/1). Actually measured BFT trait was calculated as the average of measured BFT11/12 and BFT14/1 [15], and these two BFT-related traits have been shown as high estimated traits for measured BFT trait. This showed that a model to which a developed calibration equation was applied could high predict the measured BFT trait [14]. Measured CWT trait showed a higher correlation with weight-related estimated traits including SWT, FWT, and MWT traits than CWT trait (Supplementary Table S2). The calibration equation for the application of non-destructive inspection method was calculated using a relatively low number of animals (175 pigs) [14]. It seems that the CWT trait was not sufficiently estimated owing to the small sample size used in the previously developed equation. The measured BFT trait showed a high correlation with BFT-related estimated traits and our findings indicated that estimated traits are sufficiently predict of measured CWT trait, even though estimated traits are non-CWT-related traits.
Stepwise regression analysis was conducted to establish an optimal estimated regression model that could predict measured traits from estimated traits [22]. Unlike in the correlation analysis, fixed effects (abattoir, sex, and season) that may affect measurement during the actual slaughtering process were applied in the regression analysis [23]. It was established that the estimated regression models, which used measured BFT and CWT traits as dependent variables, could be sufficiently explained by 3 out of 46 estimated traits. The accuracy of measured BFT and CWT traits by the estimated regression model was 0.840 (R2) and 0.980 (R2), respectively. Through a simple linear regression model, the accuracy of each estimated trait for the measured traits (BFT and CWT) was confirmed. All of the estimated traits (SWT, LWT, and FWT) for the measured CWT trait showed relatively high accuracy, but in the measured BFT trait, except for the estimated BFT trait, estimated traits (LWT and TBWT) showed low accuracy. In the estimated regression model for measured BFT trait, estimated LWT and TBWT traits had lower partial R2 and did not present a significant difference in accuracy compared to the model with one estimated BFT trait. Whereas, for measured CWT trait, the model accuracy increased when estimated traits were included in the estimated regression model. Among the top three estimated traits used for measured CWT trait, estimated SWT and FWT traits had high R, even in correlation analysis. The estimated LWT trait, which was one of the top three estimated traits, was a common trait between the two measured traits. According to a previous report, loin content showed a close inverse relationship with BFT and lean meat content [24]. This finding on the effect of BFT and meat content on loin content ratio in carcasses showed that estimated LWT trait was closely related to both measured traits.
In order to increase the efficiency of pig slaughter and to obtain objective pig carcasses, an automated pork grading system based on LMP has been applied in some abattoirs. As accurate estimation of an automated-method that can accommodate the existing pig carcass judgement is required, the developed calibration equation that applied to the non-destructive automated inspection method was verified. The accuracy of the developed calibration equation was evaluated based on the relationship between the two measured traits (BFT and CWT) and the 46 estimated trait, and an optimal estimated regression equation for the two measured traits was formulated. Taken together, our findings suggest that estimated BFT-related traits can be used to predict actual BFT trait, and even use estimated traits that are non-CWT-related can sufficiently predict actual CWT trait.
In conclusion, the proposed optimal estimated regression equation is expected to improve the accuracy of pork grading in abattoirs through objective judgment. The developed estimated regression models can be widely implemented in other domestic abattoirs to improve pig carcass grading judgement system. We expect that this accurate prediction method using our estimated regression models will be a cornerstone for the Korean pig carcass grading system. Through this, it is possible to reconsider the efficiency in actual abattoirs, and it is expected that can be used as a parameters for more objective grading judgement. Furthermore, additional study is needed to increase the utilization of the other primal cuts.
