RESEARCH ARTICLE

Dietary effects of sophorolipids on nutrient bioavailability and intestinal microenvironments in broiler chickens

Min-Jin Kwak1,#https://orcid.org/0000-0001-9832-3251, Min Young Park2,#https://orcid.org/0000-0003-1438-9515, Ki-Peum Sung3https://orcid.org/0000-0002-5390-8309, Hanbae Lee3https://orcid.org/0000-0003-4082-9297, Kwang-Youn Whang4,*https://orcid.org/0000-0002-0414-7611, Younghoon Kim1,*https://orcid.org/0000-0001-6769-0657
Author Information & Copyright
1Department of Agricultural Biotechnology and Research Institute of Agriculture and Life Science, Seoul National University, Seoul 08826, Korea
2Department of Basic Science and Craniofacial Biology, New York University College of Dentistry, New York 10012, USA
3Pathway Intermediates, Seoul 06253, Korea
4Division of Biotechnology, College of Life Science and Biotechnology, Korea University, Seoul 02841, Korea

#These authors contributed equally to this work.

*Corresponding author: Kwang-Youn Whang, Division of Biotechnology, College of Life Science and Biotechnology, Korea University, Seoul 02841, Korea. Tel: +82-2-3290-3492, E-mail: kwhang@korea.ac.kr
*Corresponding author: Younghoon Kim, Department of Agricultural Biotechnology and Research Institute of Agriculture and Life Science, Seoul National University, Seoul 08826, Korea. Tel: +82-2-880-4808, E-mail: ykeys2584@snu.ac.kr

© Copyright 2022 Korean Society of Animal Science and Technology. This is an Open-Access article distributed under the terms of the Creative Commons Attribution Non-Commercial License (http://creativecommons.org/licenses/by-nc/4.0/) which permits unrestricted non-commercial use, distribution, and reproduction in any medium, provided the original work is properly cited.

Received: Sep 07, 2022; Revised: Sep 15, 2022; Accepted: Sep 16, 2022

Published Online: Nov 30, 2022

Abstract

Using antibiotics as growth promoter has been banned in poultry feed industry, thus various researchers try to seek an alternative to replace the growth-promoting antibiotics. In this study, we aimed to evaluate the growth performance via intestinal nutrient utilization and cecal microbial composition of broiler after dietary supplementation with most commonly using antibiotics, zinc bacitracin, and sophorolipid. A total of 180 1-day-old chicks were randomly assigned, and dietary treatment was as follow: CON, basal diet; ZB, 100 ppm of zinc bacitracin supplemented diet; and SPL, 250 ppm of sophorolipid supplemented diet. Their growth performance was evaluated and the samples of blood, small intestine, and ileal and cecal digesta were collected for biochemical, histological, and genomic analyses. The body weight and average daily gain of 7-day-old chicks were higher in ZB and those in overall experimental period were improved by ZB and SPL supplementation (p < 0.05). Their intestinal characteristics were not affected by dietary treatments in duodenum and ileum. Nonetheless, villus height was increased by SPL supplementation in jejunum (p < 0.05). Moreover, dietary SPL supplementation could down-regulate the expression level of pro-inflammatory cytokine, IL-1β (p < 0.05). mRNA levels of lipid and protein transporters did not differ among the treatments, however, relative expression levels of carbohydrate transporters, GLUT2 and SGLT1 were increased in broiler chicken’s jejumum fed zinc bacitracin and sophorolipid supplemented diets (p < 0.05). Dietary zinc bacitracin supplementation could increase the population of Firmicutes in phylum level, and the portion of Turiciacter in genus level. On the other hands, the portion of Faecalibacterium was increased by dietary SPL supplementation compared to the other treatments. Our findings suggest that SPL supplementation improves growth performance through enhanced carbohydrate utilization capacity via improvement of gut morphological status and modulation of the cecal microbial population of broilers.

Keywords: Broiler; Growth; Gut microenvironment; Nutrient transporter; Sophorolipid; Zinc bacitracin

INTRODUCTION

Since the 1950s, antibiotic growth promoters (AGP) have been utilized as supplements to improve broiler productivity in terms of growth performance, including body weight (BW) and feed efficiency (FE) [1]. Nevertheless, concerns over residual or antibiotic resistance have resulted in the restriction of AGP usage in broilers and from early 2006, AGP were banned in many countries, including the United States, European Union members, and Korea [24]. Consequently, various alternative feed additives, such as organic acids and phytogenic compounds, were developed to replace antibiotics as growth promoters but none of them have equaled the efficiency of AGP yet [59].

Many studies were conducted to determine how antibiotics enhance broiler growth. Elimination of pathogenic gut microbiota via antibiotic action promotes energy utilization for growth [10]. Antibiotics also modulate gut development by enhancing mucosal immunity, feed digestion, and nutrient absorption [1113]. However, the mechanisms involved in its growth-promoting effects remain unclear. The recent application of next-generation sequencing technique in animal nutrition has accentuated the capability of antibiotics to regulate gut microbiota, leading to an in-depth understanding of the mechanisms of antibiotic action in growth improvement in animals, as correlations were observed between the microbiota and biological phenotype by microbial sequencing. For example, AGP supplementation improved broiler weight gain and increased the ratio of Firmicutes to Bacteroidetes. Hou et al. distinguished the fecal microbiota composition between obese broilers and a divergently lean line [14]. Despite these studies, the link between the capacity of antibiotics to reduce the prevalence of enteric pathogens and the mechanism behind growth improvement remains obscure [2], which is essentially one of the reasons behind the complexity of developing alternatives for AGP.

In this study, we have focused on the novel glycolipid-type biosurfactant, named Sophorolipid (SPL). Recently, SPL has attracted much attention with its lower toxicity and more biodegradability compared to diverse biological detergents in various industrial fields including hygiene, medicine, and pharmacological fields [15]. SPL also could act as an antimicrobial agent, an immune modulator, a depigment agent, a wound healing accelerator, and a skin fibroblast stimulator [1618]. Therefore, we conducted an experiment with SPL and zinc bacitracin to validate the possibility of SPL as a valuable replacement for AGP in livestock industry. ZB has been a commonly used antibiotic and it can improve the growth performance of broilers by alteration of intestinal morphology of broilers [19]. We aimed to investigate the effects of dietary supplementation with SPL on growth performance, intestinal morphology, nutrient utilization, and cecal microbiota of broilers.

MATERIALS AND METHODS

Dietary treatment of the broiler chicks

A total of 180 broiler chicks (1-day-old Ross 308) were obtained from a local hatchery. Their basal diets followed the requirements of the National Research Council and involved a three-phase (starter, grower, and finisher) feeding program for 35 days (Table 1). The chicks were randomly assigned to 3 treatment groups with 6 replicates (10 chicks/pen). The experimental groups for growth performance evaluation consisted of three dietary treatments: CON, basal diet; ZB, 100 ppm of ZB supplemented basal diet; SPL, 250 ppm of SPL supplemented basal diet. From days 35 to 38, Cr2O3 was added to their diets for subsequent collection of excreta. The chicks were fed and provided with water ad libitum and raised under the following environmental conditions: gradually decreasing temperature from 32°C to 24°C, average room humidity of 60% to 65%, and 20 h of light and 4 h dark, as instructed in the Ross 308 manual. The methods pertaining to the use of animals in this study were approved by the Institutional Animal Care and Use Committee (IACUC, KU-2020-0083) of Korea University.

Table 1. Composition of experimental diets for broiler starter (d 1 to 7), grower (d 8 to 21), and finisher (d 22 to 35) phases
Item Starter Grower Finisher
Ingredient (% [as-is basis])
 Corn 52.45 55.82 58.60
 Soybean meal (dehulled) 39.15 35.55 32.05
 Soy oil 3.59 4.36 5.33
 L-Lysine sulfate (55%) 0.31 0.21 0.21
 DL-methionine (98%) 0.38
 L-Methionine (99%) 0.32 0.31
 Threonine (98%) 0.10 0.07 0.06
 Choline Cl (50%) 0.07 0.07 0.08
 MonoCa-P 1.75
 Dicalcium phosphate 1.68 1.60
 Limestone 1.54 1.25 1.10
 Salt 0.30 0.25 0.25
 NaHCO3 0.10 0.19 0.19
 Vitamin mixture1) 0.14 0.14 0.12
 Mineral mixture2) 0.11 0.11 0.11
 Total 100.00 100.00 100.00
Nutrient contents
 Crude protein (%) 23.00 21.50 20.00
 AMEn (kcal/kg) 3,000.00 3,100.00 3,200.00
 Ca (%) 0.96 0.87 0.81
 P (%) 0.78 0.70 0.64
 Lysine (%) 1.44 1.29 1.19
 Methionine (%) 0.56 0.51 0.48
 Cysteine (%) 0.37 0.35 0.33
 Threonine (%) 0.97 0.88 0.81

1) Provided per kilogram of complete diet: vitamin A, 6,300 IU; vitamin D, 2,800 IU; vitamin E, 35 mg; vitamin K3, 1.75 mg; vitamin B1, 2 mg; vitamin B2, 6 mg; vitamin B6, 3 mg; vitamin B12, 13 μg; biotin, 0.1 mg; calcium pantothenic acid, 15 mg; folic acid, 1.5 mg; niacin, 50 mg.

2) Provided per kilogram of complete diet: Mn, 100 mg; Cu, 17 mg; Zn, 92 mg; Fe, 50 mg; I, 1.5 mg; Co, 0.15 mg; Se, 0.3 mg.

AMEn, nitrogen-corrected apparent metabolizable energy.

Download Excel Table
Growth performance evaluation and sample collection

The BW and feed intake were measured weekly for 35 days, and thereafter, 2 chicks from each pen were sacrificed with CO2 gas to collect the blood and small intestine. The weight and length of small intestine from each chick were measured. The duodenum, jejunum, and ileum samples were collected and fixed in 4% formaldehyde for histological analysis. Jejunal tissues were also collected for gene expression analysis and stored at −20°C until further analysis. On day 38, excreta of 2 chicks were collected and pooled per pen and the cecal contents were immediately frozen in dry ice until further analysis.

Serum analysis

Serum from the blood sample was obtained by centrifugation at 12,000×g at 4°C for 15 minutes. Serum glucose, blood urea nitrogen (BUN), triglycerides (TG), and total cholesterol levels were measured using an analytical kit by spectrometric method (Embiel, Gunpo, Korea).

Apparent ileal energy digestibility

After storage, the ileal digesta were thawed, dried at 105°C overnight, and ground prior to the energy digestibility test, which was conducted using a bomb calorimeter. The apparent total tract nutrient digestibility (AD) and apparent metabolizable energy (AME) were calculated using the equations described by Fenton and Fenton as follows [20]:

AD ( % ) = 100 100 × [ ( Cr 2 O 3 in diet × Nutrient in feces ) / ( Cr 2 O 3 in feces × Nutrient in diet ) ] AME ( kcal/kg ) = Gross energy ( GE ) diet [ GE feces × ( Cr 2 O 3 in diet / Cr 2 O 3 in feces ) ]
Histological analysis of small intestine

The fixed jejunum samples were processed for paraffin embedding, sectioning, and hematoxylin and eosin staining for intestinal morphology analysis. Images were obtained using microscope camera (ToupTek, Hangzhou, Zhejiang, China). Villus height and crypt depth were analyzed at 10 × magnification per slide using ImageJ v1.49 (NIH, Bethesda, MD, USA) [21].

RNA extraction and gene expression analysis

Frozen jejunal tissue samples were homogenized in TRIzol reagent (Invitrogen, Waltham, MA, USA) and the total RNA from each sample was obtained according to the manufacturer’s protocol. Subsequently, cDNA was synthesized by reverse transcription using a high-capacity cDNA synthesis kit (Applied Biosystems, Waltham, MA, USA). The relative mRNA levels of each gene was determined using StepOnePlus (Applied Biosystems) and normalized to β-actin using 2−ΔΔCt method [22]. The primer sequences used in this study are listed in Table 2.

Table 2. Oligonucleotide primers used in qRT-PCR analysis
Gene name Sequence (forward, reverse) Reference
Housekeeping gene
 GAPDH F: 5’- CTACACACGGACACTTCAAG -3’ NM_204305
R: 5’- GACTACGGGGGTACAAACA -3’
Carbohydrate transporters
 GLUT2 F: 5’ - AAAGAGAGTGTCCATCGGGC -3’ NM_207178
R: 5’ - GGAAGACGGAGATAACCGTGA -3’
 SGLT2 F: 5’ - TGCTGCGGACATCTCTGTTA -3’ NM_001293240
R: 5’ - TCAGAGCATTCCATTCATACCCTC -3’
Lipid transporters
 FABP1 F: 5’- ACTGGCTCCAAAGAATGACCAATG -3’ NM_204192
R: 5’- TGTCTCCGTTGAGTTCGGTCAC -3’
 CD36 F: 5’- GCGATTTGGTTAATGGCACT -3’ NM_001030731
R: 5’- TCTCCAACATCAATCGGTGA -3’
 DGAT2 F: 5’- AAAAGGGGATGCTGCCTATCT -3’ FJ868804
R: 5’- GCTTACGCAGCTCCATCTTCT -3’
 FATP4 F: 5’- AGGGATTTGTGAAACTGGCACT -3’ XM_419374.4
R: 5’- CTTTGGGATGGTGATGGGTT -3’
Protein transporters
 PepT1 F: 5’- TTTGACCAGCAGGGATCGAG -3’ NM_204365
R: 5’- CCAGCAAGGAACATGCCAAC -3’
 CAT1 F: 5’- CAAGAGGAAAACTCCAGTAATTGCA -3’ XM_417116
R: 5’- AAGTCGAAGAGGAAGGCCATAA -3’
 rBAT F: 5’- CTTCGCAACAGTGAGCTACCCATA -3’ XM_426125
R: 5’- TAAAGACGCTGTCTAACCCATCCAA -3’
 y+LAT1 F: 5’- AGGGTGTGTGGAGATGTCAG -3’ XM_418326
R: 5’- GAAGCTGTGTGTGAACGACG -3’
Tight junction proteins
 ZO-1 F: 5’- GTCTCCCTACTCTGGGGGAA -3’ XM_413773
R: 5’- GAACAGCAAATGCGTGCTCA -3’
 CLDN1 F: 5’- AGATCCAGTGCAAGGTGTACG -3’ NM_001013611.2
R: 5’- GCTGACAGACCTGCAATGATGA -3’
 OCLD F: 5’- ATGAGACCGACTACACCACG -3’ NM_205128.1
R: 5’- CCACATCCTGGTATTGAGGGC -3’
Inflammatory cytokines
 IL-1β F: 5’- TGCCTGCAGAAGAAGCCTCG -3’ NM_204524
R: 5’- GGAAGGTGACGGGCTCAAAA -3’
 TGF-β F: 5’- ATCCTCAGCAAACTGCGTCT -3’ NM_001318456.1
R: 5’- GCTCTTTGGCCCAATACTCA -3’
 IFN-γ F: 5’- AGCTCCCGATCAACGAC -3’ NM_205149.1
R: 5’- CAGGAGGTCATAAGATGCCA -3’

qRT-PC, quantitative real-time polymerase chain reaction; GAPDH, glyceraldehyde-3-phosphate dehydrogenase; GLUT2, glucose transporter 2; SGLT2, sodium-glucose transporter 2; FABP1, fatty-acid binding protein 1; CD36, cluster of differentiation 36; DGAT2, diacylglycerol o-acyltransferase; FATP4, fatty-acid transport protein 4; PepT1, peptide transporter 1; CAT1, cationic amino acid transporter; rBAT, neutral and basic amino acid transport protein; y+LAT1, y + L amino acid transporter 1; ZO-1, zona occludens-1; CLDN1, claudin 1; OCLD, occludin; IL-1β, interleukin-1β; TGF-β, transforming growth factor β; IFN-γ, interferon-γ.

Download Excel Table
DNA extraction and 16S rRNA amplicon metagenomic analysis

Microbial DNA was extracted from the cecal samples using QIAamp DNA Stool Mini Kit (QIAGEN, Hilden, Germany) following the manufacturer’s instructions. The DNA samples were used as templates for polymerase chain reaction (PCR) amplification by targeting the V3–V4 hypervariable regions of the bacterial 16S rRNA gene using the primers 341F (5′-TCGTCGGCAGCGTCAGATGTGTATAAGAGACAG-CCTACGGGNGGCWGCAG-3′) and 805R (5′-GTCTCGTGGGCTCGG-AGATGTGTATAAGAGACAGGACTACHVGGGTATCTAATCC-3′). Secondary amplification was performed by attaching the barcodes with i5 forward primer (5′-AATGATACGGCGACCACCGAGATCTACAC-XXXXXXXXTCGTCGGCAGCGTC-3′) and i7 reverse primer (5′-CAAGCAGAAG ACGGCATACGAGAT-XXXXXXXX-GTCTCGTGGGCTCGG-3′), with X referring to the barcode region. The PCR conditions were as follows: denaturation at 95°C for 30 s, annealing at 55°C for 30 s, polymerization at 72°C for 30 s with 25 cycles for primary PCR, and 8 cycles for secondary PCR. The PCR amplicons were purified using CleanPCR (CleanNA, Waddinxveen, Netherlands) and the quality and size of the products were assessed using 2100 Bioanalyzer (Agilent, Palo Alto, CA, USA). Equal amounts of amplicons from each sample were pooled and subjected to Illumina MiSeq sequencing (Illumina, San Diego, CA, USA) at ChunLab (Seoul, Korea).

Microbial community analysis

The raw sequence data were analyzed using mothur v.1.38 [23]. The barcoded fusion primers and low-quality reads with read lengths below 300 bp were eliminated. Subsequently, the sequencing reads were compared using basic local alignment search tool (BLASTN) as a reference to remove chimeric sequences. Microorganisms were taxonomically identified using EzBioCloud database at the species level with a 97% similarity cutoff (ChunLab).

Statistical Analysis

All values are presented as mean ± SE and were derived from triplicate experiments. Quantitative data were subjected to one-way ANOVA. Multiple comparisons were performed using Tukey’s honestly significant difference (HSD) test and the results were considered statistically significant at p < 0.05. Analyses were performed using the SAS 9.4 software (SAS Institute, Cary, NC, USA). The Wilcoxon rank-sum test was used to analyze the differences in alpha diversity indices and the taxonomy of microbial populations.

RESULTS

Growth performance and serum analysis

The BW of the chicks improved in ZB and SPL treatments on day 14, and both final BW (day 35) were significantly heavier compared to the CON group. Moreover, average daily gain (ADG) throughout the experimental period (days 1 to 35) also significantly increased in both ZB and SPL groups (Table 3). The final BW improved in ZB (16.54%), and SPL (14.59%) compared to that in the control (p < 0.05). Although their average daily feed intake (ADFI) did not differ among the treatments, their ADG significantly increased in ZB and SPL in every growth period except in the control (p < 0.05). This resulted in greater FE in ZB and SPL compared to that in the control during the overall period (day 0–35).

Table 3. Growth performance of broiler chickens fed experimental diets for 35 days1)
Treatment CON2) ZB SPL SEM p-value
Body weight (g)
 Day 1 45.52 45.46 45.48 0.083 0.962
 Day 7 134.18b 151.82a 133.46b 2.778 0.001
 Day 21 582.00b 732.00a 702.19a 22.657 0.005
 Day 35 2,001.73b 2,332.80a 2,293.79a 50.831 0.004
Average daily gain (g/day)
 Day 1–7 12.67b 15.19a 12.57b 0.395 0.001
 Day 8–21 31.99b 41.44a 40.62a 1.519 0.007
 Day 22–35 101.41b 114.34a 113.69a 2.127 0.007
 Day 1–35 55.89b 65.35a 64.24a 1.452 0.004
Average daily feed intake (g/day)
 Day 1–7 34.65 35.42 34.63 0.245 0.348
 Day 8–21 85.00 84.86 91.06 4.240 0.816
 Day 22–35 139.20 143.16 148.02 2.735 0.451
 Day 1–35 96.61 98.29 102.56 2.414 0.619
Feed efficiency
 Day 1–7 0.366b 0.429a 0.363b 0.010 0.003
 Day 8–21 0.380 0.507 0.453 0.022 0.056
 Day 22–35 0.730 0.802 0.770 0.014 0.110
 Day 1–35 0.580b 0.670a 0.629a 0.015 0.042

1) Mean values represent 6 replicates per treatment; pen is the experimental unit.10 chicks in 1 pen.

2) CON, basal diet; ZB, 100 ppm of zinc bacitracin supplemented group; SPL, 250 ppm of sophorolipid supplemented group.

a,b Different superscripts within the same row significantly differ (p < 0.05).

Download Excel Table

The levels of serum glucose, BUN, TG, and total cholesterol marginally differed among the treatments. However, TG levels in ZB and SPL treatment groups were significantly increased compared to that of CON group (Table 4). The concentrations of BUN, total cholesterol and glucose were not affected by dietary AGP and SPL supplementation in 35-day-old broilers.

Table 4. Blood biochemical analysis of the broiler chickens fed experimental diets for 35 days1)
Treatment CON ZB SPL SEM p-value
Glucose (mg/dL) 222.87 249.26 284.09 12.405 0.136
Blood urea nitrogen (mg/dL) 2.56 2.63 2.42 0.097 0.683
Triglyceride (mg/dL) 10.56b 25.65a 27.34a 2.855 0.016
Total cholesterol (mg/dL) 92.67 83.64 89.50 4.905 0.640

1) Mean values represent 6 replicates per treatment; a chicken is the experimental unit.

2) CON, basal diet; ZB, 100 ppm of zinc bacitracin supplemented group; SPL, 250 ppm of sophorolipid supplemented group.

a,b Different superscripts within the same row significantly differ (p < 0.05).

Download Excel Table
Apparent total tract energy digestibility and characteristics of small intestine

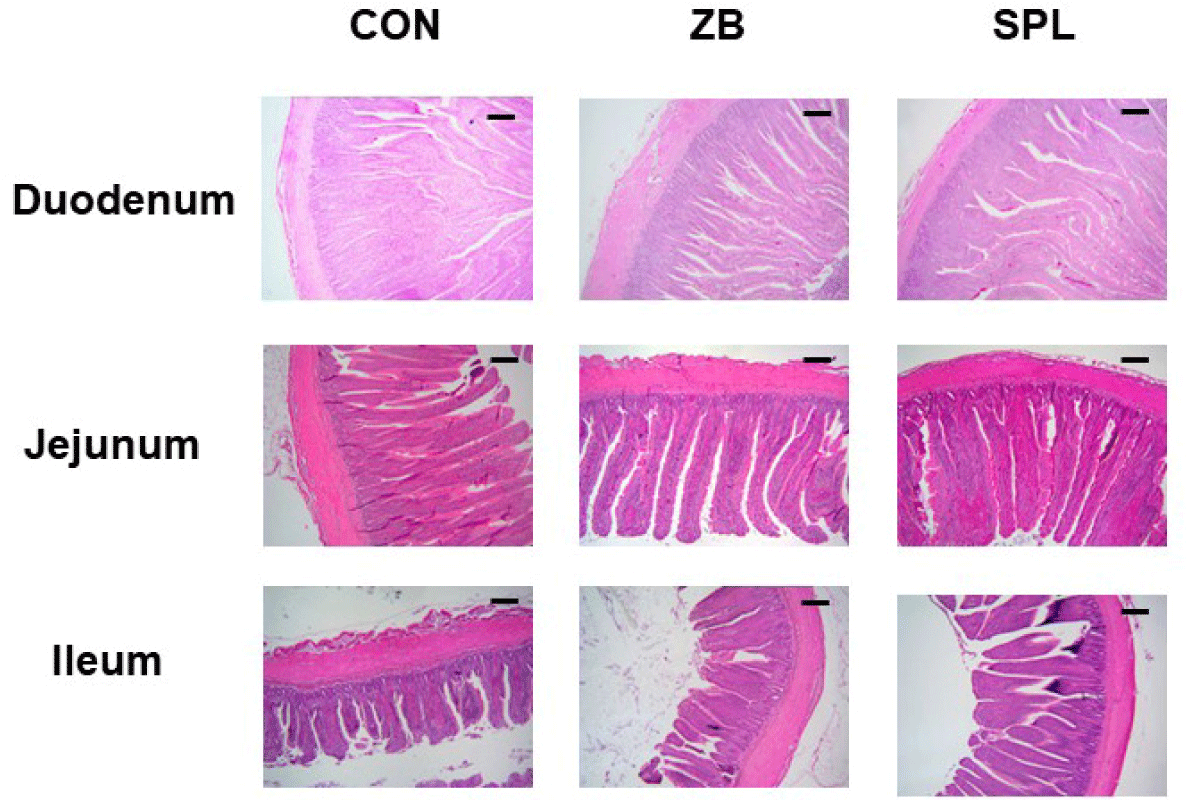
The AD levels in the chicks did not vary considerably among the treatments (Table 5). The length and weight of each section of the small intestine were measured by histological staining (Table 6). Representative images of jejunum are shown in Fig. 1. The ratio of small intestine weight to BW did not considerably differ among the treatments, however, the intestinal weight per length was significantly lighter compared to the other treatments. Moreover, villus height, crypt depth, and villus height to crypt depth (V:C) ratio in the duodenum and ileum did not substantially differ among the treatments, however, villus height in the jejunum was significantly higher in the SPL treatment group compared to the other treatments. Relative gene expression levels of various nutrient transporters in the jejunum, namely glucose and amino acid transporters and fatty acid binding proteins are summarized in Table 7. The relative transcript levels of nutrient transporters in the jejunum were not differed among the treatments, nevertheless, expression levels of glucose transporters including GLUT2 and SGLT1 were significantly increased in ZB and SPL supplemented diet groups. mRNA expression levels of tight junction proteins were not different among treatments, however, the relative expression level of il-1β was significantly decreased by dietary SPL supplementation in broiler chickens (Table 8).

jast-64-6-1092-g1
Fig. 1. Representative images of jejunum after H&E staining from broiler chickens. CON, basal diet; ZB, 100 ppm of zinc bacitracin supplemented diet; SPL, 250 ppm of sophorolipid supplemented diet, bar = 250 μm.
Download Original Figure
Table 5. Energy digestibility of the broiler chickens fed experimental diets for 35 days1)
Treatment CON2) ZB SPL SEM p-value
Energy digestibility (%) 79.55 78.45 84.54 1.766 0.640

1) Mean values represent 6 replicates per treatment; a chicken is the experimental unit.

2) CON, basal diet; ZB, 100 ppm of zinc bacitracin supplemented group; SPL, 250 ppm of sophorolipid supplemented group.

Download Excel Table
Table 6. Characteristics and morphological indexes of small intestine from the broiler chickens fed experimental diets for 35 days1)
Treatment CON2) ZB SPL SEM p-value
BW (kg) 2.16 2.50 2.26 0.070 0.119
Length (cm) 166.00 167.17 163.67 4.234 0.949
Weight (g) 52.25 53.78 56.91 2.356 0.737
Relative weight (g/kg BW) 25.03 20.44 24.44 0.837 0.037
Weight/ length (g/cm) 0.33 0.30 0.36 0.008 0.018
Duodenum
 Villus height (μm) 1,101.75 1,168.07 1,262.17 31.747 0.207
 Crypt depth (μm) 156.42 167.11 187.71 5.983 0.152
 Villus height/crypt depth 7.04 7.01 6.77 0.142 0.743
Jejunum
 Villus height (μm) 933.60b 910.32b 1,127.69a 31.543 0.001
 Crypt depth (μm) 86.90 90.61 102.22 2.870 0.063
 Villus height/crypt depth 10.84 10.09 11.05 0.235 0.223
Ileum
 Villus height (μm) 372.65 402.39 440.68 21.399 0.471
 Crypt depth (μm) 56.39 62.95 60.78 1.593 0.248
 Villus height/crypt depth 6.58 6.45 7.21 0.304 0.601

1) Mean values represent 6 replicates per treatment; a chicken is the experimental unit.

2) CON, basal diet; ZB, 100 ppm of zinc bacitracin supplemented group; SPL, 250 ppm of sophorolipid supplemented group.

a,b Different superscripts within the same row significantly differ (p < 0.05).

BW, body weight.

Download Excel Table
Table 7. Relative gene expression levels of nutrient transporters in jejunum of broiler chickens fed experimental diets for 35 days1)
Treatment CON2) ZB SPL SEM p-value
Carbohydrate transporter, fold change
GLUT2 1.00b 3.37a 3.53a 0.438 0.020
SGLT1 1.00b 2.15a 1.98a 0.189 0.017
Lipid transporter, fold change
FABP1 1.00 0.81 1.11 0.071 0.231
CD36 1.00 2.49 3.13 0.487 0.269
DGAT2 1.00 1.08 1.01 0.066 0.884
FATP4 1.11 1.69 2.05 0.198 0.156
Protein transporter, fold change
PepT1 1.00 0.62 1.10 0.112 0.201
CAT1 1.00 1.00 0.98 0.054 0.989
rBAT 1.00 0.97 0.96 0.042 0.931
Y+LAT1 1.00 2.15 1.59 0.258 0.221

1) Mean values represent 6 replicates per treatment; a chicken is the experimental unit.

2) CON, basal diet; ZB, 100 ppm of zinc bacitracin supplemented group; SPL, 250 ppm of sophorolipid supplemented group.

a,b Different superscripts within the same row significantly differ (p < 0.05).

GLUT2, glucose transporter 2; SGLT2, sodium-glucose transporter 2; FABP1, fatty-acid binding protein 1; CD36, cluster of differentiation 36; DGAT2, diacylglycerol o-acyltransferase 2; FATP4, fatty-acid transport protein 4; PepT1, peptide transporter 1; CAT1, cationic amino acid transporter; rBAT, neutral and basic amino acid transport protein; y+LAT1, y + L amino acid transporter 1.

Download Excel Table
Table 8. Relative gene expression levels of tight junction proteins and inflammatory cytokines in jejunum of broiler chickens fed experimental diets for 35 days1)
Treatment CON ZB SPL SEM p-value
Tight junction proteins, fold change
ZO-1 1.00 1.70 1.46 0.198 0.483
OCLD 1.00 0.93 0.96 0.054 0.889
CLDN1 1.00 0.59 0.54 0.094 0.079
Inflammatory cytokine, fold change
IL-1β 1.00a 0.66ab 0.42b 0.096 0.033
TGF-β 1.00 0.70 0.99 0.072 0.130
IFN-γ 1.00 1.19 0.75 0.102 0.174

1) Mean values represent 6 replicates per treatment; a chicken is the experimental unit.

2) CON, basal diet; ZB, 100 ppm of zinc bacitracin supplemented group; SPL, 250 ppm of sophorolipid supplemented group.

a,b Different superscripts within the same row significantly differ (p < 0.05).

ZO-1, zona occludens-1; OCLD, occludin; CLDN1, claudin-1; IL-1β, interleukin-1β; TGF-β, transforming growth factor-β; IFN-γ, interferon-γ.

Download Excel Table
Cecal microbiota community analysis

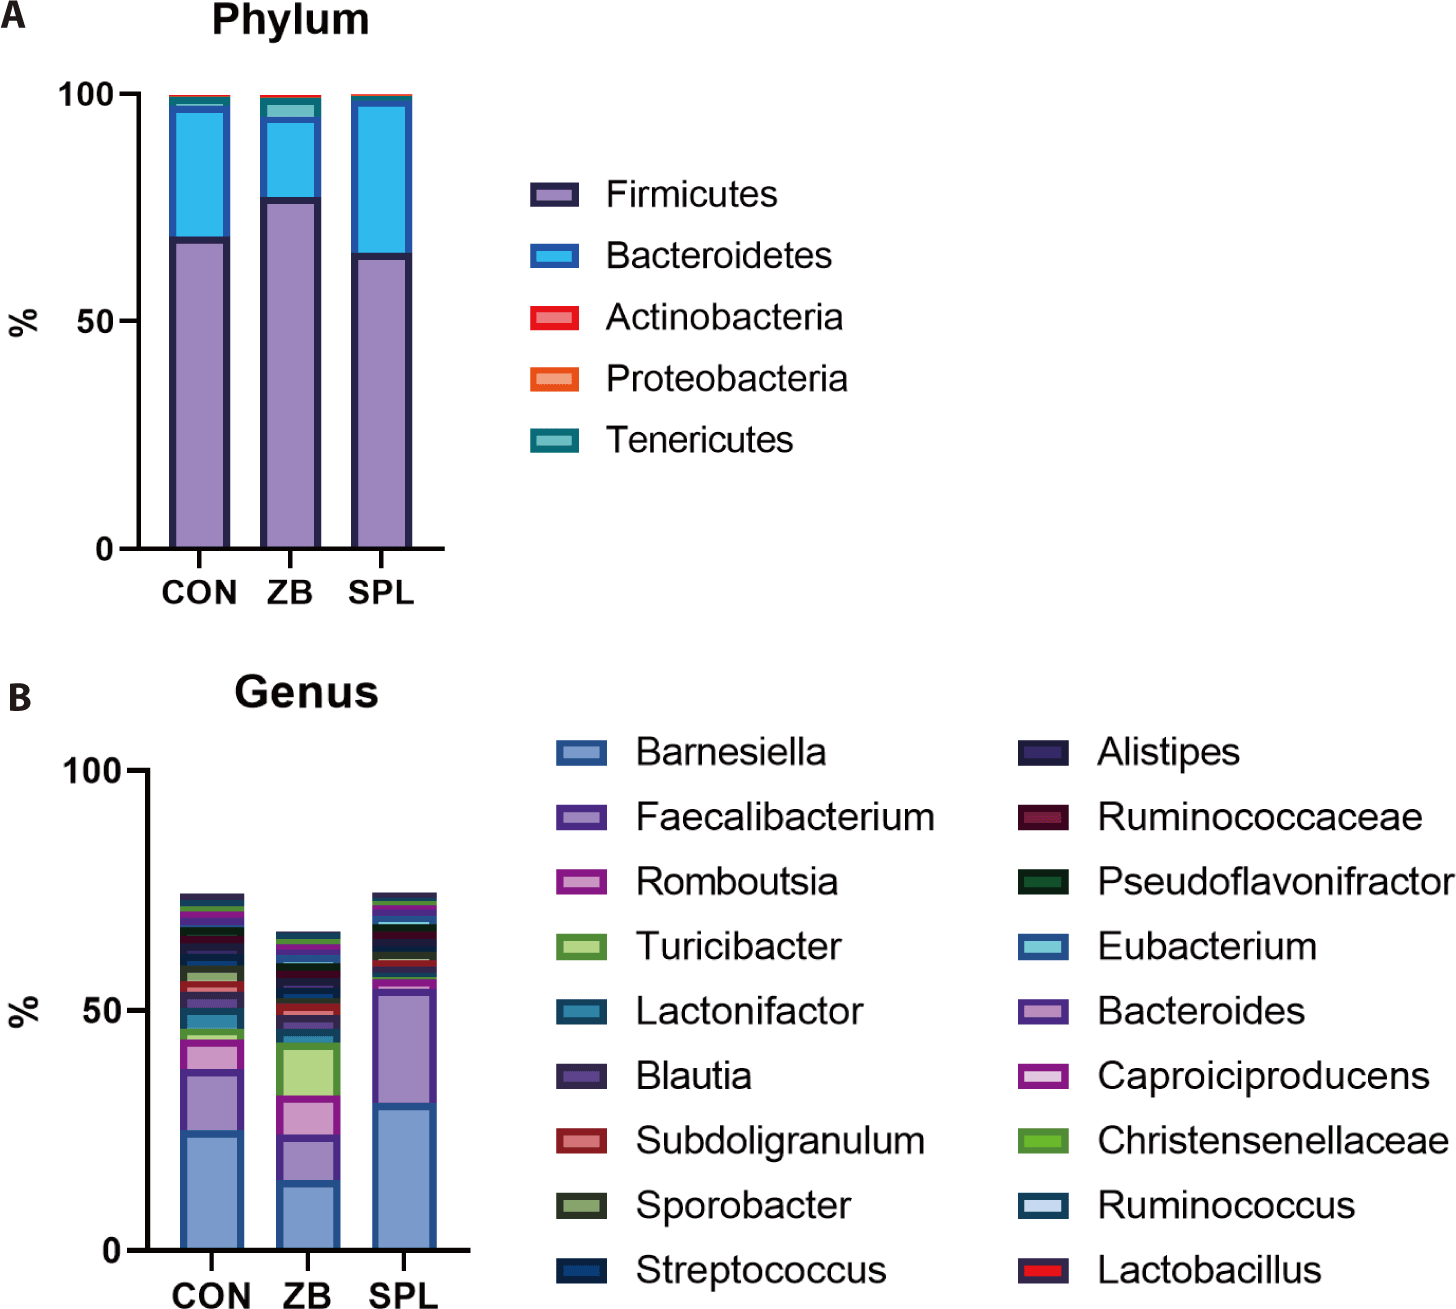
At the phylum level, all the bacterial sequences were classified into 5 phyla; the ceca were dominated by Firmicutes (70.3%) and Bacteroidetes (26.7%). The population of Firmicutes increased by ZB supplementation, whereas that of Bacteroidetes concomitantly decreased. Consistent with the results of taxonomic composition analysis, the ratio of Firmicutes to Bacteroidetes increased in the ZB-supplemented groups relative to that in the control group. We further analyzed the cecal microbial taxonomy at the genus level (Fig. 2B). Of the 712 genera, the bacterial sequences were classified into 18 genera. The dominant genera in the ceca of the chicks were Barnesiella (23.47%) and Faecalibacterium (15.38%), which belong to Bacteroidetes and Firmicutes, respectively. The proportion of Barnesiella, Faecalibacterium, and JN713889 were increased by dietary SPL supplementation, and the population of Romboutsia, Blautia, Lactonifactor, and Turicibacter was decreased. On the contrary, dietary ZB addition decreased the portion of Barnesiella, Faecalibacterium, and Lactonifactor, but increased those of ZN713389, Turicibacter compared to the CON group.

jast-64-6-1092-g2
Fig. 2. Cecal microbiota composition in the broiler chickens fed experimental diets supplemented with 100 ppm of zinc bacitracin and 250 ppm of sophorolipid. (ZB) at 0 (CON), 50 (ZB 50), 100 (ZB 100), or 200 (ZB 200) ppm for 35 days. (A) phylum level and (B) genus level. The values represent the mean values of 6 replicates per treatment. One chicken is the experimental unit.
Download Original Figure

DISCUSSION

This study demonstrated that SPL and ZB supplementation possibly promotes growth and alters the cecal microbiota towards the dominance of Firmicutes relative to Bacteroidetes with upregulated jejunal glucose utilization and upregulated intestinal inflammation. Previous studies have reported the growth-promoting effects of SPL and ZB in poultry industrial field [11,15]. They commonly proposed that dietary SPL would be able to modify intestinal microbial population in a proper trend to promote gut microenvironments [15]. Particularly, this study indicated that SPL in broilers feed could increase glucose utilization capacity by upregulation of relative expression levels of carbohydrate transporters, and energy utilization including lipid metabolism in liver.

The results of biochemical analyses indicated that dietary supplementation with ZB and SPL did not affect the serum glucose, BUN, and total cholesterol levels in broilers. These data correspond to the findings of Manafi et al. and Attia et al., conversely, the concentration level of TG was increased by dietary addition of SPL in this study [19,24]. We assumed that dietary SPL could increase the carbohydrate uptake in jejunum by increment of expression level of transporters, including GLUT2 and SGLT, and it might lead to boosted lipid biosynthesis in liver metabolism.

We also evaluated whether the improved growth performance by SPL supplementation could be attributed to nutrient utilization and found that SPL supplementation showed increasing tendency in energy digestibility and significantly raised jejunal villus height of the chicks. On the other hands, it remains to be clarified whether antibiotics alter intestinal structure and function. In a study by Manafi et al., energy digestibility improved, and villus height was elevated with 50 ppm of bacitracin methylene disalicylate (BMD) supplementation, but their study differed from ours in terms of experimental duration; they examined the broilers 42 days after supplementation [19]. Nonetheless, our results are consistent with the findings of Miles et al., and Ao et al., as the villus height in their BMD-supplemented treatments did not differ from those of the control groups at 5 weeks [25,26]. Considering the variation in the forms of bacitracin in BMD and ZB, Daghighian et al. compared their corresponding effects on the growth performance of turkeys and found that BMD supplementation at 55 ppm increased BW in female turkeys, relative to those supplemented with the same amount of ZB at 4 weeks [27].

Previous studies have investigated the effects of AGP and SPL on cecal microbiota. We observed that ZB supplementation increased the population of Firmicutes, as opposed to Bacteroidetes, which is consistent with the findings of Gong et al. [11]. Furthermore, there was a remarkable shift in the population of Barnesiella at the genus level with a decline in Bacteroidetes. The functional role of Barnesiella is yet to be described in detail, but Wang et al. reported a negative correlation between the abundance of Barnesiella and the high-fat diet-induced metabolic syndrome phenotype, which is highly associated with increased BW. Some species of Barnesiella were found to produce acetate, suggesting that they suppress body fat accumulation [28,29]. Despite the indirect relationship, our results corroborate the potential of Barnesiella to attenuate weight gain in broilers.

Our findings indicate that a possible mechanism of SPL and ZB supplementation linked to increased nutrient absorption for growth improvement in broilers. Turnbaugh et al. reported that enhanced energy harvest and nutrient utilization via the modulation of cecal bacteria may be associated with the abundance of Firmicutes, which are consistent with our findings [30]. Numerical increment in the AD levels of SPL-supplemented chicks could be attributed to our experimental period, which was relatively sufficient for microbial populations to modify energy digestibility.

ZB and SPL has proven to be effective against gram-positive bacteria [15,31]. In contrast, we found that the population of Barnesiella, a gram-negative bacterium, dramatically decreased as ZB supplementation increased. Given that Barnesiella is the largest population of Bacteroidetes at the genus level in the chicken cecal content, ZB supplementation in our study may have largely affected Barnesiella among other populations [32]. A similar occurrence was observed in the study by Kim et al., in which tylosin, another antibiotic, decreased the gram-negative bacteria population despite the distinct ability of the antibiotic to target gram-positive bacteria. Further studies are needed to elucidate the role of Barnesiella in broiler energy utilization and nutrient metabolism [33].

Overall, the results of our study indicate that optimal dosage of ZB and SPL supplementation promote growth performance and modulate cecal microbial composition. Moreover, SPL supplementation may increase the glucose utilization capacity by upregulation of relative expression level of carbohydrate transporter and gut morphological index and lowering inflammation in jejunum.

Competing interests

No potential conflict of interest relevant to this article was reported.

Funding sources

Not applicable.

Acknowledgements

This research was supported by Korea University Grant and Pathway Intermediates Inc., and by High Value-Added Food Technology Development Program of the Korean Institute of Planning and Evaluation for Technology in Food, Agriculture, Forestry, and Fisheries (IPET), the Ministry for Food, Agriculture, Forestry, and Fisheries of the Korea (321037-05-2-HD040) and by the support of "Cooperative Research Program for Agriculture Science and Technology Development (Project No. PJ015865)" Rural Development Administration, Korea.

Availability of data and material

Upon reasonable request, the datasets of this study can be available from the corresponding author.

Authors’ contributions

Conceptualization: Kwak MJ, Park MY, Whang KY.

Data curation: Kwak MJ, Park MY.

Formal analysis: Kwak MJ, Sung KP.

Methodology: Lee H, Whang KY, Kim Y.

Software: Kwak MJ.

Validation: Whang KY, Kim Y.

Investigation: Park MY, Sung KP, Lee H.

Writing – original draft: Kwak MJ, Park MY, Whang KY, Kim Y.

Writing – review & editing: Kwak MJ, Park MY, Sung KP, Lee H, Whang KY, Kim Y.

Ethics approval and consent to participate

The project underwent proper ethical standards and the experiments were approved by the Institutional Animal Care and Use Committee of Korea University, Seoul, Korea (KU-2020-0083).

REFERENCES

1.

Graham JP, Boland JJ, Silbergeld E. Growth promoting antibiotics in food animal production: an economic analysis. Public Health Rep. 2007; 122:79-87

2.

Dibner JJ, Richards JD. Antibiotic growth promoters in agriculture: history and mode of action. Poult Sci. 2005; 84:634-43

3.

Wegener HC. Antibiotics in animal feed and their role in resistance development. Curr Opin Microbiol. 2003; 6:439-45

4.

Lin J. Antibiotic growth promoters enhance animal production by targeting intestinal bile salt hydrolase and its producers. Front Microbiol. 2014; 5:33

5.

Huyghebaert G, Ducatelle R, Van Immerseel F. An update on alternatives to antimicrobial growth promoters for broilers. Vet J. 2011; 187:182-8

6.

Kwak MJ, Tan PL, Oh JK, Chae KS, Kim J, Kim SH, et al. The effects of multispecies probiotic formulations on growth performance, hepatic metabolism, intestinal integrity and fecal microbiota in growing-finishing pigs. Anim Feed Sci Technol. 2021; 274:114833

7.

Kang J, Lee JJ, Cho JH, Choe J, Kyoung H, Kim SH, et al. Effects of dietary inactivated probiotics on growth performance and immune responses of weaned pigs. J Anim Sci Technol. 2021; 63:520-30

8.

Oh JK, Vasquez R, Kim SH, Hwang IC, Song JH, Park JH, et al. Multispecies probiotics alter fecal short-chain fatty acids and lactate levels in weaned pigs by modulating gut microbiota. J Anim Sci Technol. 2021; 63:1142-58

9.

Mun D, Kyoung H, Kong M, Ryu S, Jang KB, Baek J, et al. Effects of Bacillus-based probiotics on growth performance, nutrient digestibility, and intestinal health of weaned pigs. J Anim Sci Technol. 2021; 63:1314-27

10.

Anderson DB, McCracken VJ, Aminovi RI, Simpson JM, Mackie RI, Verstegen MWA, et al. Gut microbiology and growth-promoting antibiotics in swine. Pig News Inf. 1999; 20:115-22

11.

Gong J, Yu H, Liu T, Gill JJ, Chambers JR, Wheatcroft R, et al. Effects of zinc bacitracin, bird age and access to range on bacterial microbiota in the ileum and caeca of broiler chickens. J Appl Microbiol. 2008; 104:1372-82

12.

Stanley D, Geier MS, Hughes RJ, Denman SE, Moore RJ. Highly variable microbiota development in the chicken gastrointestinal tract. PLOS ONE. 2013; 8e84290

13.

Stanley D, Hughes RJ, Moore RJ. Microbiota of the chicken gastrointestinal tract: influence on health, productivity and disease. Appl Microbiol Biotechnol. 2014; 98:4301-10

14.

Hou Q, Kwok LY, Zheng Y, Wang L, Guo Z, Zhang J, et al. Differential fecal microbiota are retained in broiler chicken lines divergently selected for fatness traits. Sci Rep. 2016; 6:37376

15.

Kwak MJ, Park MY, Choi YS, Cho J, Pathiraja D, Kim J, et al. Dietary sophorolipid accelerates growth by modulation of gut microbiota population and intestinal environments in broiler chickens. J Anim Sci Biotechnol. 2021; 12:81

16.

Kwak MJ, Choi SW, Choi YS, Lee H, Park MY, Whang KY. Effects of sophorolipid on growth performance, organ characteristics, lipid digestion markers, and gut functionality and integrity in broiler chickens. Animals. 2022; 12:635

17.

Kwak MJ, Choi SW, Choi YS, Lee H, Whang KY. Sophorolipid protects against early-weaning syndrome by improving the gut microenvironment in early-weaned piglets. BMC Vet Res. 2022; 18:8

18.

Kwak MJ, Ha DJ, Choi YS, Lee H, Whang KY. Protective and restorative effects of sophorolipid on intestinal dystrophy in dextran sulfate sodium-induced colitis mouse model. Food Funct. 2022; 13:161-9

19.

Manafi M, Khalaji S, Hedayati M, Pirany N. Efficacy of Bacillus subtilis and bacitracin methylene disalicylate on growth performance, digestibility, blood metabolites, immunity, and intestinal microbiota after intramuscular inoculation with Escherichia coli in broilers. Poult Sci. 2017; 96:1174-83

20.

Fenton TW, Fenton M. An improved procedure for the determination of chromic oxide in feed and feces. Can J Anim Sci. 1979; 59:631-4

21.

Schneider CA, Rasband WS, Eliceiri KW. NIH Image to ImageJ: 25 years of image analysis. Nat Methods. 2012; 9:671-5

22.

Livak KJ, Schmittgen TD. Analysis of relative gene expression data using real-time quantitative PCR and the 2−ΔΔCT method. Methods. 2001; 25:402-8

23.

Schloss PD, Westcott SL, Ryabin T, Hall JR, Hartmann M, Hollister EB, et al. Introducing mothur: open-source, platform-independent, community-supported software for describing and comparing microbial communities. Appl Environ Microbiol. 2009; 75:7537-41

24.

Attia YA, Hamed RS, Abd El-Hamid AE, Al-Harthi MA, Shahba HA, Bovera F. Performance, blood profile, carcass and meat traits and tissue morphology in growing rabbits fed mannanoligosaccharides and zinc-bacitracin continuously or intermittently. Anim Sci Pap Rep. 2015; 33:85-101

25.

Miles RD, Butcher GD, Henry PR, Littell RC. Effect of antibiotic growth promoters on broiler performance, intestinal growth parameters, and quantitative morphology. Poult Sci. 2006; 85:476-85

26.

Ao Z, Choct M. Oligosaccharides affect performance and gut development of broiler chickens. Asian-Australas J Anim Sci. 2013; 26:116-21

27.

Daghighian P, Waibel PE. The efficacy of bacitracin methylene disalicylate and zinc bacitracin in turkey nutrition. Poult Sci. 1982; 61:962-76

28.

Wang J, Tang H, Zhang C, Zhao Y, Derrien M, Rocher E, et al. Modulation of gut microbiota during probiotic-mediated attenuation of metabolic syndrome in high fat diet-fed mice. ISME J. 2015; 9:1-15

29.

Sakamoto M, Lan PTN, Benno Y. Barnesiella viscericola gen. nov., sp. nov., a novel member of the family Porphyromonadaceae isolated from chicken caecum. Int J Syst Evol Microbiol. 2007; 57:342-6

30.

Turnbaugh PJ, Ley RE, Mahowald MA, Magrini V, Mardis ER, Gordon JI. An obesity-associated gut microbiome with increased capacity for energy harvest. Nature. 2006; 444:1027-31

31.

Butaye P, Devriese LA, Haesebrouck F. Antimicrobial growth promoters used in animal feed: effects of less well known antibiotics on gram-positive bacteria. Clin Microbiol Rev. 2003; 16:175-88

32.

Wei S, Lilburn M, Yu Z. The bacteriomes of ileal mucosa and cecal content of broiler chickens and turkeys as revealed by metagenomic analysis. Int J Microbiol. 2016; 2016:4320412

33.

Kim BR, Shin J, Guevarra RB, Lee JH, Kim DW, Seol KH, et al. Deciphering diversity indices for a better understanding of microbial communities. J Microbiol Biotechnol. 2017; 27:2089-93