INTRODUCTION
As the global expansion of the swine industry continues, heat stress (HS) driven by climate change has emerged as a critical challenge [1]. Compared to other livestock species, pigs are particularly vulnerable to elevated ambient temperatures due to their insufficiently developed sweat glands and substantial subcutaneous adipose tissue, both of which significantly limit effective thermoregulation [2]. Physiologically, HS induces peripheral vasodilation, reduces blood flow to the visceral organs, and compromises intestinal health [3]. The resulting intestinal hypoxia subsequently weakens the gut barrier integrity and facilitates pathogen translocation and systemic inflammation [4]. Additionally, HS negatively affects swine productivity and profitability, thereby causing reduced feed intake, impaired growth performance, and decreased reproductive efficiency, particularly during the finishing pig stage of the high growth phase [5,6].
Despite extensive studies investigating the HS responses in swine, comprehensive research utilizing multiomics integration (MOI) approaches to elucidate the underlying biological mechanisms remains limited [7]. HS simultaneously influences diverse physiological pathways, including immune, metabolic, and intestinal homeostasis pathways, through intricate host-microbiome interactions, leading to systemic pathological outcomes [8,9]. Previous single-omics studies have further provided limited insights into these relationships. Typically, transcriptomic analyses offer only an incomplete understanding of gene regulatory mechanisms without adequately addressing microbiome interactions [10]. Conversely, microbiome-centric studies have independently elucidated shifts in microbial composition associated with gut barrier function, immunity, and metabolism, but have failed to clarify the direct molecular implications on systemic physiological responses [11]. Therefore, an MOI approach is essential to bridge these fragmented insights by correlating microbial community shifts with host gene expression, thereby enabling the simultaneous investigation of systemic and intestinal responses to HS [12,13]. To ensure analytical robustness, it is essential to collect biospecimen-derived data that accurately represents distinct biological layers of the host [14]. Accordingly, fecal and whole blood samples were used to noninvasively and longitudinally evaluate host physiological responses to HS, highlighting their utility for the real-time assessment of intestinal and systemic alterations.
Conventional bulk blood transcriptomics have a critical limitation: HS remodels immune cell populations, and bulk profiles may conflate compositional shifts with intrinsic gene regulatory changes. To address this issue, we applied cell-type deconvolution, which disentangles population dynamics from transcriptional regulation, and refines the resolution of immune acclimation under HS [15]. Collectively, this study employed an MOI framework combining microbiome, transcriptome, and immune cell data to comprehensively characterize the systemic and intestinal responses of finishing pigs to HS. We hypothesized that integrating these multilayered data would reveal condition-specific host–microbiome–immune system interaction axes, thereby uncovering the mechanistic pathways underlying acclimations or malacclimations to HS. This integrative approach aims to not only advance the understanding of swine thermal stress biology but also to provide a conceptual basis for precise strategies to enhance resilience in the swine industry.
MATERIALS AND METHODS
All experimental protocols were approved by the Institutional Animal Care and Use Committee (Approval No. 202012A-CNU-204) of Chungnam National University, Daejeon, South Korea. All animal handling and sampling procedures were conducted in accordance with animal use guidelines and regulations.
The temperature and humidity index (THI) was calculated using the formula suggested by the NRC [16]:
where Tdb is the dry-bulb temperature and RH is the relative humidity.
This experiment followed a two-factor factorial design consisting of two envrionment treatments (thermoneutral, TN; and HS) and three time points (Weeks 0, 1, and 2). Twenty-four crossbred finishing pigs ([Landrace x Yorkshire] × Duroc; initial body weight, BW = 51.14 ± 5.79 kg; 12 TN and 12 HS) were assigned to two environmental treatments in a randomized complete block design (block = BW) during 14 days. Both fecal microbiome and whole-blood transcriptome data were generated from all individuals at each time point. Environmental treatments were as follows: ① THI 68 (comfort); 23°C–24°C, 35% and ② THI 87 (severe); 32°C–33°C, 80%, and were designed based on previous reports [17]. Pigs were fed a basal diet (corn-soy diet; 3,350 kcal/kg ME; 18.55% CP; 1.23% lysine; 0.38% methionine) formulated to meet or exceed the nutrient requirements of growing pigs (NRC, 2012; table 2.1) [18]. Pigs were provided ad libitum access to feed and water throughout the experimental period. Each pen size was 2.32 × 1.75 × 0.7 m. The pen floor was slatted with 100% plastic.
Body weights were recorded at the start and end of the 14-day experimental period. Average daily gain (ADG), average daily feed intake (ADFI), and gain-to-feed ratio (G:F) were subsequently calculated. Statistical analyses were conducted using independent sample t-tests with the SAS 9.4 statistical software package (SAS Institute). Data are presented as the mean ± SEM, with significance thresholds set at p < 0.05 and p < 0.01.
Genomic DNA was extracted from fecal samples to amplify the V3–V4 hypervariable regions of the bacterial 16S rRNA gene following the Illumina 16S Metagenomic Sequencing Library Preparation protocol. Each reaction contained 2ng of template DNA, 5×reaction buffer, 1mM dNTPs, 500 nM of each universal primer, and Herculase II Fusion DNA Polymerase (Agilent Technologies). The PCR cycling conditions consisted of an initial denaturation at 95°C for 3 min, followed by 25 cycles of denaturation at 95°C for 30 s, annealing at 55°C for 30 s, and extension at 72°C for 30 s, with a final extension step at 72°C for 5 min. The forward primer sequence was: 5′-GTCGGCAGCGTCAGATGTGTATAAGAGACAGCCTACGGGNGGCWGC AG-3′, and the reverse primer sequence was 5′-GTCTCGTGGGCTCGGAGATGTGTATAAGA GACAGGACTACHVGGGTATCTAATCC-3′. PCR products were purified using AMPure XP beads (Beckman Coulter). A secondary PCR of 10 cycles was subsequently conducted to attach the Nextera XT index sequences and Illumina sequencing adapters, followed by a second purification step using AMPure XP beads. The concentrations of the indexed libraries were quantified using the KAPA Library Quantification Kit (KAPA Biosystems), while the fragment size distribution was verified using the Agilent TapeStation D1000 system. Paired-end sequencing (2 × 300 bp) was performed using the Illumina MiSeq platform (Illumina) at Macrogen.
Raw paired-end reads were processed using the QIIME2 platform v2024.2 to characterize the fecal microbial community [19]. After demultiplexing and initial quality filtering, sequences were denoised using the DADA2 algorithm to correct amplicon errors and generate high-resolution amplicon sequence variants (ASVs) [20]. Taxonomic classification of these ASVs was conducted using a Naïve Bayes classifier trained on the SILVA v138_99 database specific to the V3–V4 region of the 16S rRNA gene [21]. The alpha diversity within each sample was assessed using the observed ASV counts and Shannon diversity indices, whereas beta diversity between samples was evaluated based on the Bray-Curtis dissimilarity and visualized using nonmetric multidimensional scaling (NMDS). Statistical comparisons of beta diversity among groups were performed using permutational multivariate analysis of variance (PERMANOVA). This taxonomic framework allowed for the profiling of microbial communities from the phylum to the genus level across treatment groups and sampling times.
The functional potential of the fecal microbiota was inferred using phylogenetic investigation of communities through reconstruction of unobserved state 2 (PICRUSt2) [22]. The ASV tables were normalized to the 16S rRNA gene copy numbers prior to functional inference. The predicted enzyme commission (EC) numbers and Kyoto Encyclopedia of Genes and Genomes (KEGG) orthologs were assigned based on the PICRUSt2 reference database. These functional annotations were subsequently mapped to the KEGG pathways to facilitate the interpretation of metabolic capabilities. Statistical comparisons between the experimental groups were conducted using Welch’s t-test within the statistical analysis of taxonomic and functional Profiles (STAMP) software [23], with a significance level of p < 0.05. Extended error bar plots generated by STAMP were applied to visualize the significantly different pathways, providing a comparative overview of the predicted metabolic functions under distinct environmental conditions.
Total RNA was isolated from whole blood samples using TRIzol reagent (Invitrogen, Life Technologies), following the manufacturer’s protocol, to ensure RNA integrity and minimize degradation. The concentration and purity of each RNA sample were assessed using a NanoDrop ND-1000 spectrophotometer (NanoDrop Technologies). For RNA-seq library construction, 1 µg of total RNA was processed using the Illumina TruSeq RNA Sample Preparation Kit. In brief, mRNA was fragmented and reverse-transcribed into first-strand complementary DNA (cDNA) using reverse transcriptase and random primers. Second-strand synthesis was performed using DNA polymerase I and ribonuclease H to obtain double-stranded cDNA. End-repair and adapter ligation were conducted to complete the library construction. The resulting libraries were sequenced on an Illumina HiSeq 2000 platform (Illumina) to generate 2 × 100 bp paired-end reads, thereby enabling comprehensive transcriptome profiling for downstream analysis.
Raw RNA-seq reads were initially assessed for quality using FastQC v0.11.9, to identify potential sequencing artifacts and base-calling errors [24]. Low-quality bases and residual adapter sequences were removed with Trimmomatic v0.38 using a sliding window approach (SLIDING WINDOW:4:15) with a minimum read length threshold of 80 bp [25]. The trimmed reads were subsequently re-evaluated using FastQC v0.11.9 to confirm the quality improvement. High-quality reads were aligned to the Sus scrofa reference genome (Sscrofa11.1, Ensembl release 111) using HISAT2 v2.1.0, with default alignment parameters [26]. Gene annotation was performed based on the corresponding Ensembl GPF file. The resulting SAM files were converted to the BAM format, sorted, and indexed using Samtools v1.9 [27]. Gene-level read counts were generated using the FeatureCounts tool in the Subread package v1.6.3, by employing the corresponding Ensembl GTF annotation file [28]. Raw counts were normalized using the trimmed mean of M-values (TMM) method implemented in the edgeR package in Bioconductor v3.16 to account for differences in library size [29]. Multidimensional scaling (MDS) plots were generated using the Limma package to visualize sample relationships, while graphical outputs were produced using ggplot2 [30]. Differentially expressed genes (DEGs) were identified by comparing the TN and HS groups at each time point (Weeks 0, 1, and 2), with significance defined as a false discovery rate (FDR) < 0.05 and an absolute log₂ fold change ≥ 1, applying the Benjamini-Hochberg correction for multiple testing.
Functional enrichment analysis was conducted to investigate the biological roles of the identified DEGs. Gene ontology (GO) enrichment, focusing on the biological process category, was conducted using DAVID v2021, with a minimum gene count of two and an EASE score threshold of p < 0.05 [31]. Redundant GO terms were summarized and visualized as tree maps using the reduced visualization gene ontology (REVIGO) [32]. KEGG pathway analysis was conducted to identify overrepresented molecular pathways, and the results were presented as –Log₁₀ p-values and fold enrichment values. To further interpret the relationships among functional categories, selected DEGs were integrated into network analyses using the Cytoscape v3.10.0, ClueGO v2.5.10, and CluePedia v1.5.10 plugins [33–35]. Network construction employed a p-value cut-off of < 0.05, and the ClueGO parameters were set as follows: GO term minimum level = 3, maximum level = 8, minimum number of genes = 3, and minimum gene percentage = 4%. This approach enabled the identification of key regulatory modules and functional clusters associated with the HS response.
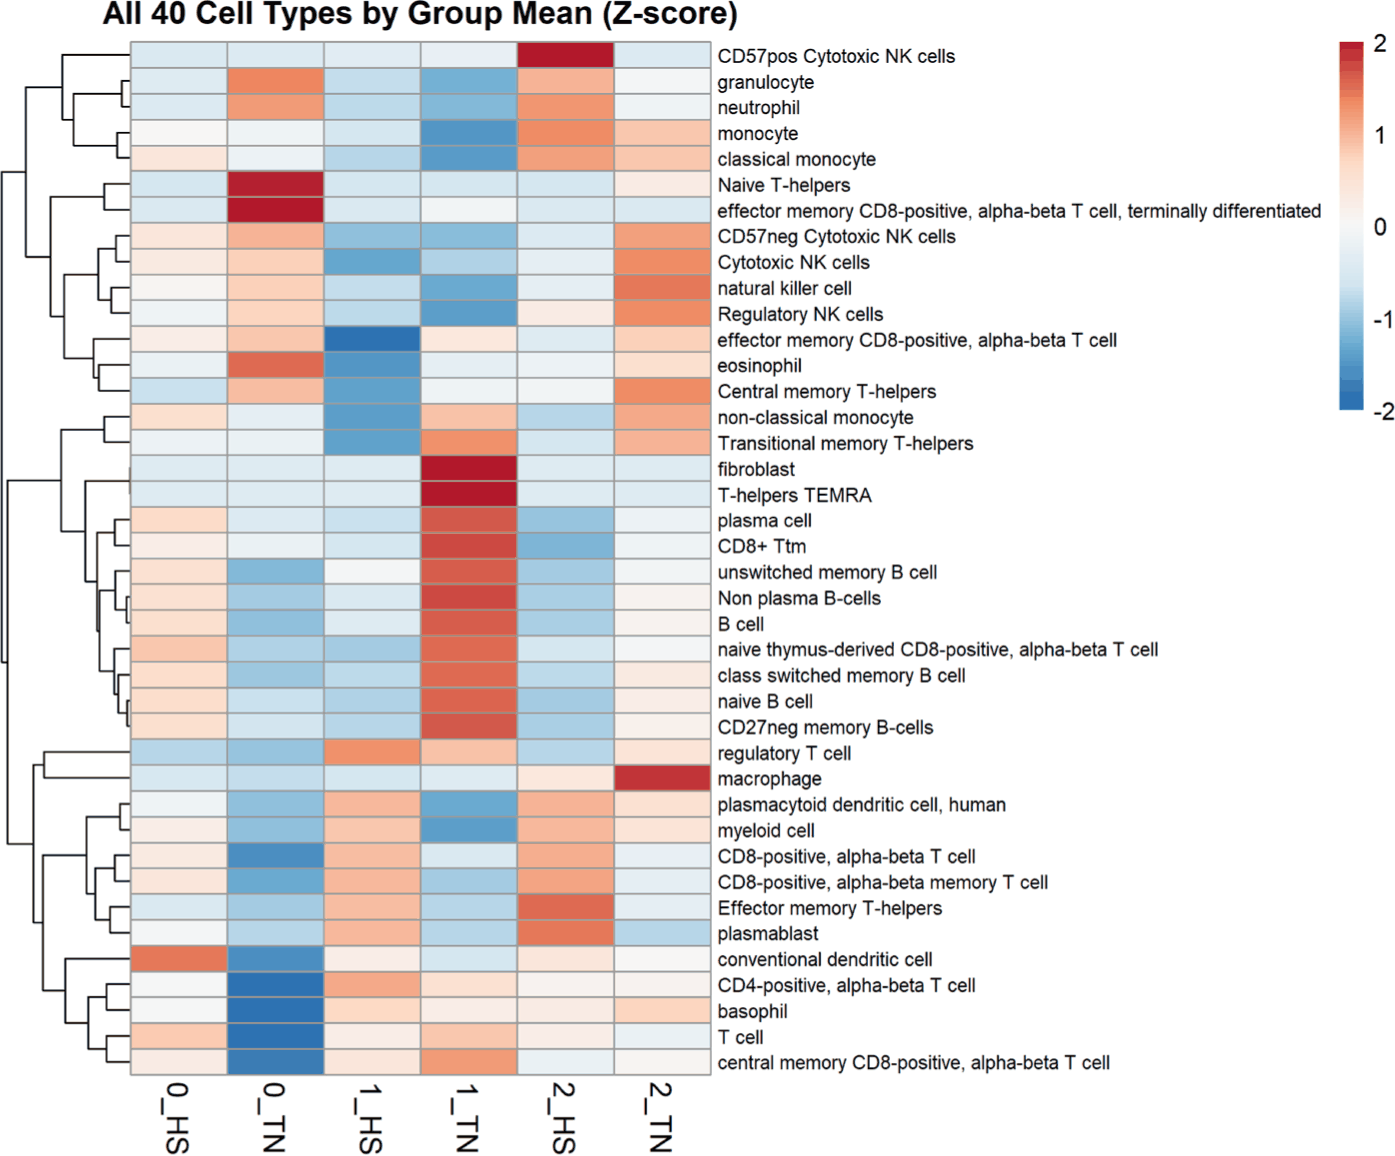
Immune cell composition was estimated from whole blood transcriptomic data using the xCell2 algorithm, which applies cell type-specific gene expression signatures to calculate enrichment scores [36]. The TMM-normalized gene expression matrix generated from the RNA-seq analysis served as the input for cell-type deconvolution. The default immune reference compendium provided by xCell2 was applied to profile 40 predefined immune cell types, including subsets of T cells, B cells, and monocytes. The resulting enrichment scores were subsequently compared between TN and HS groups to identify shifts in the immune landscape. These immune cell profiles were then integrated with the microbiome and transcriptome data for multi-omics analysis to elucidate host-microbiome-immune system interactions under HS conditions.
To investigate the coordinated interactions between the fecal microbiome and host immune responses under HS, MOI was conducted using regularized canonical correlation analysis (rCCA) and Mantel tests. For rCCA, microbial abundance data were log-ratio transformed, and TMM-normalized gene expression matrices representing immune-related features were prepared. Both datasets were standardized to have a zero mean and unit variance prior to the analysis. rCCA was conducted using the CCA function from the PMA package v1.2.1 in R, identifying canonical variates that maximized correlations between microbial and host immune features [37]. Canonical loadings were extracted and ranked to identify the most influential microbial taxa and immune cell types.
Mantel tests were applied to evaluate the correlations between the distance matrices derived from different omics layers. Bray–Curtis dissimilarity was used for microbial profiles, whereas Euclidean distances were calculated for both transcriptomic and cell-type deconvolution data. Significance was determined through permutation testing with 9,999 iterations using the Mantel _test function from the linkET package v0.0.1 in R [38]. This integrated framework enabled the identification of microbiome–immune associations and functional modules characteristic of the HS response.
RESULTS
At the start of the experiment, the initial body weight did not differ significantly between the TN groups (53.37 ± 1.49 kg) and HS groups (50.61 ± 4.01 kg, p > 0.05). However, after exposure, the HS pigs showed markedly lower ADG (0.48 ± 0.03 vs. 0.81 ± 0.04 kg/d) and ADFI (1.17 ± 0.02 vs. 1.89 ± 0.05 kg/d) than TN pigs (p < 0.01). However, no significant differences were found in the G:F (0.41 ± 0.02 vs. 0.43 ± 0.03, p > 0.05) between groups. These results suggest that HS reduced growth performance, primarily through reductions in feed consumption and weight gain, rather than in feed efficiency (Table 1).
Fecal microbiome analyses revealed marked compositional and functional alterations under HS conditions. Alpha diversity metrics, including the observed ASV counts and Shannon index, remained statistically unchanged across treatment groups and time points (weeks 1 and 2), indicating that within-sample diversity was unaffected by HS (Fig. 1A). In contrast, the beta diversity analysis based on Bray–Curtis dissimilarities displayed distinct clustering of microbial communities according to the treatment, with clear group separation in both weeks (Fig. 1B). This pattern indicated that HS primarily influenced the overall microbial structure, rather than species richness.
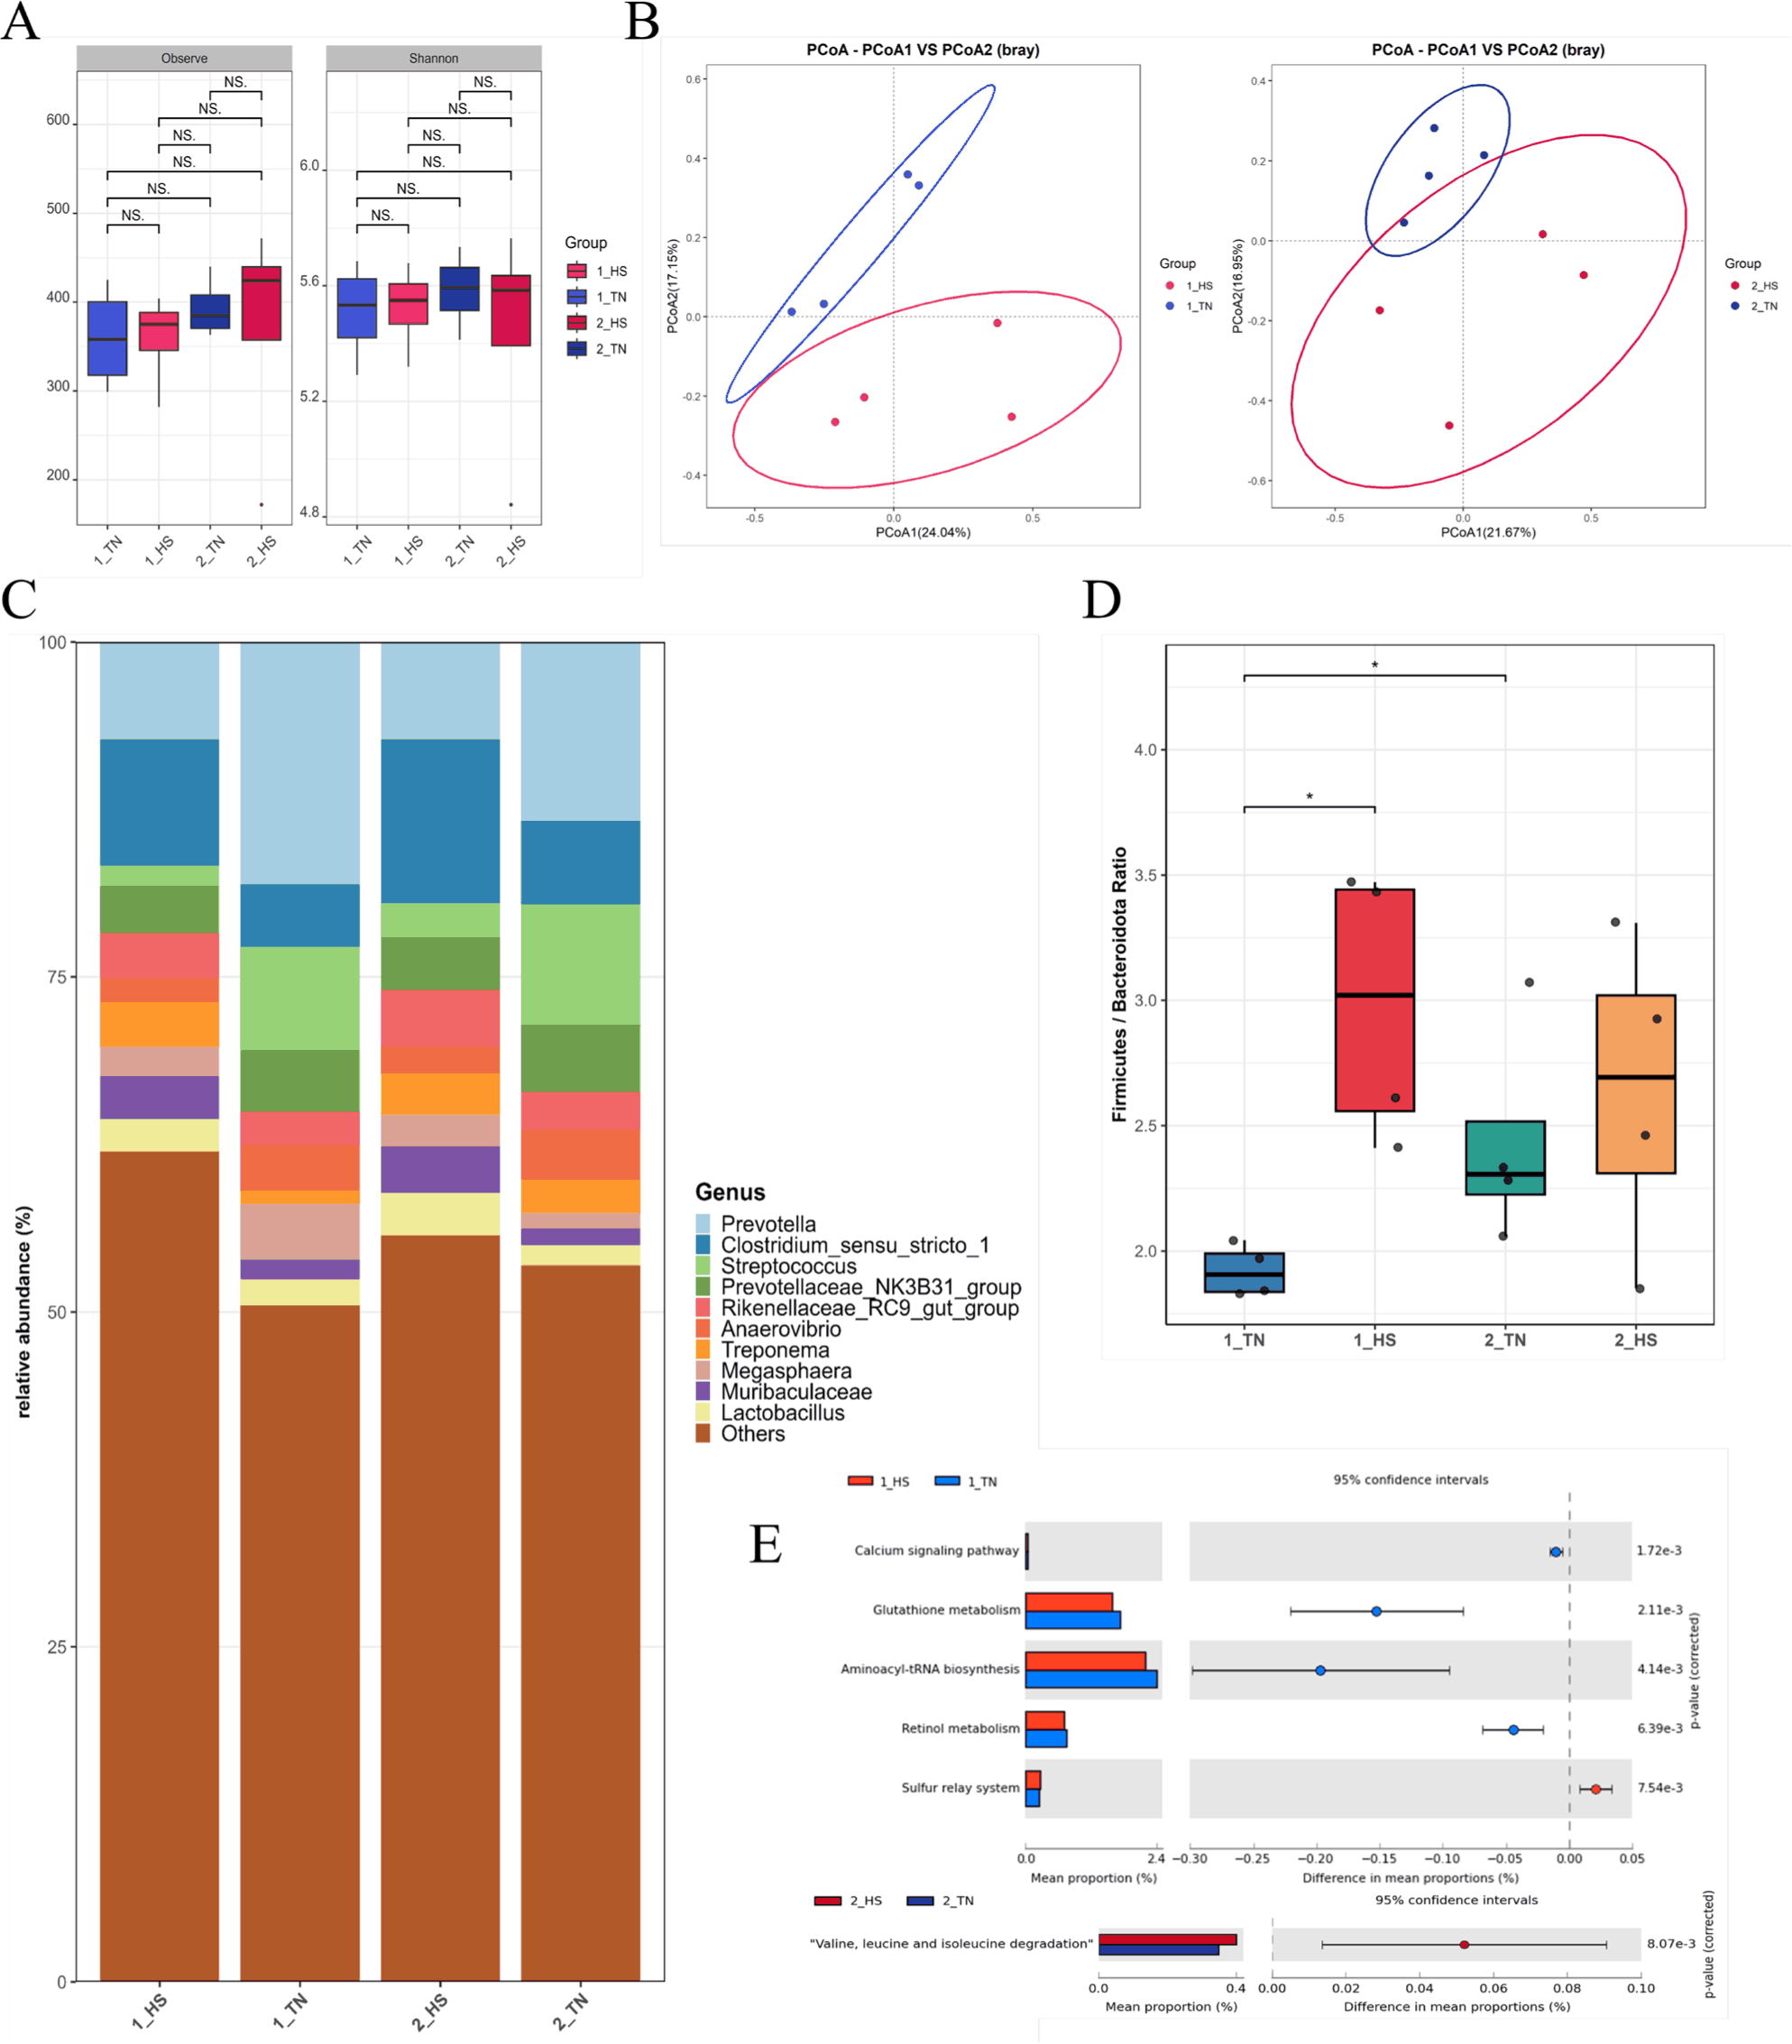
At the genus level, the microbiota composition differed according to treatment. Prevotella and Streptococcus were more abundant in TN pigs, whereas Clostridium sensu stricto 1 was elevated in the HS group (Fig. 1C). The Firmicutes:Bacteroidota (F:B) ratio was significantly higher in the 1_HS group than in the 1_TN (p < 0.05), indicating a transient phylum-level imbalance in response to acute HS. This difference dissipated by week 2, when the F:B ratios returned to comparable levels between groups (Fig. 1D), indicating a potential microbial acclimation [8].
Functionally, PICRUSt2-based metagenomic inference showed divergent metabolic profiles between treatments. At Week 1, TN pigs exhibited enrichment of glutathione metabolism, retinol metabolism, and aminoacyl-tRNA biosynthesis pathways, reflecting a preserved redox balance and protein synthesis capacity under non-stressed conditions [39–41]. Conversely, at week 2, the HS group showed an increased representation of the valine, leucine, and isoleucine degradation pathways, implicating the adaptive catabolism of branched-chain amino acids under prolonged stress (Fig. 1E) [42].
RNA-Seq generated an average of 39.3 million raw reads per sample. After trimming, approximately 38.5 million high-quality reads per sample were retained, with minimal sequence loss (mean trimming rate: 1.9%) and consistent GC content (approximately 44.3%). The read alignment yielded a mean uniquely mapped rate of 85.3% and an overall mapping rate of 96.7%, thus confirming the reliability of the sequencing data for transcriptome analysis (Table 2).
The MDS plots demonstrated clear treatment-driven clustering between TN and HS samples, whereas temporal separation among weeks was relatively subtle (Fig. 2A). At each time point, the TN and HS samples formed distinct clusters, reflecting consistent transcriptional responses to thermal stress (Fig. 2B).
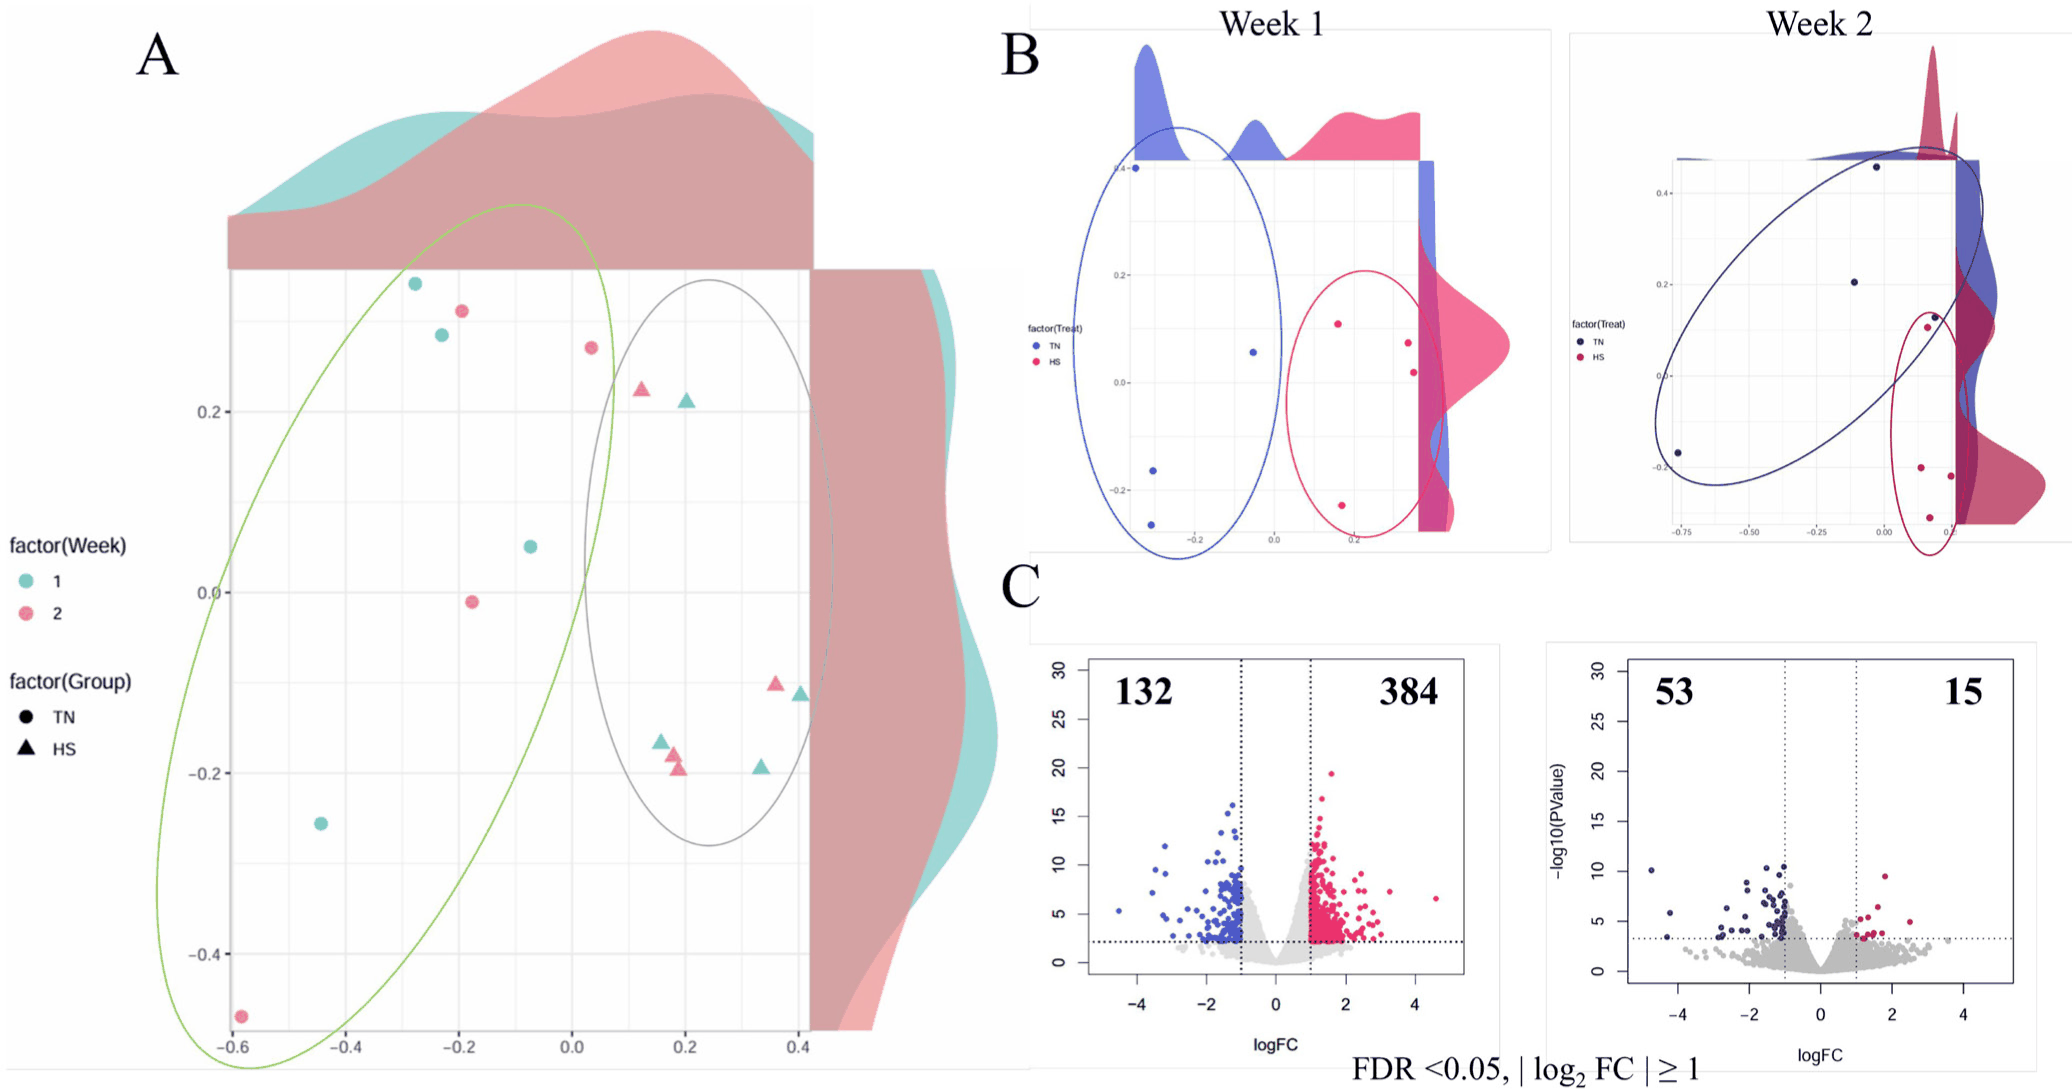
At Week 0, however, no significant differences in gene expression were detected between TN and HS pigs, confirming comparable baseline transcriptional profiles prior to heat exposure (Supplementary Fig. S1). Differential gene expression analysis revealed a robust early phase response. At Week 1, 384 genes were upregulated and 132 were downregulated in HS pigs. By Week 2, the DEG count declined markedly, with only 15 upregulated and 53 downregulated genes (Fig. 2C). This reduction indicates an acute transcriptional response during the initial stress exposure, followed by partial acclimation or resolution.
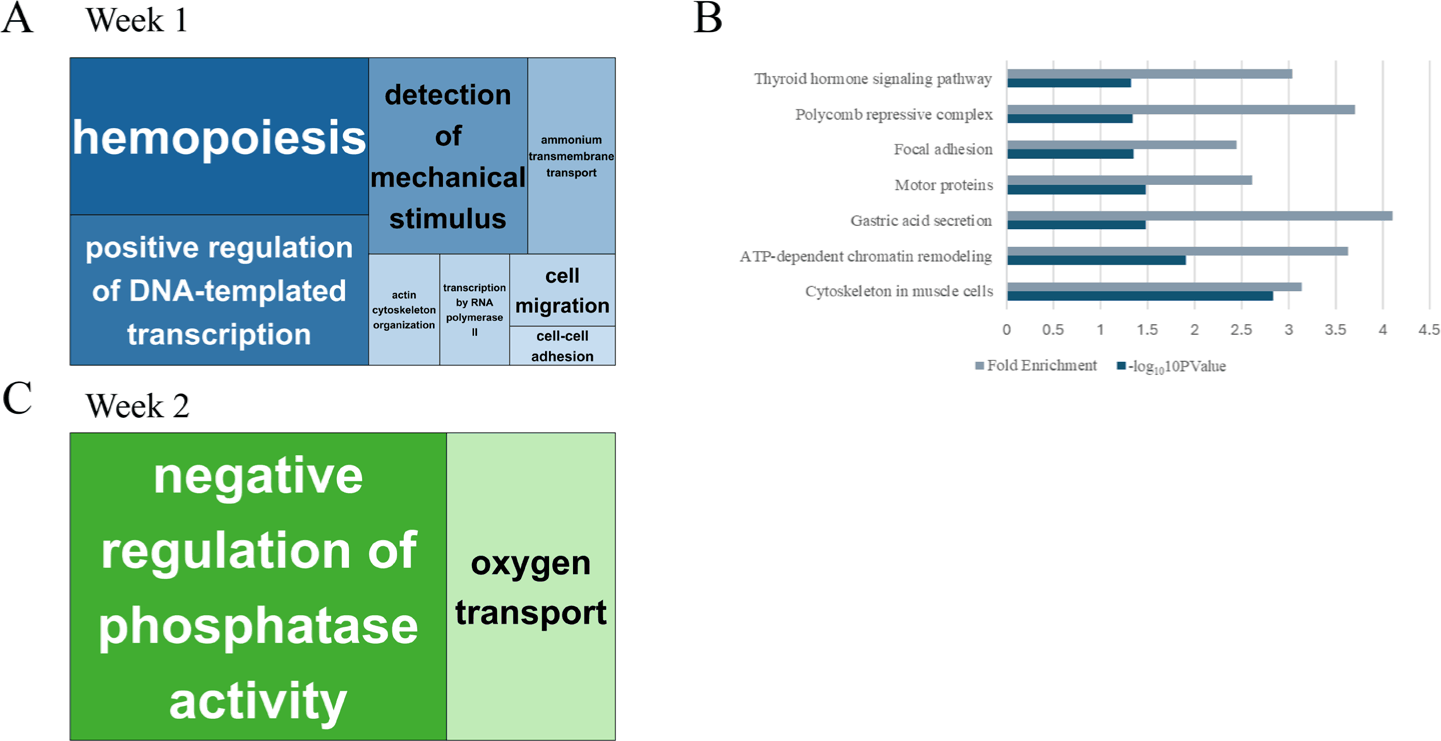
GO enrichment analysis of Week 1 DEGs identified processes, including hematopoiesis, transcriptional activation, mechanical stimulus detection, and cell migration (Fig. 3A), suggesting rapid mobilization of immune and regenerative programs. In Week 2, the enriched GO terms shifted toward metabolic and homeostatic functions, such as oxygen transport and phosphatase regulation (Fig. 3B). KEGG pathway analysis at week 1 further supported these findings, with significant enrichment in thyroid hormone signaling, focal adhesion, gastric acid secretion, and chromatin remodeling pathways (Fig. 3C). No KEGG pathways were significantly enriched at week 2, likely due to the reduced number of DEGs.
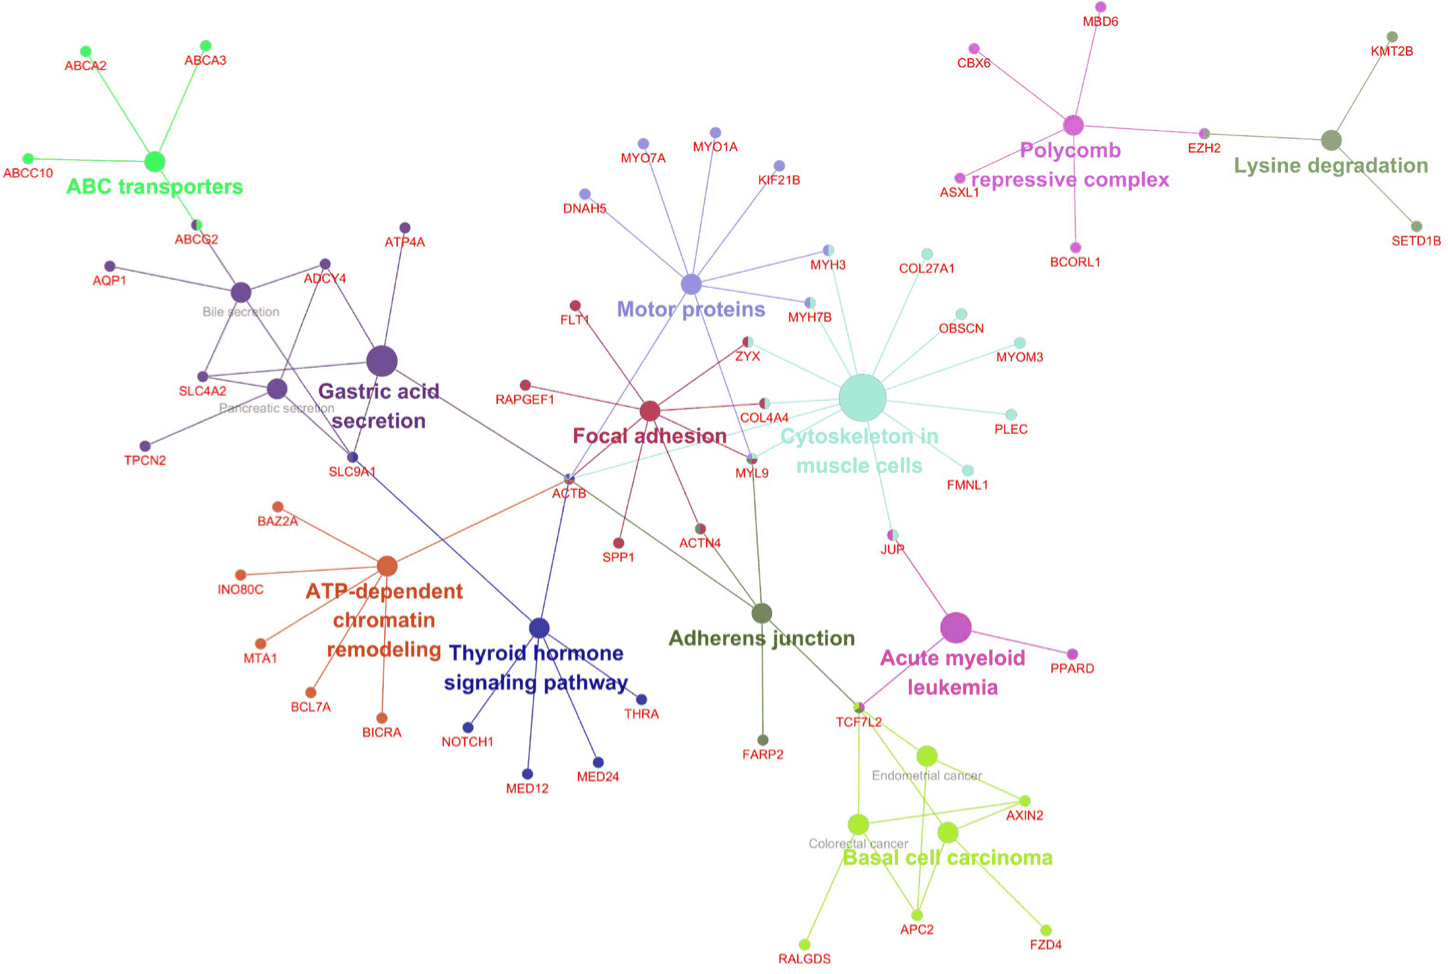
Co-expression network analysis of the Week 1 DEGs using Cytoscape revealed functionally grouped modules, including focal adhesions, cytoskeletal organization, thyroid signaling, and chromatin remodeling (Fig. 4). Additional clusters were associated with disease-related pathways, such as acute myeloid leukemia and basal cell carcinoma, potentially reflecting conserved stress-responsive gene programs. These network structures further highlighted the coordinated regulation of mechanical integrity, signal transduction, and transcriptional dynamics in response to acute HS.
Cell-type deconvolution analysis revealed distinct immune profiles in the TN and HS groups over time (Fig. 5). At Week 1, HS pigs showed an elevated enrichment of multiple T cell subsets, including regulatory and memory CD8 + and CD4 + populations, along with myeloid cells. In contrast, TN pigs exhibited greater enrichment of B cell subsets, such as naïve, memory, and plasma B cells, indicating the maintenance of humoral immunity under thermoneutral conditions [43]. At Week 2, the HS samples retained elevated levels of cytotoxic T cells and plasmablasts, indicating sustained cellular immune engagement. TN samples display an increased abundance of natural killer (NK) cell subsets, including regulatory and cytotoxic NK cells, indicating stable innate immune surveillance [44].
The rCCA identified distinct patterns of association between microbial genera and immune cell populations under each environmental condition. In the HS group, B cell subsets were positively correlated with Prevotella, Megasphaera, Lactobacillus, and Butyricicoccus, suggesting microbial support for humoral immunity. Conversely, T cell subsets exhibited positive correlations with Clostridium sensu stricto 1, indicating the potential microbial modulation of cellular immunity under stress (Fig. 6A).
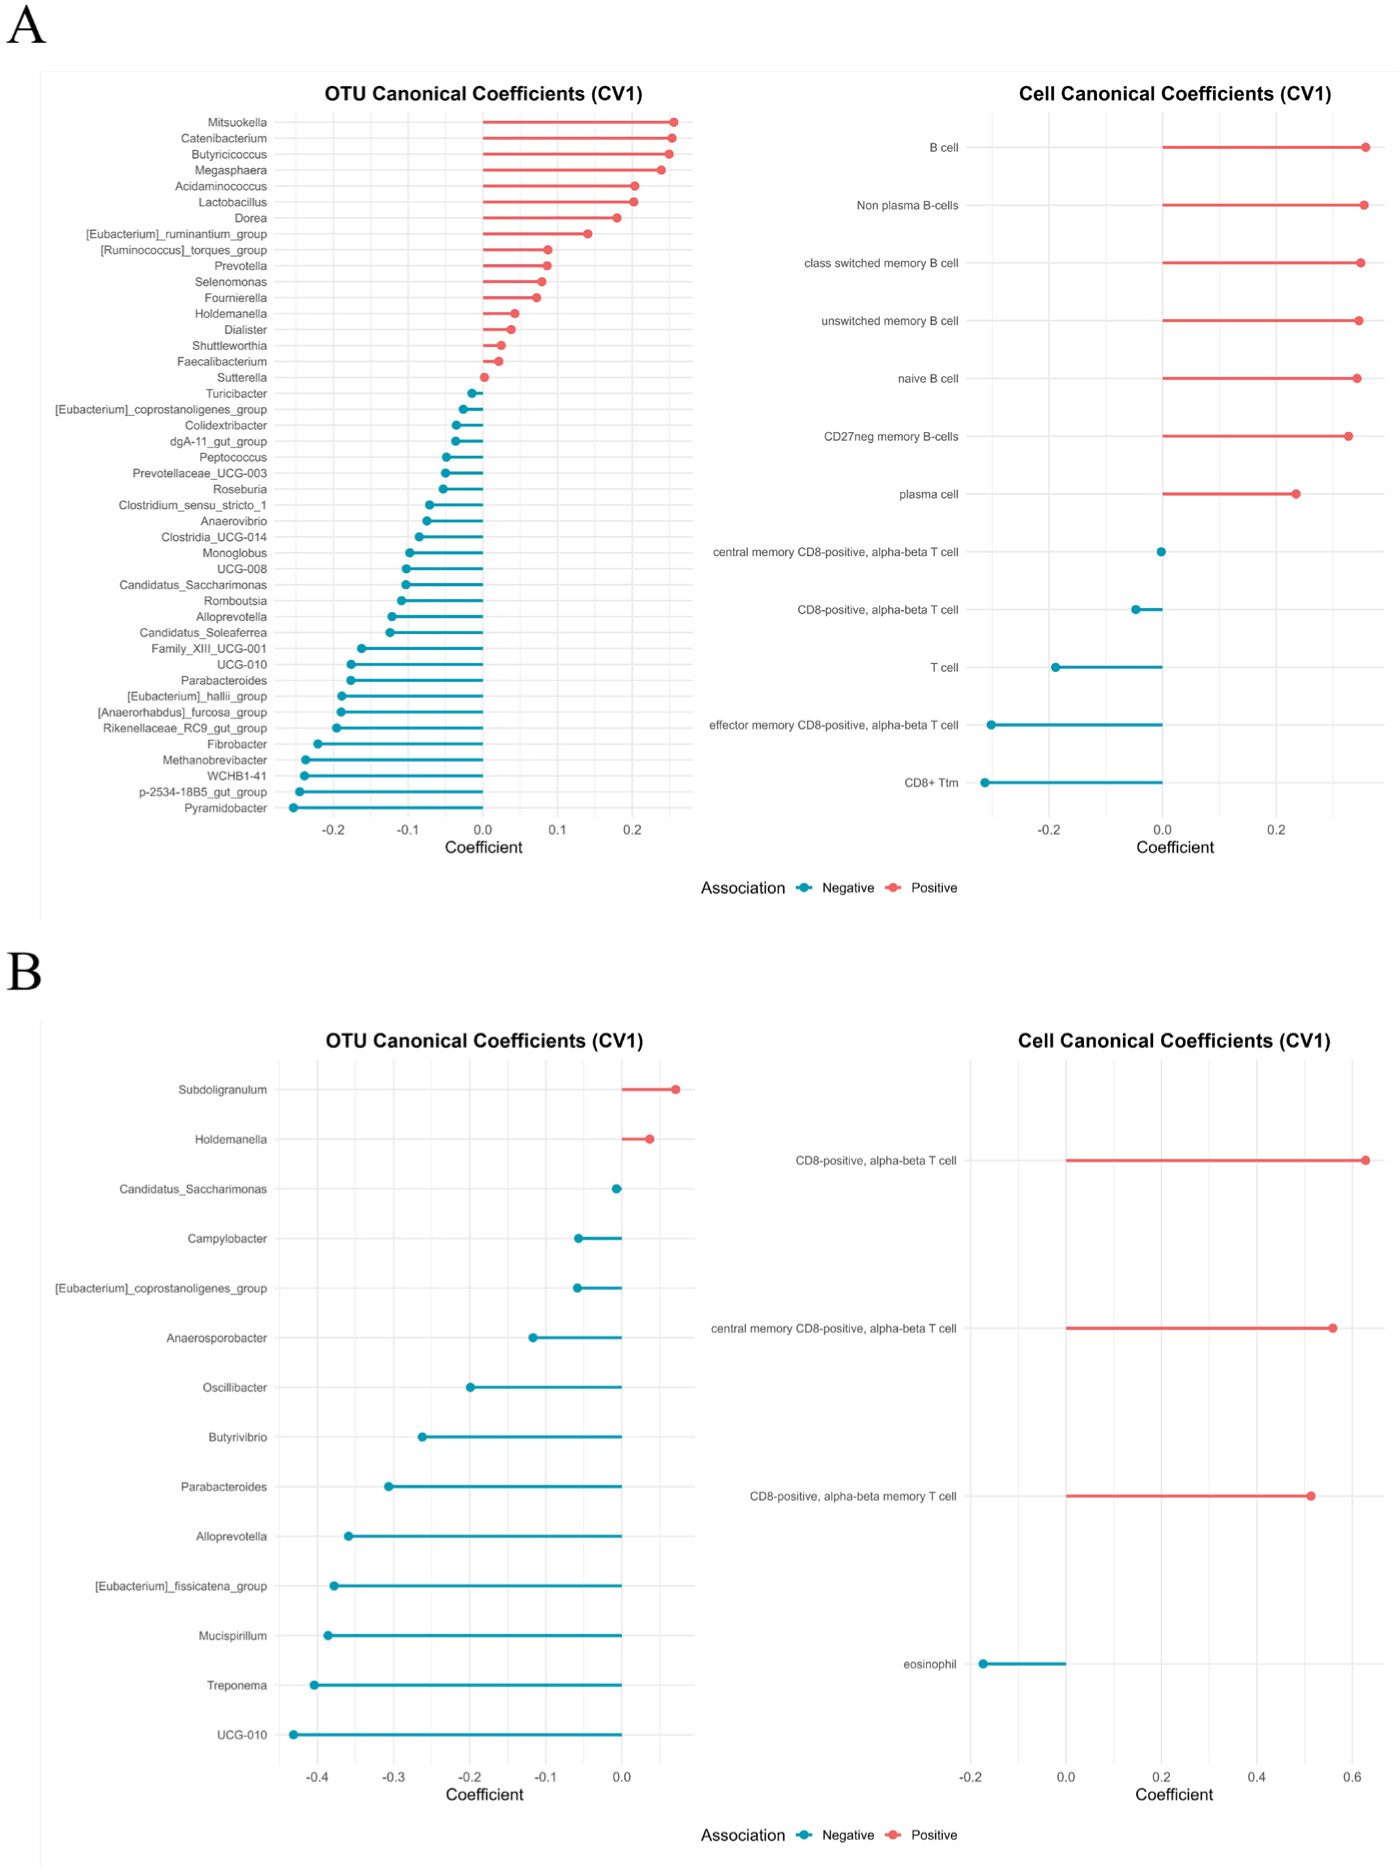
In TN pigs, positive correlations were observed between T cells and genera, such as Subdoligranulum and Holdemania, whereas Oscillibacter and Parasutterella were negatively associated with both T cells and eosinophils (Fig. 6B). These contrasting association networks indicate the existence of condition-specific microbiota–immune interactions.
The integration of gene expression, immune cell composition, and microbial taxa revealed a coordinated molecular framework under HS conditions (Fig. 7). A positively correlated module included B cell subsets and cytoskeletal genes (e.g., ACTB, MYL9, COL4A4, and ACTN4), suggesting that structural reinforcement is linked to humoral immunity. In contrast, T-cell subsets showed negative correlations with the same genes, indicating an immune axis shift.
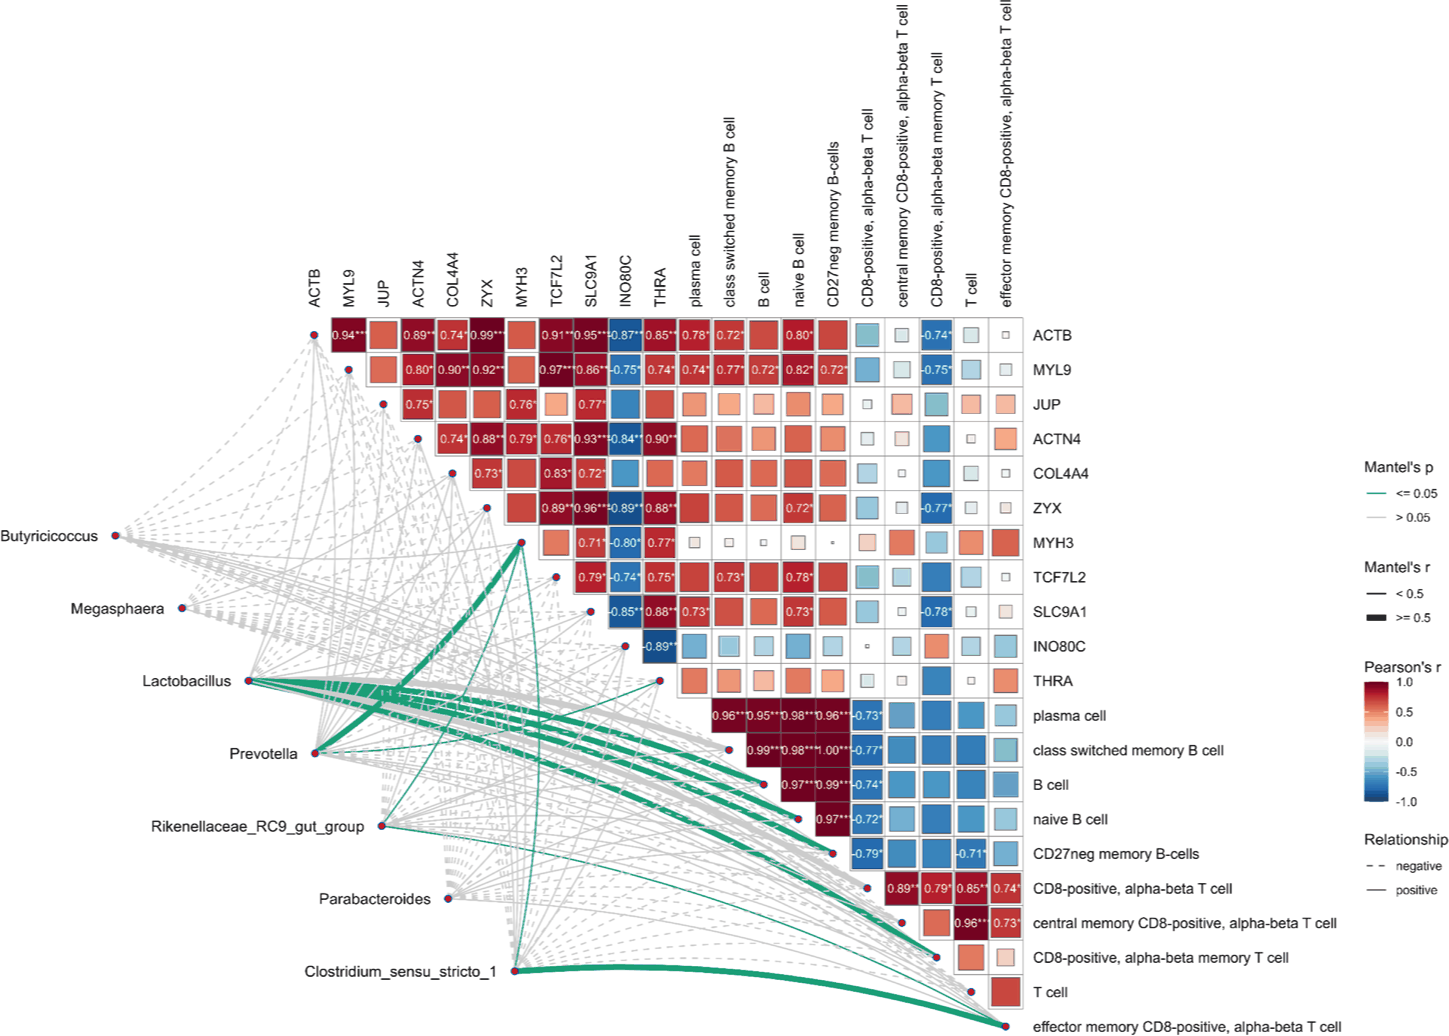
Mantel tests confirmed that genera such as Prevotella and Lactobacillus were aligned with the B cell–gene module, whereas Clostridium sensu stricto 1 and Megasphaera were linked to T cell-enriched networks. These results together demonstrate a hierarchical interaction structure that integrates microbial composition with host immune dynamics and transcriptional programs during acclimation to HS.
DISCUSSION
Overall, the results of this study show that HS significantly impaired growth performance in finishing pigs, as indicated by marked reductions in both average daily gain and feed intake. HS reduced growth performance primarily through decreased feed intake and body-weight gain, without significant changes in feed efficiency, likely due to reduced visceral blood flow, impaired nutrient absorption, and elevated stress hormone levels. These systemic effects are consistent with suppressed anabolic growth and altered energy-utilization pathways.
In addition to these physiological disruptions, substantial changes were observed in the gut microbiota. Principal coordinate analysis revealed a clear divergence in the microbial community structure between the groups over time. Taxonomic profiling revealed that short-chain fatty acid (SCFA)-producing genera such as Prevotella and Streptococcus were depleted under HS conditions, while Clostridium sensu stricto 1 was enriched (Fig. 1C). The loss of Prevotella and Streptococcus indicates impaired mucosal barrier function and reduced SCFA availability, thereby weakening anti-inflammatory regulation by diminishing SCFA-mediated Treg induction and IL-10 production [45,46]. In contrast, the increase in Clostridium sensu stricto 1, associated with branched-chain amino acid (BCAA) fermentation and cytotoxic byproduct production, may exacerbate epithelial damage and inflammation [47]. Consistent with these compositional changes, the predicted microbial pathways in TN pigs were enriched in antioxidant (glutathione), immunomodulatory (retinol), and translational (aminoacyl-tRNA biosynthesis) processes. In contrast, HS pigs showed a diminished representation of these pathways, while protein catabolism via BCAA degradation became more prominent by week 2, indicating a stress-adaptive shift in energy utilization that may contribute to an increased nitrogenous burden and barrier disruption [42].
At the host level, transcriptomic profiling revealed strong time-dependent changes in gene expression. A pronounced response occurred during week one, with enrichment of biological processes related to hematopoiesis, transcriptional regulation, and immune cell trafficking. By week two, the response was attenuated, indicating partial resolution or acclimation. GO and KEGG analyses indicated that structural and signaling pathways, such as focal adhesion, cytoskeletal organization, and thyroid hormone signaling, are central to the acute-phase response. Consistently, co-expression network analysis reinforced this pattern by identifying cytoskeletal remodeling modules (e.g., ACTB, MYL9, ACTN4, and COL4A4), indicating a coordinated transcriptional program aimed at strengthening epithelial integrity under heat stress [48,49].
These transcriptomic changes are accompanied by shifts in immune cell composition. Deconvolution analysis further showed that HS increased T cell and myeloid cell populations, particularly cytotoxic and effector memory subsets, suggesting an acute immune activation profile [50]. In contrast, TN pigs maintained higher levels of B cell subsets, which is consistent with a more stable humoral immune environment [51]. This immune restructuring appears to align with the transcriptomic activation of the migration and adhesion pathways, suggesting the possibility that cellular responses are not only quantitative but also functionally adapted to tissue infiltration and repair [49,52]. Importantly, these parallel findings were not isolated across the omics layers. Indeed, the depletion of Prevotella and enrichment of Clostridium sensu stricto 1 observed in the microbiome coincided with immune restructuring, wherein TN pigs maintained B-cell subsets, whereas HS pigs shifted toward cytotoxic T-cell dominance. Transcriptomic activation of cytoskeletal genes has been suggested to reinforce the epithelium.
The MOI results of the present study suggest a functional alignment between microbial composition, immune architecture, and host gene expression. Specifically, these results indicated that these patterns converged into two opposing axes: (i) a cytotoxic T cell, Clostridium sensu stricto 1 trajectory amplifying inflammatory damage, and (ii) a B cell–Prevotella–cytoskeletal trajectory supporting barrier reinforcement. Notably, only the humoral-structural axis formed a coherent functional module that aligned across all omics layers, suggesting that it may represent a recovery-oriented program. These findings are consistent with prior reports showing HS-induced enrichment of Clostridium sensu stricto 1 in pigs [53], further supporting its potential role in exacerbating intestinal inflammation under stress.
Overall, this dual-axis framework provides a mechanistic model for HS acclimation in finishing pigs, moving beyond descriptive observations toward an integrated understanding of host–microbiome–immune interactions. Importantly, this framework indicates that resilience to HS may rely on the host’s capacity to coordinate humoral and structural defenses in partnership with the beneficial microbiota, thereby maintaining barrier integrity and immune balance under stress. Beyond advancing biological understanding, these findings also highlight translational potential. The identified biomarker axis, Prevotella, B cells, and cytoskeletal genes, could serve as a foundation for precise strategies to enhance swine thermal tolerance, such as microbiota-targeted interventions or the selection of resilient phenotypes.