INTRODUCTION
Anthropogenic greenhouse gas (GHG) emissions, such as carbon dioxide (CO2), methane (CH4), nitrous oxide (N2O), hydrofluorocarbons (HFCs), perfluorocarbons (PFCs), and sulfur hexafluoride (SF6), affect global climate change [1]. The global surface temperature has increased by 0.85°C between 1880 and 2012, and among the GHGs, CH2 and N2O increased by 150% and 20%, respectively, between 2000 and 2010 [1]. Livestock activities produce CH4 and N2O via enteric fermentation and manure management.
The livestock industry contributes approximately 18% of global GHG emissions, measured in carbon dioxide equivalent (CO2-eq), from the agricultural sector [2]. The 2006 Intergovernmental Panel on Climate Change (IPCC) guidelines recognize both CH4 and N2O gases as significant GHGs in the livestock sector and their impact on global warming [3]. The livestock industry produces 38.24% of the total CH4 emissions and 6.75% of the total N2O emissions [4].
In Korea, agricultural emissions accounted for 3% of total GHG emission in 2019 [5]. Within a decade (2010–2019), enteric CH4 emissions and N2O emissions from livestock manure management increased by 7% and 2.1%, respectively [5]. Korea aims to achieve zero carbon emissions by 2050 as a response to climate change. To support this movement, Korea is preparing and implementing measures to reduce the GHG emissions in each sector. Through its Nationally Determined Contribution (NDC), Korea has targeted a 24.4% reduction of GHG emissions with respect to the 2017 level by 2030 [6]. In addition, the Korean government has recently announced a roadmap to decrease GHG emissions by 2030 [7], proposing a 5.2% reduction in overall GHG emissions from the agricultural sector. To achieve this goal, country-specific emission factors are required for the accurate and precise calculation of GHG emissions from the livestock sector in Korea, as recommended by the 2006 IPCC guidelines.
Dairy cattle are a prospective commodity in Korea. Milk consumption in Korea increased by 53% between 2012 and 2021 [8], indicating the possibility of the further expansion of dairy cattle practices. Currently, country-specific emission factors for dairy cattle are only available for enteric fermentation. Therefore, this study was conducted to measure GHG emissions from manure management in dairy cattle practices. These data could be used as a database to build country-specific emission factors for GHG emissions from manure management of dairy cattle.
MATERIALS AND METHODS
The experiment of emissions from bedding was conducted from November 5, 2018 (day of year; DOY 309) to October 29, 2019 (DOY 302) and the experiment of composting emissions was conducted from May 27, 2019 (DOY 147) to October 25, 2019 (DOY 298). Both studies were conducted at Affiliated Vivarium of the College of Animal Life Science Kangwon National University farm located in Chuncheon, Gangwon-do Province, Korea. During the study, a total of five Holstein cattle, three dairy cows (27–68 months old), and two steers (12–15 months old) were housed in open pen with a winch curtain. The dairy cow were fed with concentrate (12 kg/head/day), rye grasses (Lolium) and Sudan grasses (Sorghum x drummondii) as forage (voluntary intake). The steers were fed with concentrate (5 kg/head/day) and grass silage as a forage source (voluntary intake). All cattle were administered water ad-libitum. The surface pen area of the dairy cow was 178.95 m2, and that of the steer was 25.84 m2; sawdust was used as bedding material with a thickness of around 10 cm. During the experiment period, the mixture of bedding and manure was mixed and turned over. Also, bedding was replaced one time during the experiment period.
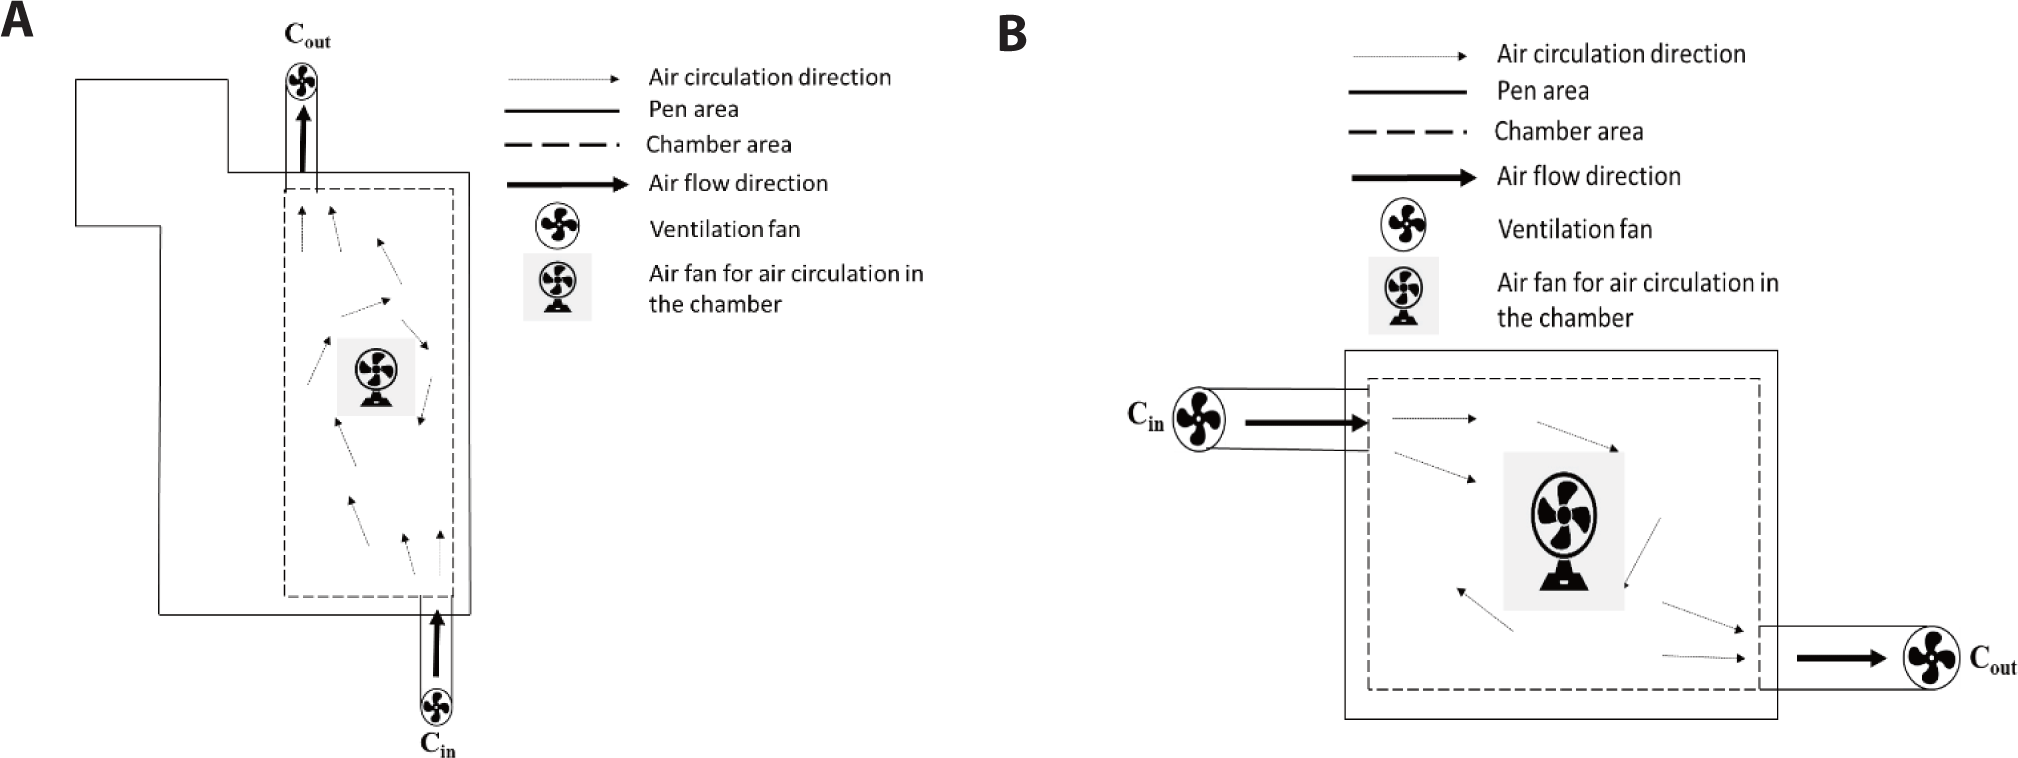
Separate chambers were built for each group of dairy cow and steers. The area of chamber for dairy cow was 77.5 m2 and consisted of three cattle. The chamber area for steers was 24.45 m2 and consisted of two steers. The chambers were installed using iron pipes and waterproof tents, allowing them to be disassembled and reassembled. The fan was installed diagonally in the chamber for continuous flow (Fig. 1), and the airflow was measured using a multi-purpose digital anemometer.
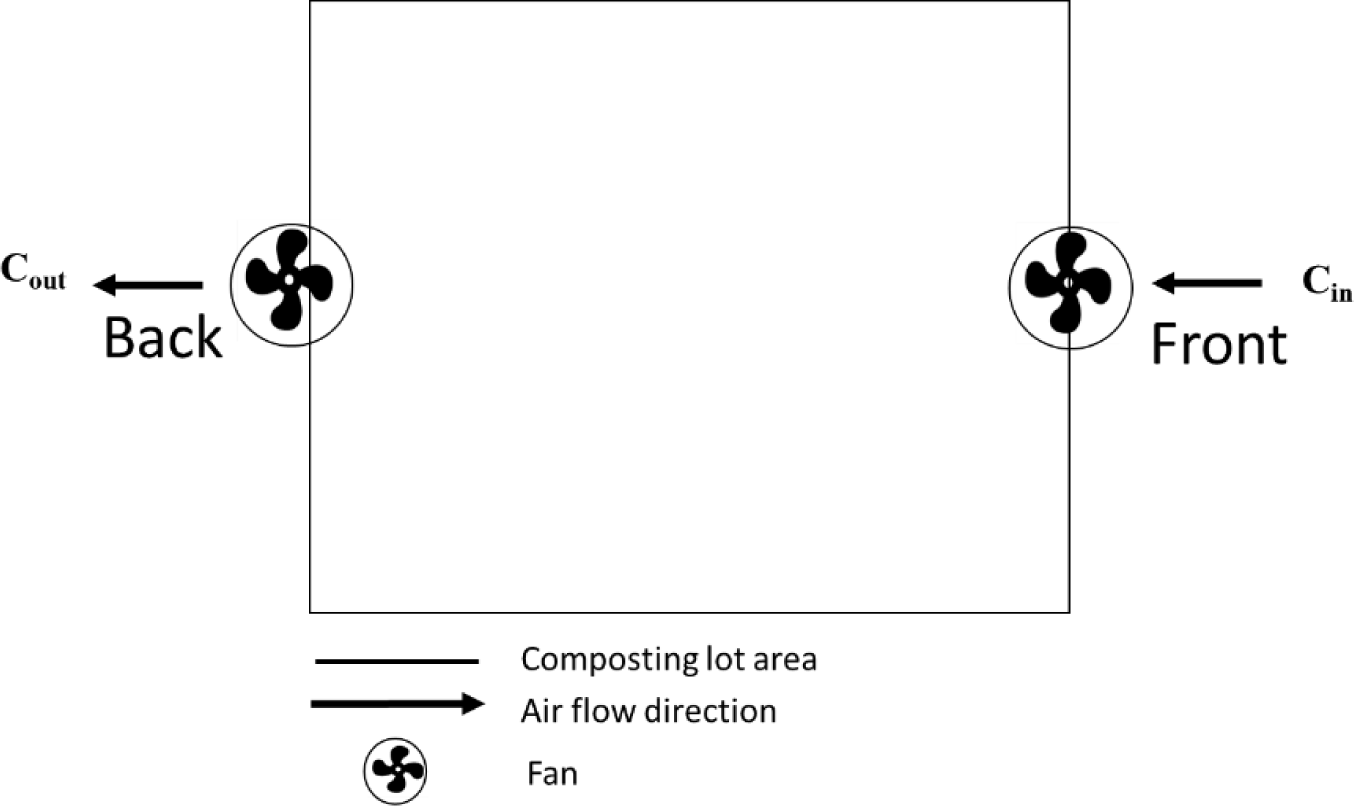
CH4 and N2O emissions from composting were measured using a large open chamber. The entire compost was place into a chamber, and fans were installed at the front side as air inflow and at the back as air outflow (Fig. 2). The composting lot was filled with manure from dairy cow, steers, and bedding material.
The gas samples were taken each from dairy cow barn and steer barn. The first-time sample was collected on November 5, 2018 (DOY 309), and the last-time sample on October 28, 2019 (DOY 301). Samples were taken once a week every Monday at 18:00 until Tuesday at 15:00. Within the sampling time, samples were collected in three hours interval. This method was performed to consider the changes of flux during the time, so that the variation of daily flux could be noticeable. Samples of each interval were taken three times from each barn, therefore during sampling time, the total samples from each barn were 24. The first sample was taken 1 h after chamber installation and after the fan was operated to stabilize the internal gas concentration. The suction and exhaust fans were connected to the chamber via a duct hose. The gas flowing in from the inlet of the suction fan was collected as a sample-in, and the outflow gas was collected as a sample-out by creating a sampling port in the duct hose that was connected to the exhaust fan. Samples were taken using a 25 mL syringe (Jung Rim Syringe, Jung Rim Medical Industrial, Seoul, Korea), stored in an 8 mL vacuum vial (LK LAB KOREA 99429, LK Lab Korea, Namyangju, Korea), and sealed with rubber septa (Samwoo Kurex® 15 mm, Samwoo Kurewx, Seoul, Korea). The vial was evacuated (VALUE® TF-VE245N, Teddington-France, Vulleneuve la Garenne, France) for 5 min prior to storage. The vial containing the sample was then sealed with parafilm and immediately analyzed using gas chromatography (GC).
The flow rate was measured using an airflow capture hood or barometer (Alnor® Electronic Balancing Tool EBT721, TSI incorporated, Shoreview, MN, USA and AIRFLOWTM Instrument ProHoodTM Capture Hood PH721, TSI Instruments, London, UK). Wind speed was also recorded across the surface area of the fan, at flow rates of 0.0843 and 0.0590 m3/s for dairy cow and steer, respectively.
Gas samples were analyzed immediately after collection to measure the CH4 and N2O concentrations. The analysis was performed using a GC (iGC7200A, DS Science, Gwangju, Korea) equipped with an electron capture detector and a pulsed discharge detector (PDD) (VICI PDDs, Valco Instrument, Houston, TX, USA). The gas was calibrated with 1 ppm and 100 ppm gas standard for both CH4 and N2O. Calibration was performed 20 times for each gas to increase the confidence of the gas analysis. A 1 mL-sample was taken from an 8 mL-vial using 1 mL-syringe then injected to the GC machine. Each sample of each barn from different sampling time was analyzed three times. Therefore, the average concentrations of CH4 and N2O of each sampling time was obtained from the average of 9 analyses (3 gas sample/sampling time × 3 analysis/sample).
The open chamber method was used to measure CH4 and N2O emissions. The flux was calculated as follows:
where flux (µg/head/s) is the rate of GHG emissions, FR (m3/s) is the flow rate, Achamber (m2) is the chamber area, Apen (m2) is the pen area, head is the number of animal, and Δc (μg/m3) represents the concentration difference. The concentration difference was calculated using the following equation:
where (Cout−Cin)(ppm) is the difference in gas concentration measured using a trace gas analyzer, P (Pa) represents air pressure, M (g/mol) represents the molecular weight of the target gas (CH4 = 16.04 g/mol; N2O = 44.013 g/mol), T (°K) represents temperature, and R (8.314 J/mol/K) represents the universal gas constant.
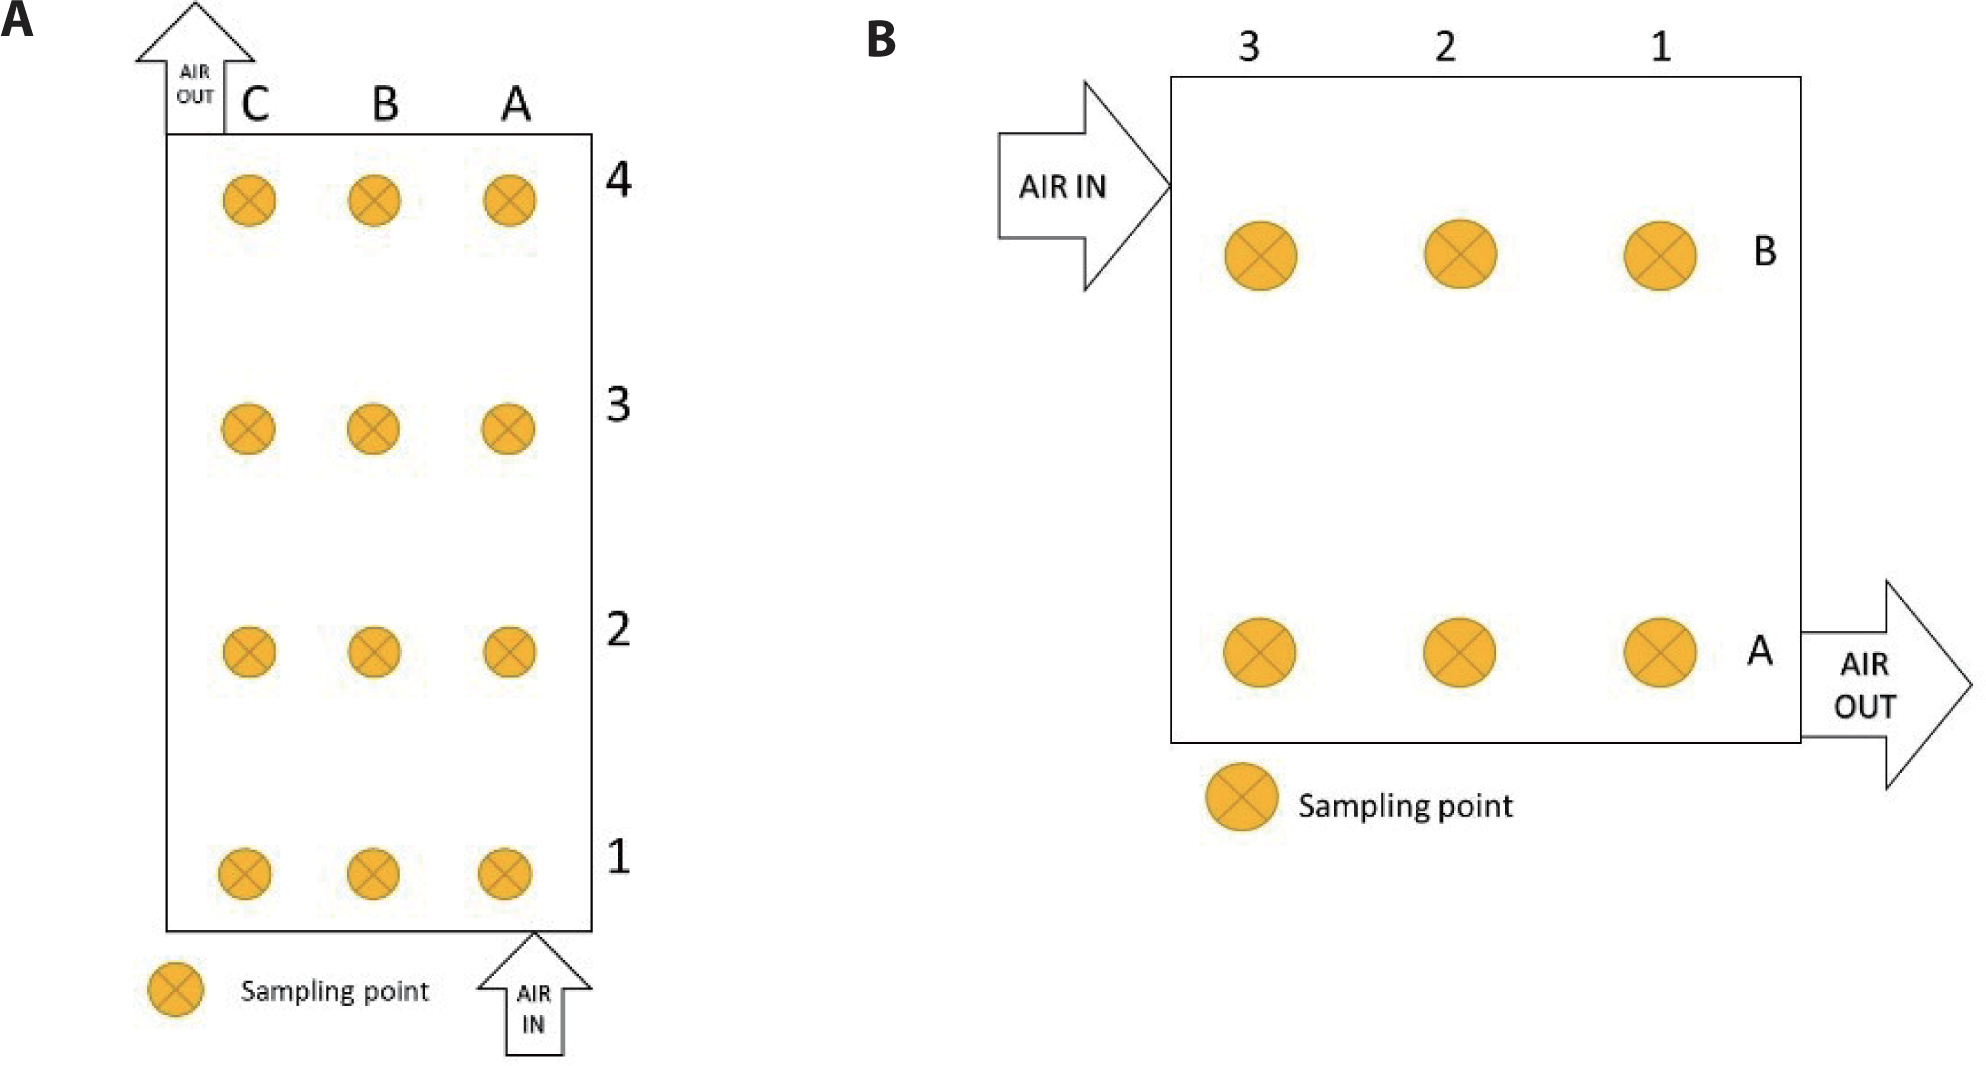
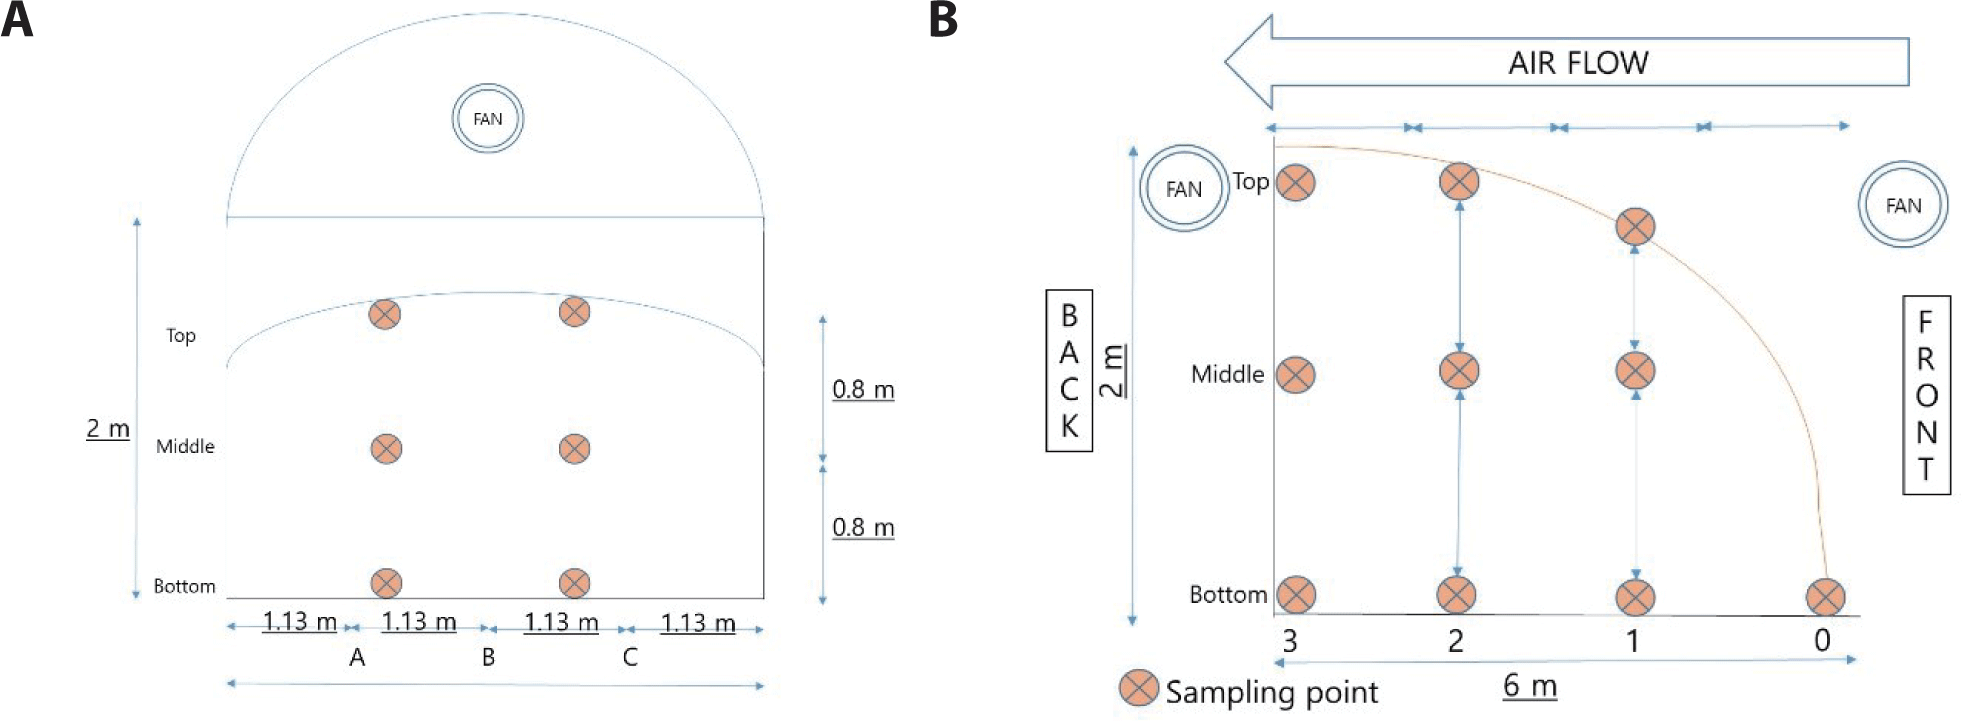
Bedding samples were collected in triplicate at the beginning of the experiment in winter and twice in each remaining seasons (autumn, spring, and summer). The bedding sample was placed in a (25 × 30) cm2 zipper bag. Samples were taken from various points inside the barn (Fig. 3) and composting lot (Fig. 4). For composting lot, samples were taken from two sides, left and right (Fig. 4A) and from each side, samples from top, middle, and bottom were taken separately (Fig. 4B). Manure and compost sampling commenced on November 13, 2018 (DOY 317), followed by sampling in winter (December 2018 and January 2019), spring (April and May 2019), summer (July and August 2019), and autumn (September and October 2019). The sample was analyzed for total solids (TS), volatile solids (VS), total Kjeldahl nitrogen (TKN), ammonium nitrogen (NH4-N), and nitrite and nitrate (NO2− and NO3−) [9,10]. TS were analyzed by oven-drying the sample at 100°C for 24 h, and the remaining sample was then burned in a furnace at 600°C for 6 h to measure the VS. TKN was analyzed using the Kjeldahl method and read with an auto water analyzer (Quichem 8500, LaChat, Milwaukee, USA), and NH4-N and NO2− and NO3− were analyzed using an auto water analyzer (Quichem 8500, LaChat, Milwaukee, USA).
Statistical analysis was performed using SPSS (IBM SPSS Statistics 26). Data obtained from the measurement were analyzed with one-way analysis of variance (ANOVA). Tukey’s honest significant difference (HSD) post hoc test was performed to determine multiple comparison. In this study, HSD was performed to compare the differences of each CH4 and N2O between seasons. A p-value (< 0.05) was designated to determine statistical significance.
RESULTS AND DISCUSSION
The average CH4 flux during the sampling period from steer between November 2018 and October 2019 ranged from −7.60 ± 3.98 to 105.44±51.43 µg/head/s, with an average flux of 27.88 ± 5.84 µg/head/s (Fig. 5). There was a significant increase in the CH4 flux in April 2019. This sharp increase of CH4 was suspected to be a result of bedding mixing on DOY 111. Owing to bedding turnover, some hardened part of the manure and bedding mixture was broken, and the trapped CH4 was released, which may have caused the rapid increase in CH4 flux. The formation of a hard surface layer of the manure and bedding mixture can provide significant barriers to both gas movement and evaporation; therefore, agitation causes the crust to break and release gases [11]. This was also strongly supported by the sharp decrease in emissions after bedding mixing. The flux continued to be relatively stable until bedding replacement. CH4 emission depends on several factors, such as the physical form of the manure (shape, size, density, and humidity), amount of digestible material, climate (temperature and humidity), and length of the stool [12]. Environmental variables, such as temperature, rainfall, and organic matter (OM) content, moisture, and soil properties, such as redox potential and pH, alter the composition and release rate of exudates and ultimately influence methanogenesis [13]. The negative values of CH4 emissions can be attributed to CH4 consumption by the soil. When the balance between production by methanogens and consumption by methanotrophs is positive, CH4 is released; when the balance is negative, the environment acts as a CH4 sink [14]. In addition, GHG flux fluctuates over time depending on the conditions of the experimental site, including temperature [15,16] or the interference of emissions from other building. The experimental site was consisted of several occupied buildings, therefore, the emissions from other building was possibly mixed with the surrounded air, resulting to higher emission in Cin than that in Cout. Hence, the flux was negative.
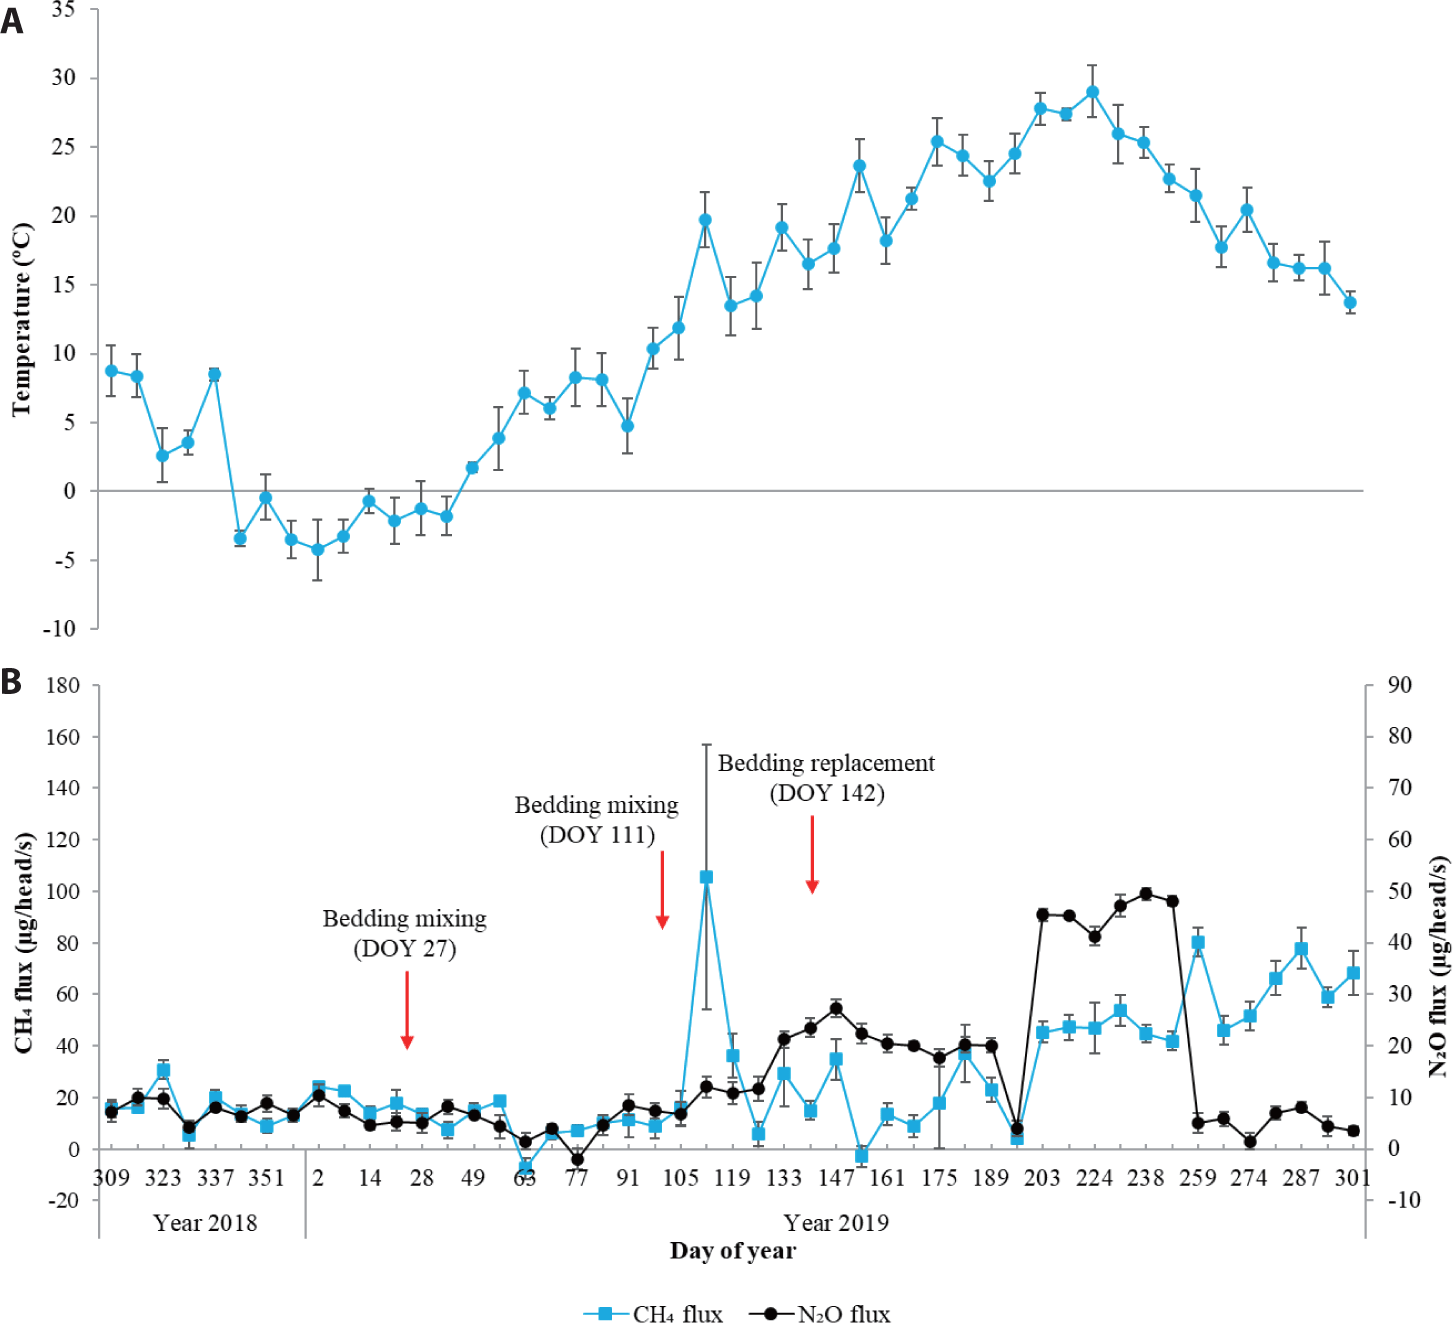
N2O flux from the steer during the experiment period ranged −1.92 ± 0.91 to 9.49 ± 2.33 µg/head/s, with an estimated average flux of 14.04 ± 1.27 µg/head/s (Fig. 5). The N2O flux trend was consistent with the changes in temperature. This is in line with Akdeniz et al. [17] that N2O measurement varied depending on the range of CO2 and moisture levels (dew points) temperature. Since the temperature of the surrounding environment affects the temperature of the manure surface, it can affect the reaction rate and growth of microorganisms. The nitrification rate increases with increasing temperature, and the maximum nitrification and denitrification temperatures may vary depending on the climate [18]. Moreover, after the bedding replacement on DOY 142, a high nitrogen content was present in the bedding, as shown by the high TKN value (Table 1), indicating that there is a high nitrogen source for N2O generation, which is also supported by the high NO2− and NO3− and low NH4-N content.
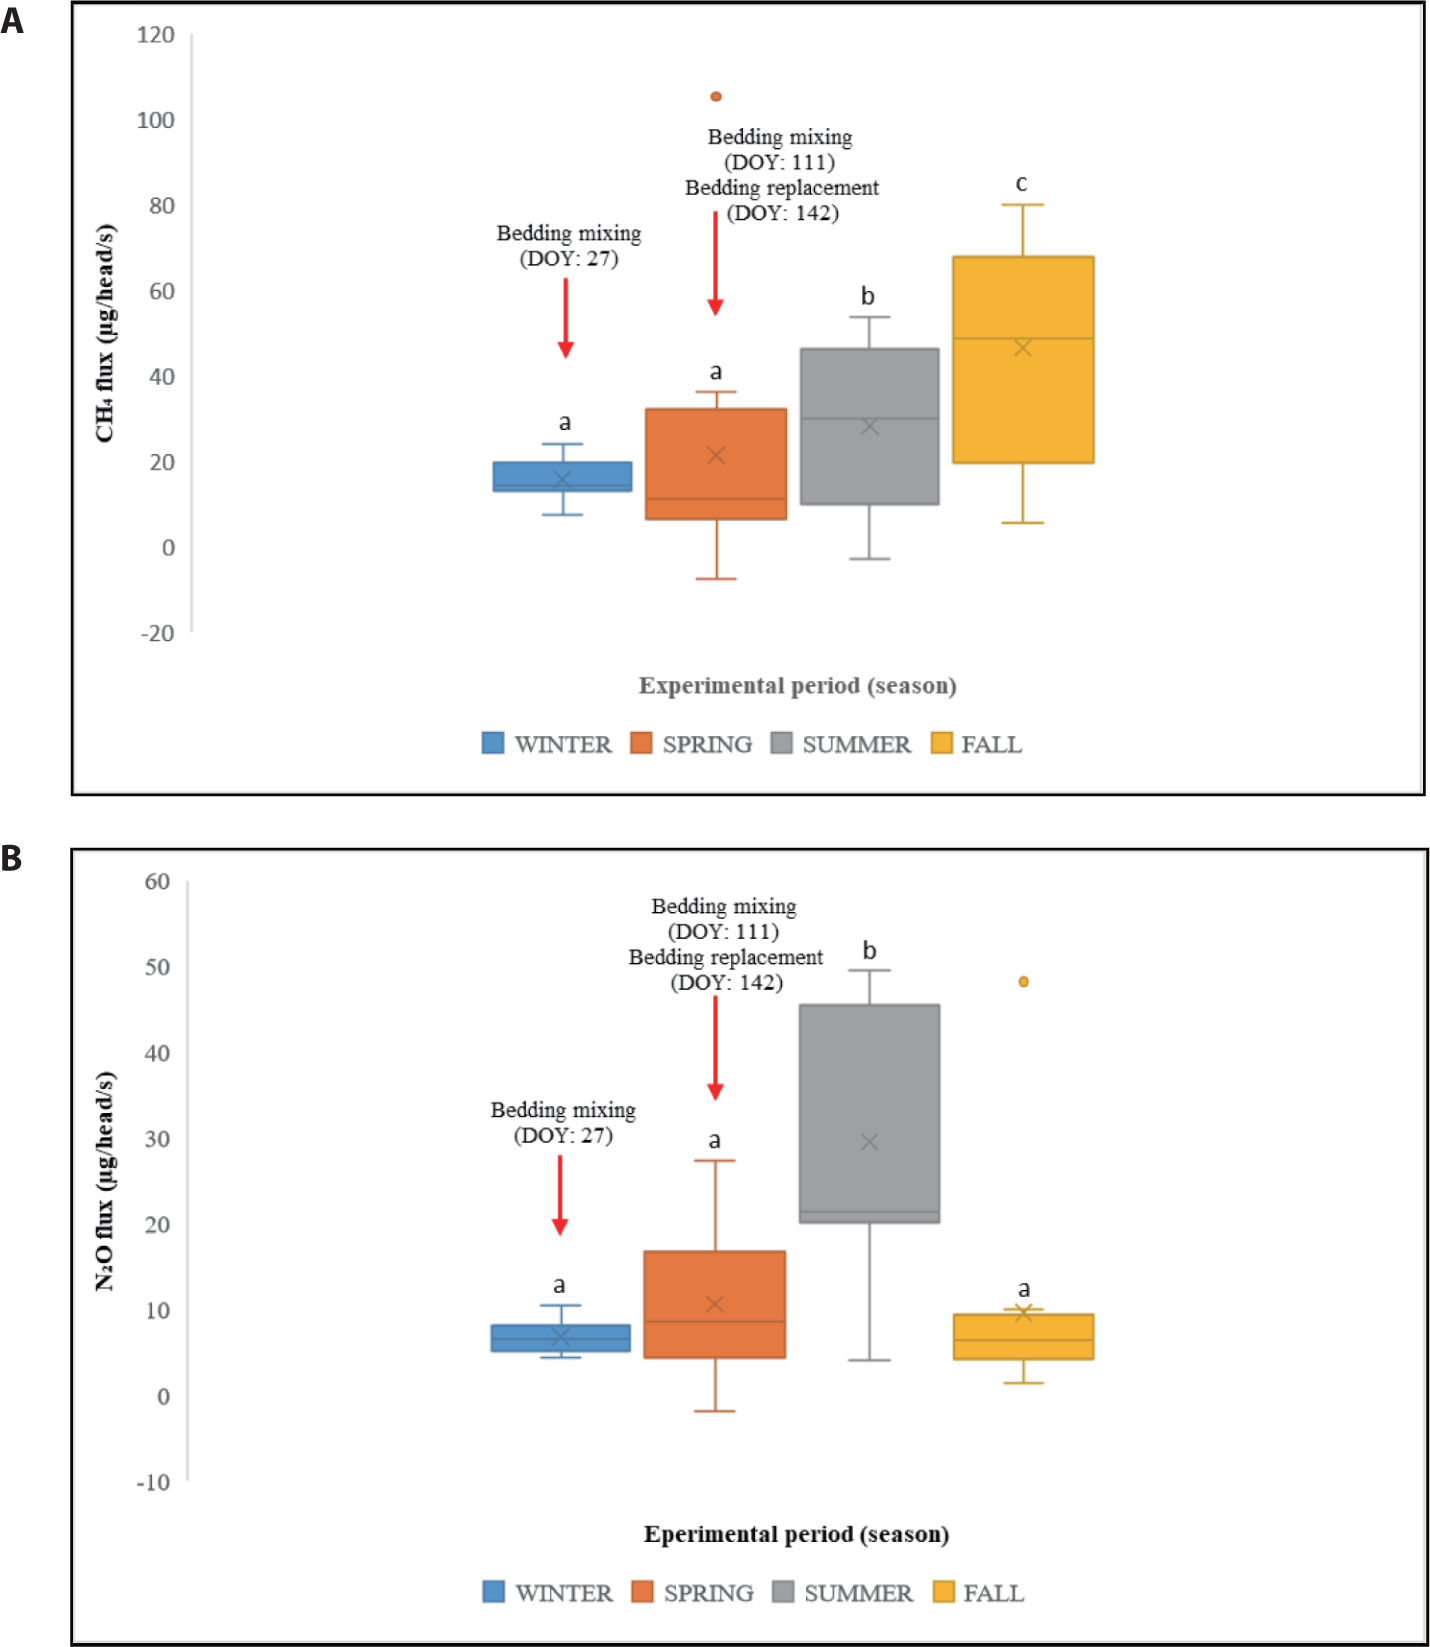
Seasonal changes in emissions were different for CH4 and N2O (Fig. 6). The CH4 flux was relatively low in winter then gradually increased during spring, summer, and fall. The flux in the fall was significantly higher than that in the winter and spring. The N2O flux in the summer was significantly higher than that in the other seasons. Both the CH4 and N2O fluxes were consistent with the changes in temperature, indicating that temperature changes within each season affected the CH4 and N2O fluxes. CH4 flux is likely to be affected by several factors, such as moisture content, compost aging period, oxygen availability, temperature, and pH [19]. Other factors may also contribute to the CH4 flux, such as the condition of the bedding material [20].
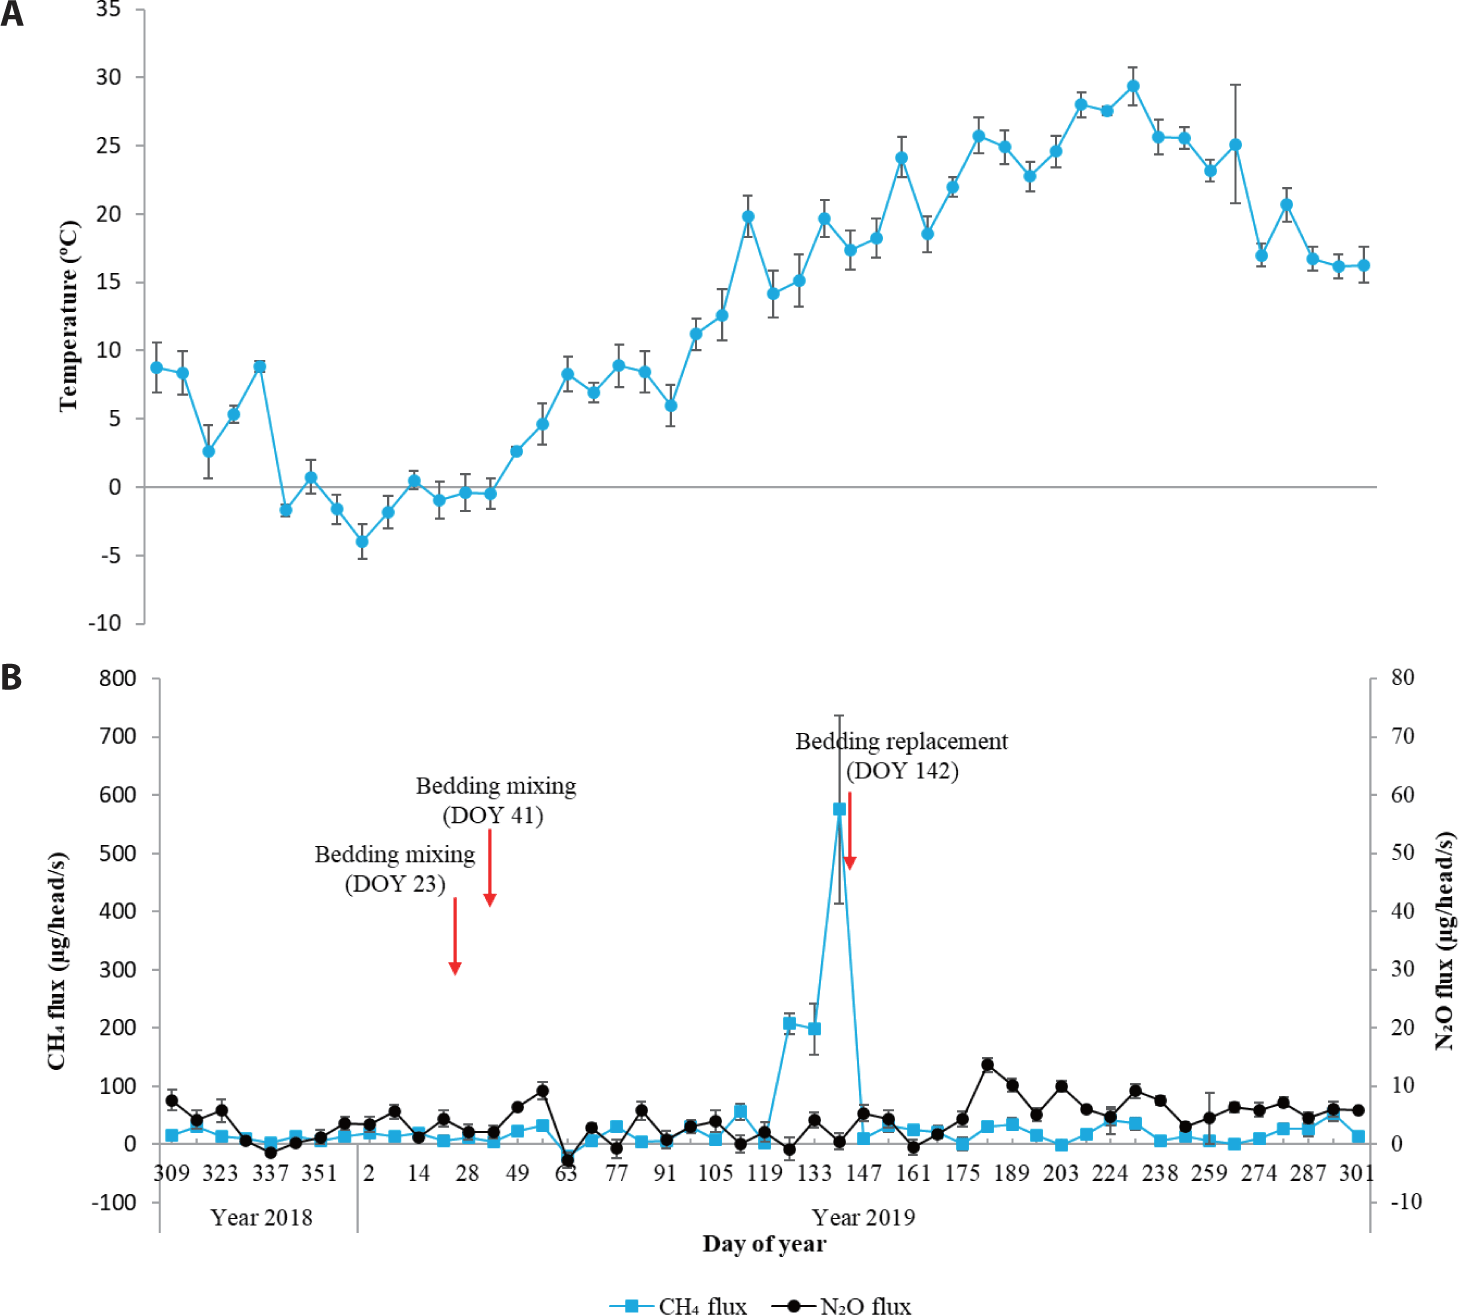
During the experiment period, the average CH4 from the manure-bedding mixed from the dairy cow barn ranged from -19.74 ± 6.30 to 575.52 ± 161.43 µg/head/s, with an average flux of 36.12 ± 10.85 µg/head/s (Fig. 7). There was a very sharp and sudden increase in CH4 flux in the period between DOY 118 and DOY 139, then a rapid decrease a week later (DOY 146). A possible cause of the rapid increase in CH4 is the delayed period of CH4 production. This delay in methanogenesis is defined as little or no methanogenic activity for a certain period [21], and CH4 production depends on the manure storage time for sufficient methanogenic growth [22]. A lower CH4 flux may occur because microbial communities are less likely to form during shorter storage periods [22]. This is supported by the constant flux before the rapid flux occurred and the higher VS contained in the manure on DOY 112 than in the previous period, indicating that the source of CH4 increased (Table 2). The N2O flux ranged -2.72 ± 1.66 to 13.67 ± 1.75 µg/head/s, with an average flux of 4.11 ± 1.57 µg/head/s (Fig. 7). The N2O flux showed relatively little fluctuation compared to the CH4 flux during the measurement period, and the temperature changes seemed to have no significant effect on N2O flux.
Seasonal CH4 and N2O fluxes from the dairy cow barn are shown in Fig. 8. CH4 flux tended to be similar in fall, winter, and summer, while in spring, CH4 showed a high flux, almost four times higher than in other seasons. However, the changes in the flux were not significantly different. In contrast to the CH4 flux, the N2O flux was somewhat high in fall, and it gradually decreased in winter, had the lowest flux in spring, and then increased substantially in summer. The flux in the summer was significantly higher than that in the winter. Seasonal CH4 and N2O fluxes were inconsistent with the changes in temperature, indicating that in the case of dairy cow, other factors may contribute more to the CH4 and N2O fluxes. Other factors, such as the rates of oxidation and transport, affect CH4 production. If CH4 production is low and the path of its diffusion is long in the presence of oxygen, oxidation will likely occur, and little CH4 will be released [23]. The negative flux could be attributed to the relatively high C/N ratio (carbon to nitrogen ratio) in manure, which is affected by temperature and moisture [24]. However, further research on this negative flux is required.
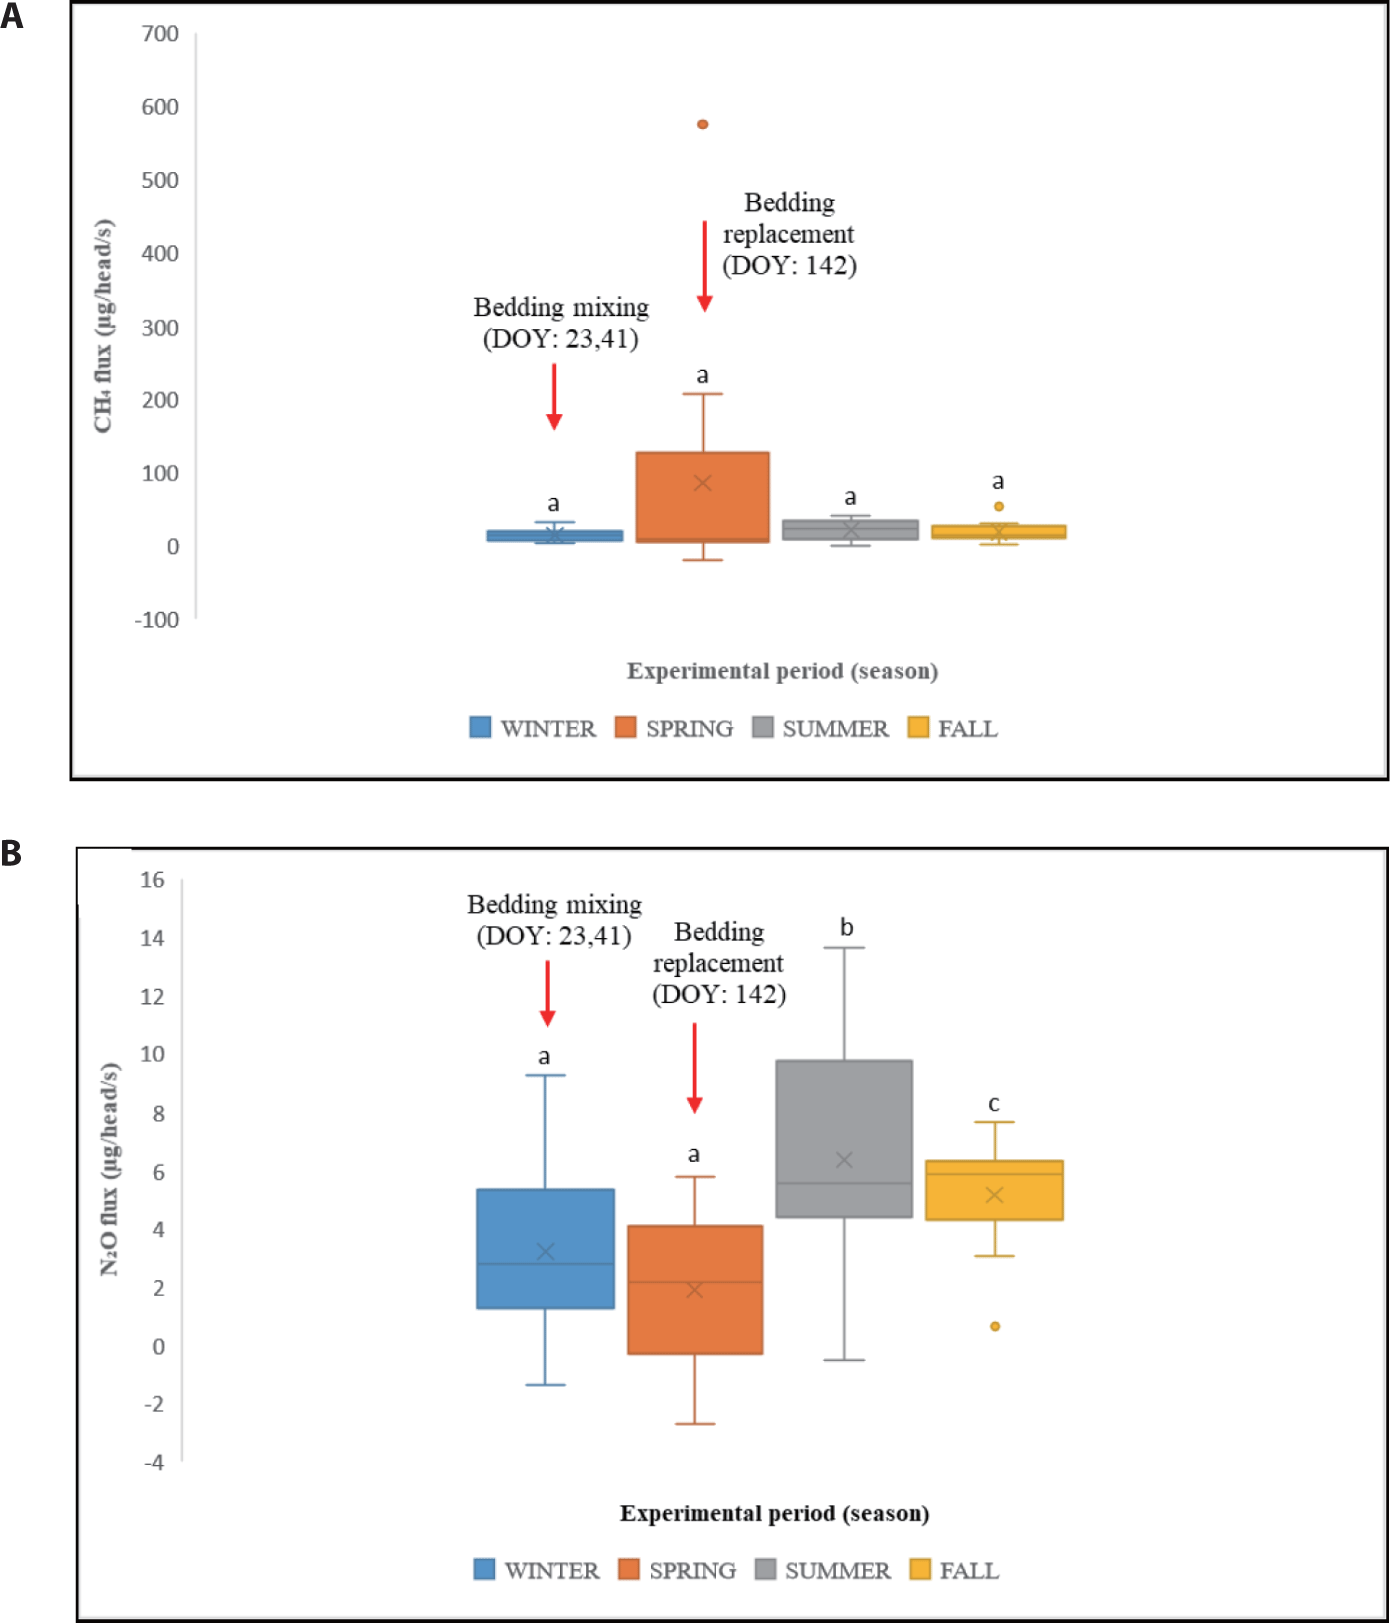
N2O flux is affected by many factors, including the surface conditions of the barn litter and manure mixture [25]. Since the temperature of the surrounding environment affects the temperature of the manure surface, it can affect the reaction rate and growth of microorganisms. The nitrification rate increases with increasing temperature, and the maximum nitrification and denitrification temperatures may vary depending on the climate [14]. Barns using hay or sawdust as flooring on hard ground have higher building manure accumulations, which are usually stored in litter heaps, creating conditions for nitrification and denitrification and increasing N2O flux [26].
CH4 flux from the composting lot ranged 2.21 ± 6.84 to 2,184.99 ± 292.71 µg/head/s, with an average of 259.44 ± 61.78 µg/head/s, and N2O flux ranged -0.26 ± 0.82 to 9.78 ± 1.78 µg/head/s, with an average of 3.97 ± 1.08 µg/head/s. A high CH4 flux was observed in the early stage of composting; however, the opposite trend was observed for the N2O flux (Fig. 9). A similar study reported that the concentration of CH4 was high owing to the low oxygen and high carbon dioxide concentrations during the initial period of composting [27], also, depending on C/N ratio, CH4 production may differ [28]. However, the highest N2O concentration occurred as the oxygen concentration decreased over time [27]. When oxygen is available, microbial degradation occurs primarily through respiration, which produces carbon dioxide, whereas in the absence of oxygen, methanogens produce CH4 [29]. In addition, oxygen is rapidly consumed during composting, resulting in thermophilic conditions owing to the decomposition of organic compounds by microorganisms, and CH4 is produced through methanogenesis [30]. An increase in the temperature of the composting loop enables the growth of nitrifying bacteria responsible for N2O production [16].
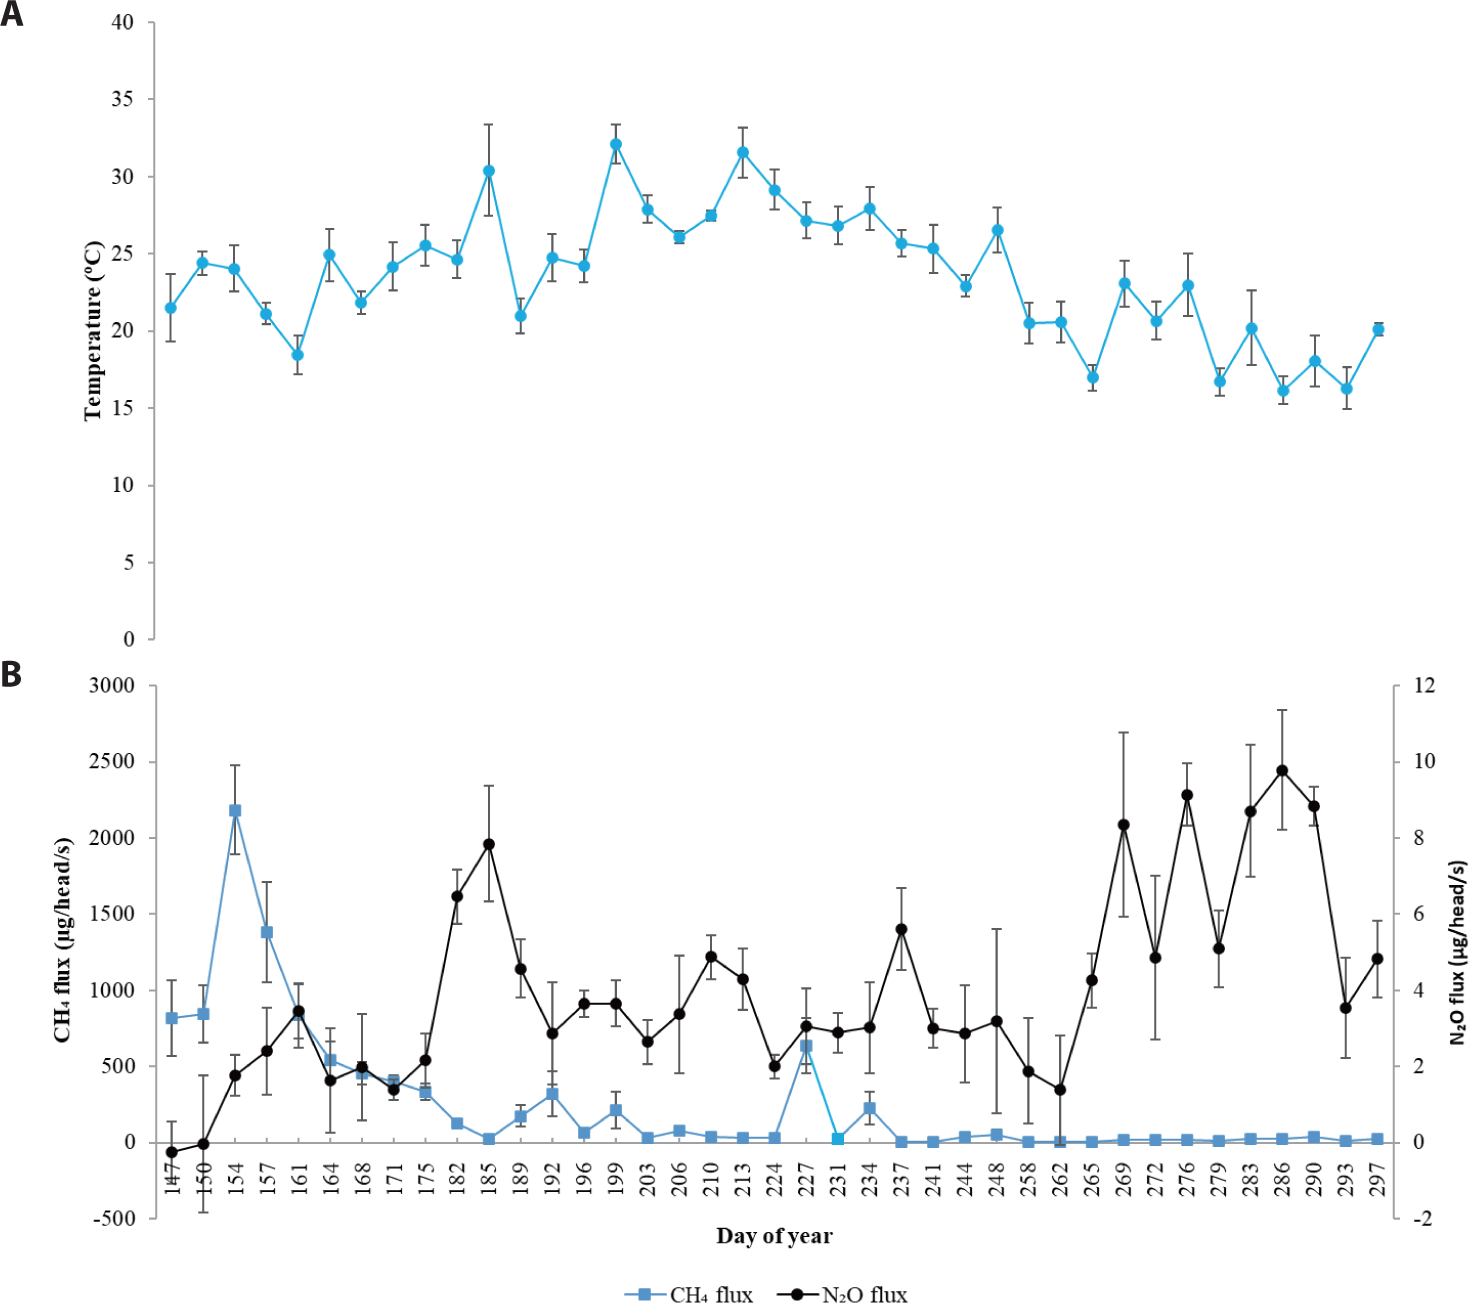
Although composting is usually an aerobic process, it is possible without the need for manure to be stored in the composting lot and without further composting or periodic turning over to promote composting [29]. However, if aeration and agitation of the composting lot are not sufficiently performed during the composting process, GHG emissions will increase further [31]. The amount of aeration affects both methanogenesis and denitrification processes and the resulting gas emissions [28]. Moreover, the presence of bioactive compounds can also inhibit methanogenesis [32].
CONCLUSION
In accordance with the government’s declaration of carbon neutrality by 2050, the reduction of GHG emissions in all sectors is considered urgent. Country-specific activity data is needed to take the required action to meet the goal. This study was designed to be similar to the actual process of domestic livestock manure treatment in Korea and was conducted to accumulate GHG data using the open chamber method. CH4 fluxes from steer, dairy cow, and manure compost were 27.88 ± 5.84, 36.12 ± 10.85, and 259.44 ± 61.78 µg/head/s, respectively. N2O fluxes from steer, dairy cow, and manure compost were 14.04 ± 1.27, 4.11 ± 1.57, and 3.97 ± 1.08 µg/head/s, respectively. These results can be used as a baseline to construct country-specific activity data to calculate greenhouse gas emissions from the manure treatment of dairy cattle. Thus, GHG inventories would show more real emissions, and policies, mitigation, and other actions to reduce GHG emissions would be more specific. Due to limited number of animals used in this experiment, more similar researches are still needed to be conducted to produce more data to achieve better precision to construct country-specific emission factor for Korea. In addition, conducting similar research in different management practice (i.e., free range) may also be necessary.

