
INTRODUCTION
Salmonella is harmful bacteria that causes foodborne illness in sensitive consumers like the elderly (> 65 years old), children (< 5 years old), pregnant women, and immune weakened people [1]. Salmonella infection can be transmitted by contaminated eggs or chicken meat, as well as transportation, cooking, and serving. After an incubation period of 6 to 48 h, symptoms such as vomiting, diarrhea, and fever occur when contaminated foods are ingested [2,3]. Salmonella causes roughly 1.35 million infections, 420 deaths, and 26,500 hospitalizations in the United States, according to the CDC [4]. In 2021, five European Union/European Economic Area (EU/EEA) nations and the United Kingdom (UK) reported 272 confirmed cases. There were two adult male deaths, and twenty-five individuals were hospitalized. Sixty of the interviewees specifically mentioned consuming eggs/egg products [5]. In 2020, eggs and egg products are the most common foods linked to Salmonella, accounting for 5.3% of all the foodborne Salmonella outbreaks [6]. Salmonella can transmit an egg either from the inside of a chicken (vertical transmission of the pathogen) or from the outside (horizontal transmission from poultry feces) [7].
Although consumption of raw or incompletely cooked food is associated with the risk of salmonellosis, eggs are consumed either raw or cooked [8]. Salmonellosis is most commonly caused by consuming raw egg products such as sauces and spreads produced with raw eggs (e.g., whipped cream and egg butter), sweets created without an adequate cooking process (e.g., tiramisu and chocolate mousse), and drinks containing raw eggs (e.g., eggnog and raw egg high-protein smoothies) [9]. Avoiding undercooked or raw egg products reduces the risk of Salmonella illness [10,11]. As the last line of protection in the food system, consumers’ cooking techniques reduce foodborne infections at home [12].
A quantitative microbial risk assessment (QMRA) can quantify risk levels and provide a basis for food safety. In addition, this assessment evaluates the risk probability of foodborne pathogens in food during the distribution from final products to consumption with cooking at home [13,14]. Changes in Salmonella cell counts by cooking can accurately estimate the Salmonella QMRA. In the present study, the reduction of load of Salmonella pathogens during cooking was examined, as well as the consumption frequency and patterns of egg-based-food in order to assess the risk of Salmonella illness due to the egg consumption. The purpose of this study was to assess the risk of foodborne Salmonella illness due to the consuming of raw and cooked egg samples obtained from the markets in S. Korea.
MATERIALS AND METHODS
To monitor Salmonella in eggs throughout retail markets in S. Korea, 201 samples were collected and analyzed from two retail markets and thirteen traditional markets (four in the capital region, two in the Chungcheong region, three in the Gangwon region, three in the southwest region, and one in the southeast region). The isolation and identification method were used to detect Salmonella as described by ‘Bacteriological test method for eggs’ in the Food code [15]. All of the egg samples were taken aseptically and soaked for 10 s in a disinfectant solution containing 250 mL of Lugol’s solution (an iodine/potassium iodide solution) and 750 mL of 70% alcohol. The purpose of disinfecting the eggshell is to kill microorganisms on the surface of the eggshell in order to check only the internal contamination of the egg samples [16]. Eggs were taken out to dry, and a piece of an egg was broken into 225 mL of buffered peptone water (BPW; Becton Dickinson and Company [BD], Franklin Lakes, NJ, USA) in a sterile filter bag (3M, St. Paul, MN, USA). The homogenates were then incubated at 36 ± 1°C for 18–24 h after being mixed for 60 s using a BagMixer (Interscience, St. Nom, France). The 0.1-mL aliquot of the enriched suspension was placed into 10 mL of Rappaport–Vassiliadis medium (RV; BD) and incubated for 20–24 h at 42°C. One loop of the incubated RV culture was streaked onto Xylose Lysine Deoxycholate (XLD; BD) agar plates, which were then incubated at 37°C for 24 h. 16s rRNA was analyzed identify typical Salmonella black colonies with clear membranes. Salmonella prevalence data (PR) from eggs were fitted to the beta distribution (α, β), where α is the number of positive samples plus one, and β is one plus the number of positive samples subtracted from the total samples [17]. The initial contamination level (CFU/mL) of Salmonella in egg samples was determined using the equation [-LN (1-PR) / mL], originally presented by Sanaa et al. [18].
Twelve poultry-isolated Salmonella strains (FKS001, FKS002, S2, S15, S22, S30, S39, S46, S50, S56, S66, and S72) and two reference strains (S. Typhimurium ATCC 70020 and S. Enteritidis ATCC 13076) were cultured at 37°C for 24 h in 10 mL of tryptic soy broth (TSB; BD). Following the inoculation, 1-mL aliquots of each culture were inoculated into 10 mL of TSB and incubated for 24 h at 37°C. After centrifugation at 1,912×g and 4°C for 15 min, the Salmonella bacteria were washed twice with phosphate buffered saline (PBS; 8.0 g NaCl, 1.5 g NaHPO4, 0.2 g KH2PO4, and 0.2 g KCl in 1 L distilled water, pH 7.4). To obtain 6 Log CFU/mL of Salmonella inoculum, the optical density (OD) of the cell suspensions was adjusted to 2.0 at 600 nm. PBS was used to modify the cell concentrations so that the strains had similar cell counts. The suspensions were then mixed and used as the inoculum.
Due to temperature differences between rinsing water and eggs, Salmonella can penetrate the shell and infect eggs [19,20]. To confirm the penetration of Salmonella into eggs due to the temperature difference, eggs at 42°C, which is the body temperature of poultry, were immersed in 8–9 Log CFU/mL of Salmonella inoculum at 4°C for 1 min and then dried for 30 min. Additionally, 0.1 mL of the inoculum was added to the egg yolks and whites to confirm Salmonella growth. The samples were microbiologically examined after seven days at 15°C. Ten mililiters of 0.1% BPW were put into each infected egg yolk and egg white and pounded for 10 s with a pummeler (BagMixer®, Interscience, St. Nom, France). The homogenates were then serially diluted in 9 mL of 0.1% BPW, and 0.1-mL aliquots were spread-plated on XLD. The XLD plates were incubated at 37°C for 24 h under aerobic conditions.
To develop prediction models of Salmonella in eggs, each egg was directly injected into the egg yolk with 2–3 Log CFU/g of Salmonella inoculum, and the injection holes were sealed. Infected eggs were stored at 7, 15, 25, and 30°C for 4–7 days. In this investigation, the average weight of the egg samples was 52.5 g. To enumerate the Salmonella cells, samples were placed in a sterile filter bag (3M) with 10 mL of 0.1% BPW then pummeled with a pummeler for 60 s. The aliquot (0.1 mL) of the diluted homogenates were spread-plated on XLD agar. The plates were incubated at 37°C for 24 h. Salmonella cell counts were fitted to the Baranyi model [21] using DMfit (Institute of Food Research, Norwich, UK). The Baranyi model was as follows:
The maximal specific growth rate (μmax; Log CFU/g/h) and lag-phase duration (LPD; h) were determined as kinetic parameters. Using the polynomial model, the LPD and values were examined as a function of temperature to develop a secondary model:
where ai is the coefficient value, and T is storage temperature (°C). Additional experiments at 10°C and 20°C assessed the model’s performance. For the observed values, Salmonella cells were counted during storage. The root mean square error (RMSE), bias factor (Bf), and accuracy factor (Af) [22] were calculated to quantify the differences between the observed values and predicted data resulting from the constructed predictive models at 10°C and 20°C.
where n is the total number of data points.
Representative cooking methods for eggs have been investigated in previous studies [23,24]. The conditions of cooking time and temperature according to the cooking method (dry heat [fried], moist heat [boiled, steamed, and poached], and raw [whipping cream and butter cream]) were investigated, and the appropriate or inappropriate cooking times were applied. Salmonella inoculum was put into each egg at 3–4 Log CFU/g to investigate cooking methods’ Salmonella reduction. The whipping cream and butter cream were prepared using raw eggs. Whipping cream is made by mixing egg yolk with milk, while butter cream is prepared by mixing egg white and butter. In this study, the whipping cream and butter cream inoculated with Salmonella were prepared and refrigerated for seven days. Appropriate cooking at dry and moist heat, which completely kills Salmonella inoculated into egg yolk, was performed for at least 1 min after reaching an internal temperature of 74°C [25]. When the internal temperature did not reach 74°C, the eggs were undercooked, and that duration was considered inappropriate cooking time. These effects on the reduction in Salmonella cell counts were included as input variables in the simulation model.
The temperature and time spent transporting, storing, and displaying of eggs in retail markets were obtained through communication with managers in retail markets and from previous studies [26,27]. The 24 h recall data from the 2016 Korea National Health and Nutrition Examination Survey (KNHNES) [28] were used to calculate the daily consumption amounts and ratios of eggs. Using SAS® (Version 9.3, SAS Institute, Cary, NC, USA), the raw data were analyzed. The egg consumption ratio was determined by dividing the total number of survey respondents (7,042 people) by the number of respondents who consumed eggs (4,230 people). @Risk (Palisade, Ithaca, NY, USA) was used to analyze the collected temperature, time, and consumption data to determine proper probabilistic distributions.
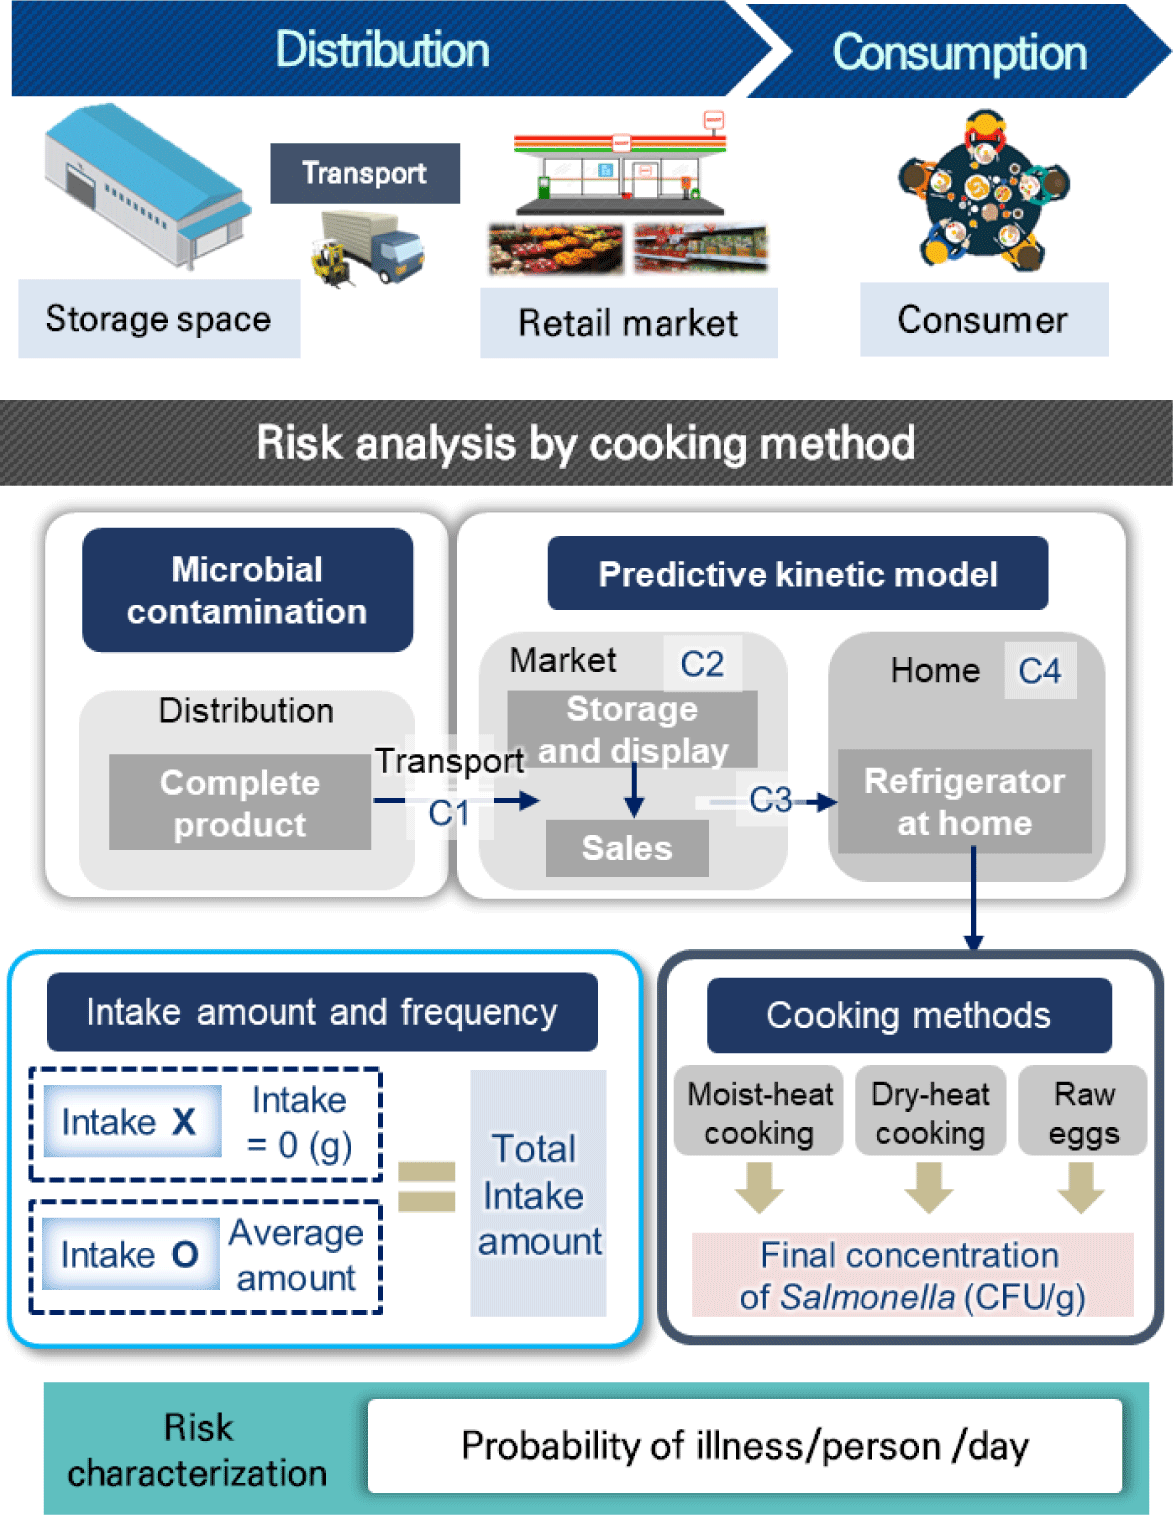
In previous data, we searched for a dose-response model to assess Salmonella exposure after consuming infected eggs. The MRA scenario was constructed according to Fig. 1. The initial Salmonella infection level in eggs, predictive models, probabilistic distributions for time and temperature from markets to homes, probabilistic distribution of consumption data, Salmonella reduction rate by cooking methods, and a dose-response model were used to create a simulation model in Excel® (Microsoft, Seattle, WA, USA). Monte Carlo simulation with @Risk was used to calculate egg-borne Salmonella risk.
RESULTS AND DISCUSSION
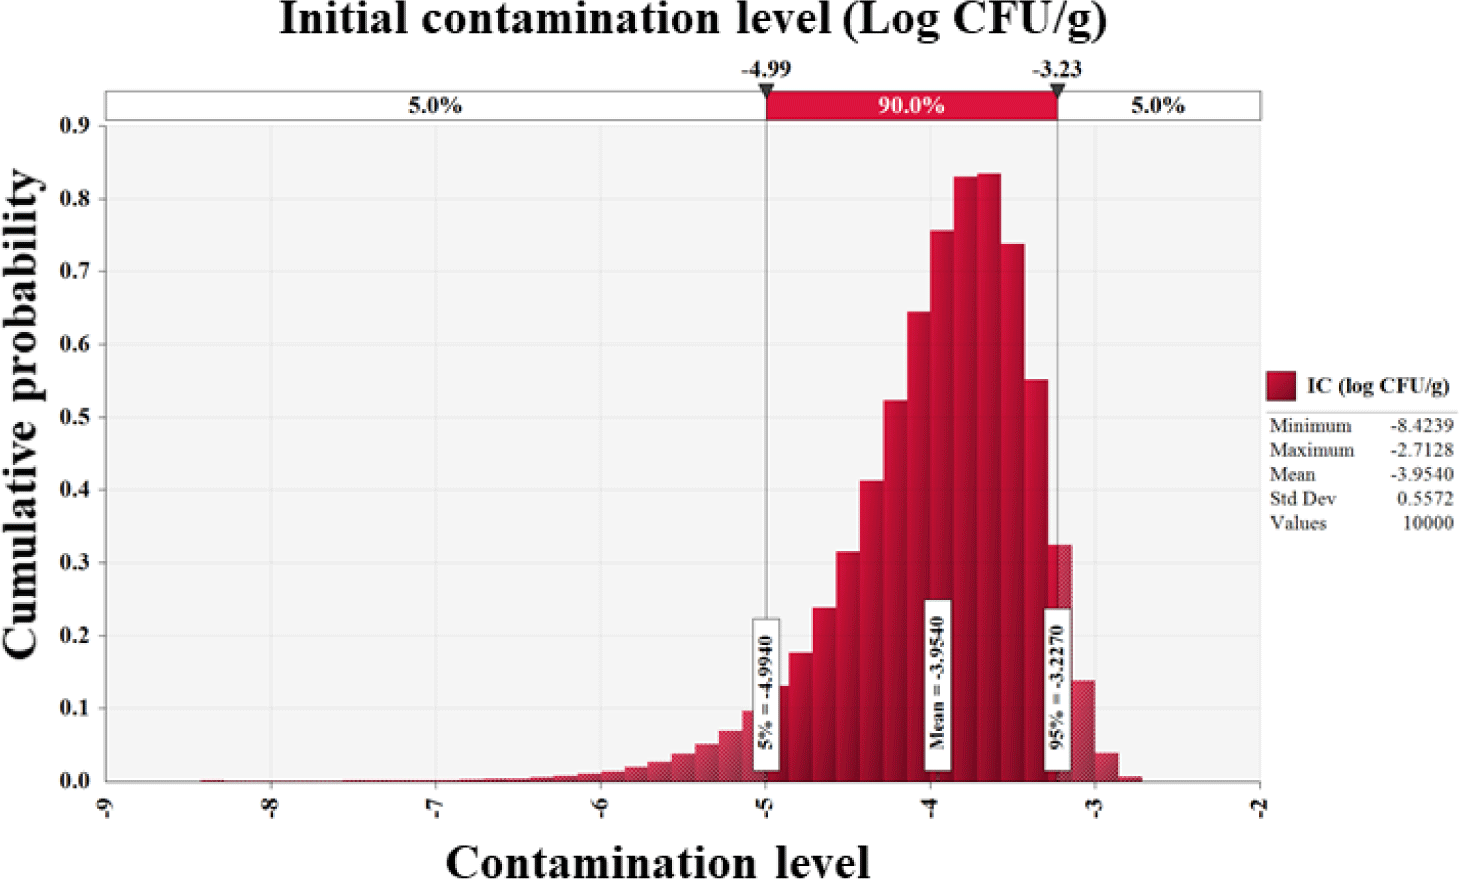
Salmonella cell counts in all 201 egg samples were below the detection limit (0.1 Log CFU/g). Furthermore, Mahdavi et al. [29] found no Salmonella in 525 egg samples, and Safaei et al. [30] identified no Salmonella, Listeria monocytogenes, or Campylobacter jejuni contamination in 100 eggs. Other investigations found 0.1%–1.6% Salmonella infection in commercial eggs [31–33]. Since no Salmonella-positive samples were included in this study, the Beta distribution (RiskBeta [1, 202]) was used to assess the prevalence of Salmonella in eggs. In addition, initial contamination level was determined to be –4.0 Log CFU/g (Fig. 2).
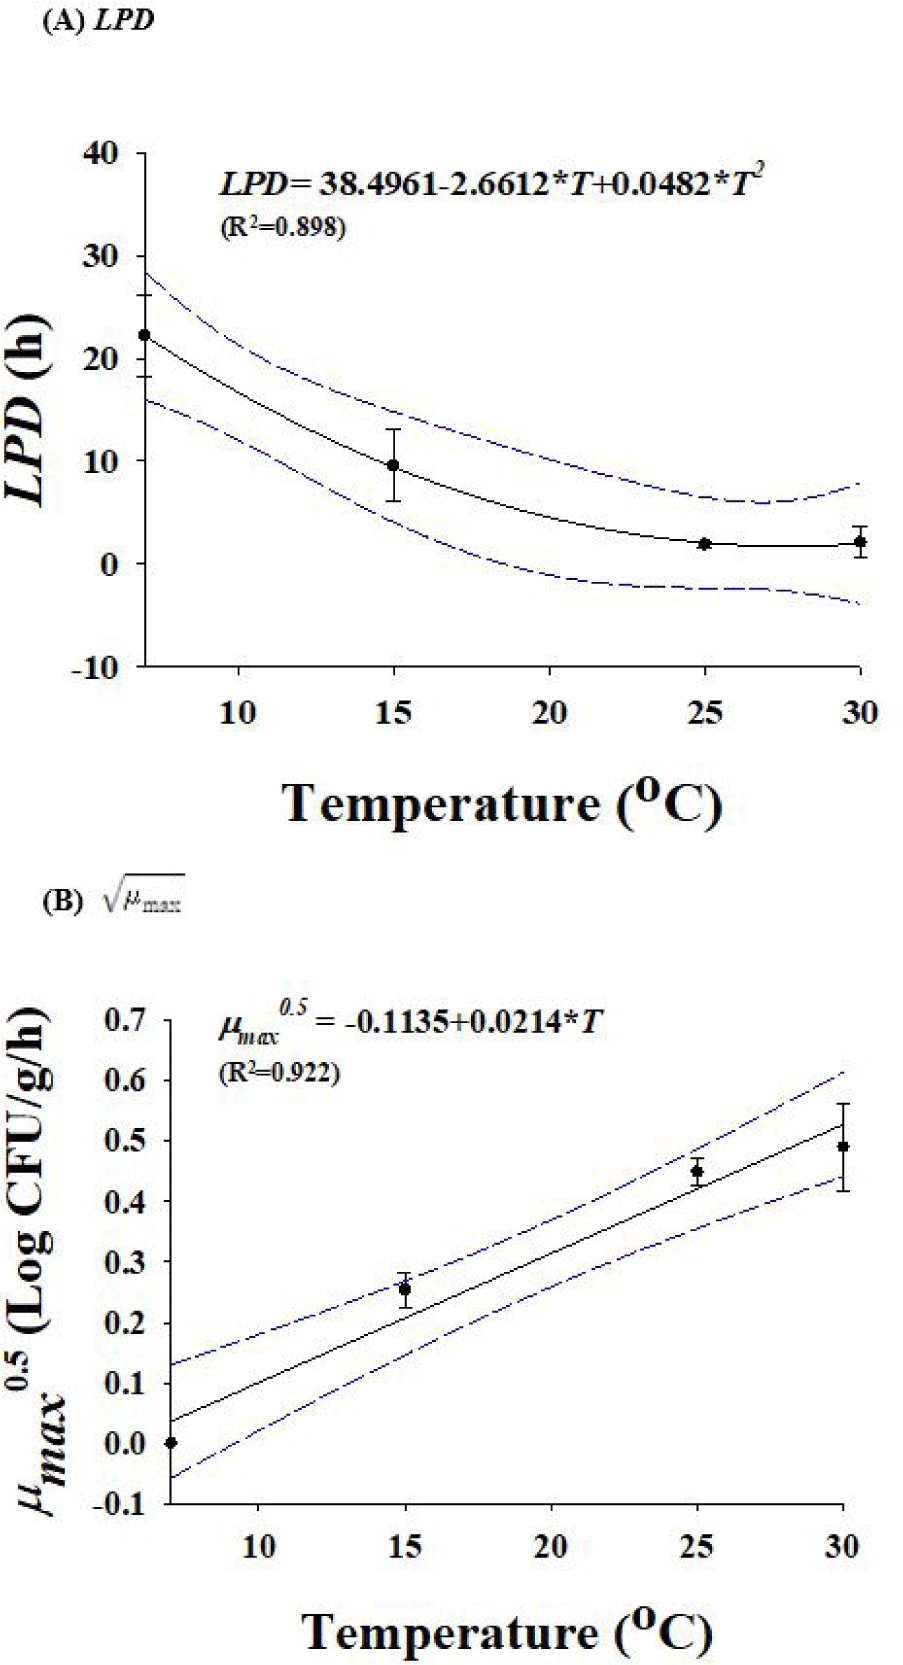
Due to the temperature difference between rinsing water and eggs, Salmonella can enter the shell at rates of almost 2 Log CFU/g. However, the standard rinsing water temperature must be 5°C higher than the egg temperature. If 150 ppm of sodium hypochlorite solution or a disinfectant with equivalent efficacy is used in rinsing water [15], no penetration of Salmonella through the egg shell is observed. When Salmonella cells were inoculated into egg yolk or egg white and stored at 15°C for 7 d, Salmonella cell counts in egg yolk samples increased, but egg whites did not show growth of Salmonella (data not shown). Therefore, egg yolk was selected for development of predictive models. Salmonella-infected eggs were used to develop these models, and they were stored at temperature of 7°C, 15°C, 25°C, and 30°C. The temperature for Salmonella growth is between 10°C to 30°C, however it can survive at 7°C. The primary models were used to obtain the kinetic parameters (LPD and ), which are listed in Table 1. LPDs reduced (p < 0.05) from 22.2 to 2.1 h as the temperature increased (Table 1), demonstrating that Salmonella can grow quickly in eggs when the storage temperature increases. A polynomial model was used to assess the effect of temperature on LPD and values. Fig. 3 illustrates the secondary models. Due to the relatively high R2 values, the secondary models were appropriate for representing the relationship among temperature and LPD (R2=0.898) and (R2 = 0.922) values. In model performance validation, the RMSE values at 10°C and 20°C were 0.176 and 0.294, respectively. Bf and Af were respectively 0.97 and 1.07 at 10°C, and 0.98 and 1.06 at 20°C. These findings suggested that the developed models were suitable for predicting the number of Salmonella cells in eggs during storage.
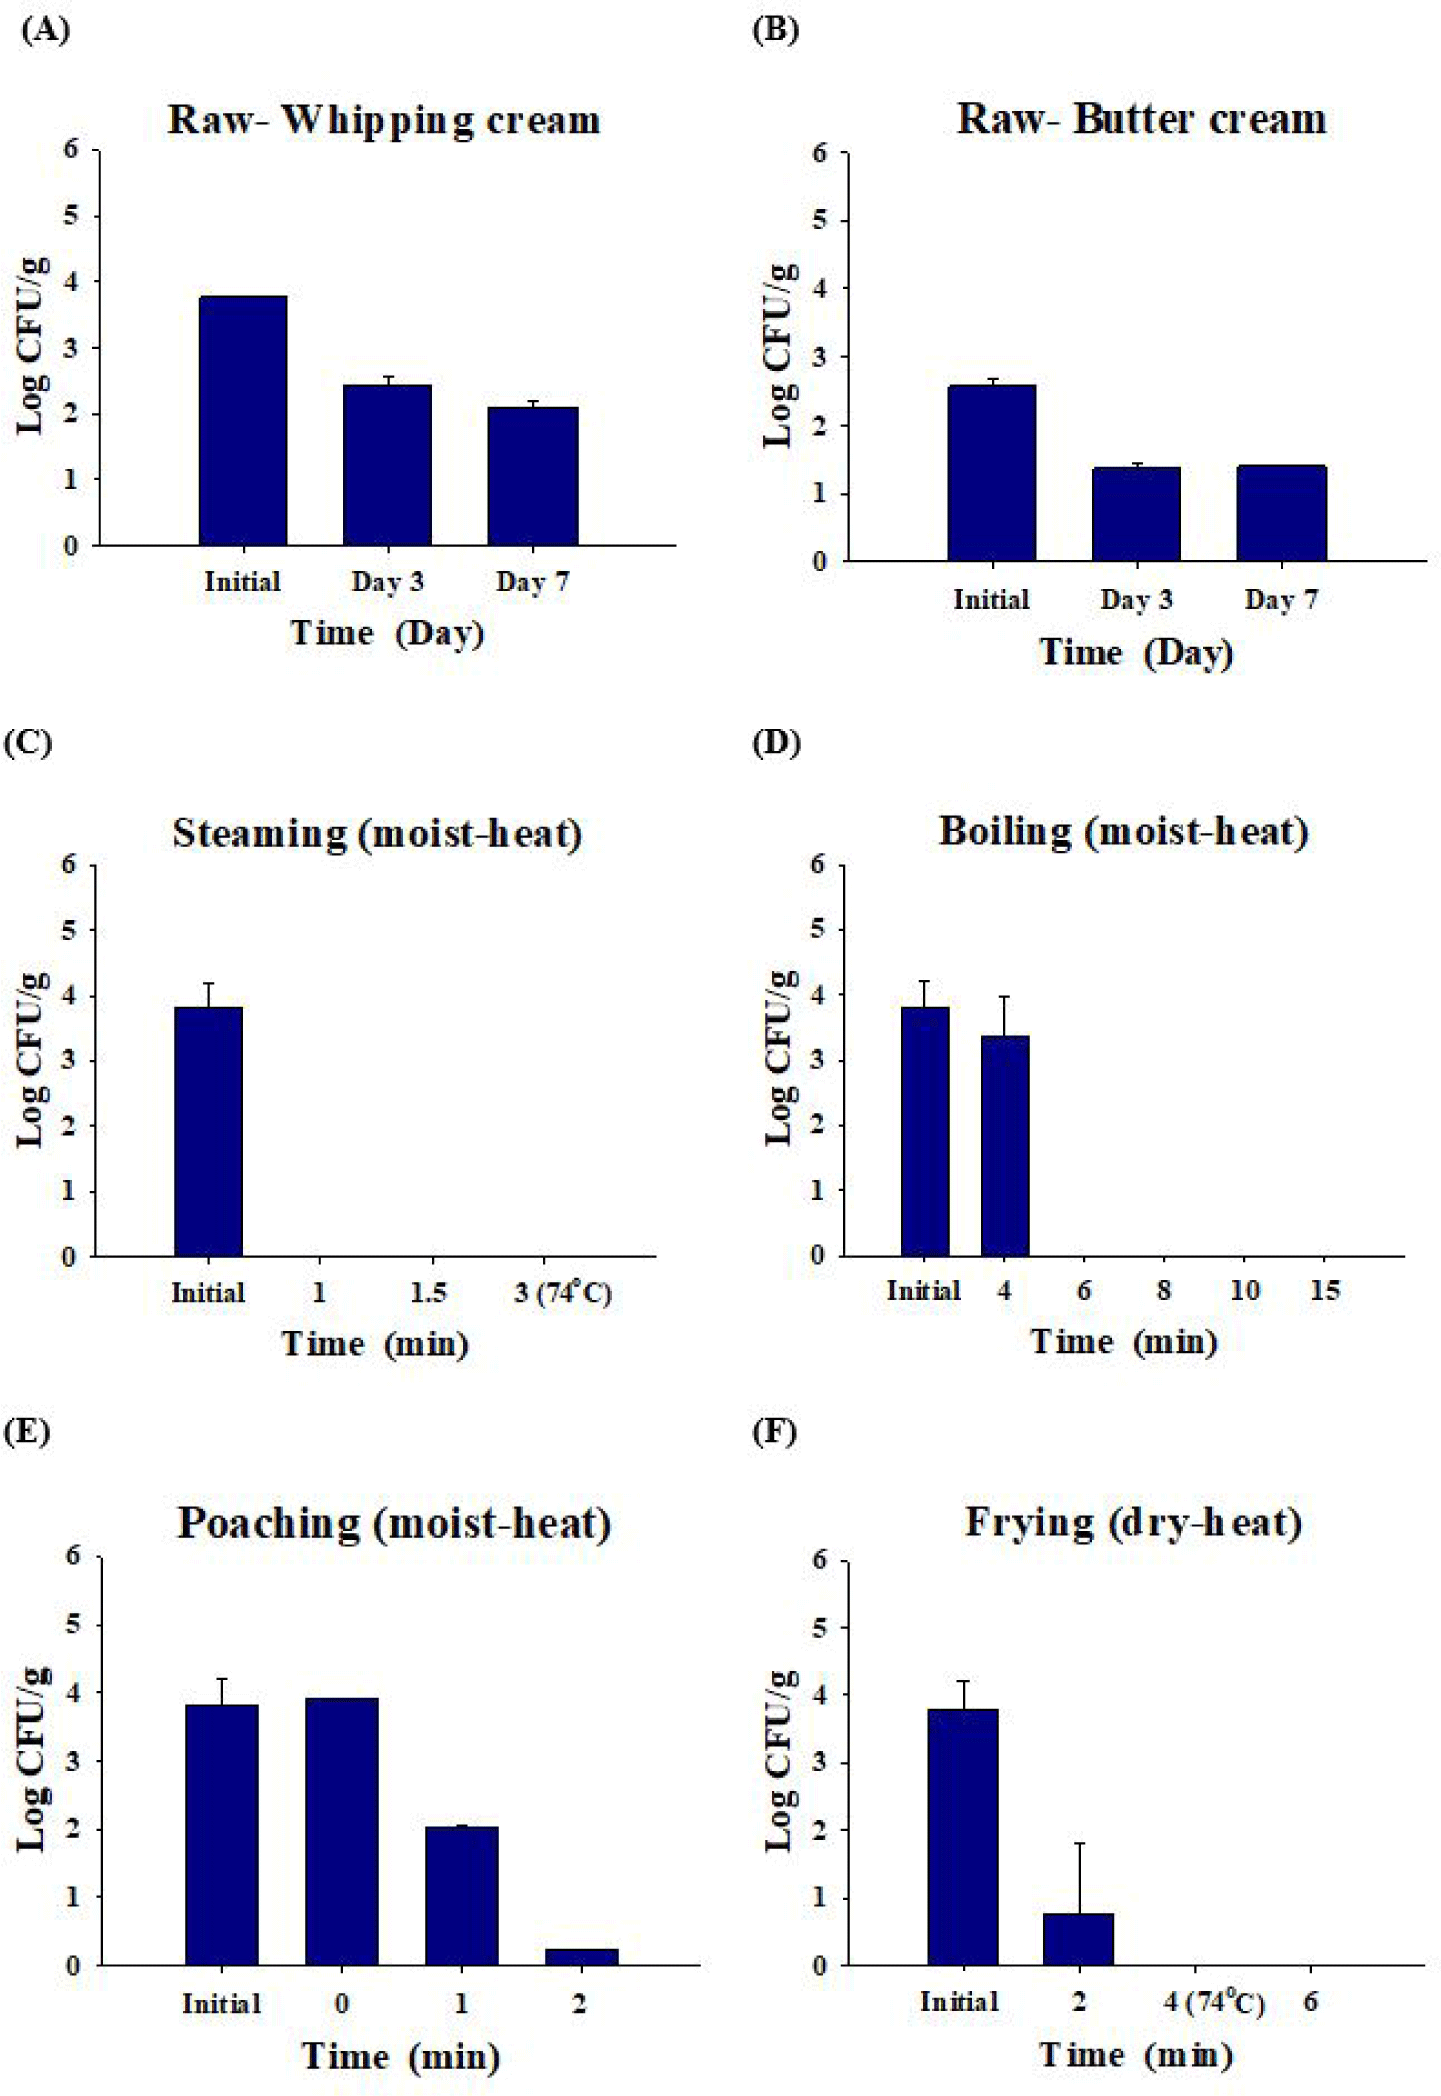
Salmonella decreased by 2.1 ± 0.1 Log CFU/g in whipping cream and by 1.4 ± 0.0 Log CFU/g in butter cream after seven days (Figs. 4A and 4B). When the Salmonella-inoculated (3.8 ± 0.4 Log CFU/g) eggs were steamed, Salmonella was not detected for 1 min (Fig. 4C). When Salmonella-inoculated (3.8 ± 0.4 Log CFU/g) eggs were boiled, Salmonella was not detected after 6 min. When eggs were boiled for 4 min, only the surface of the egg yolk was cooked. Thus, Salmonella remained and was detected when the egg yolk was cooked for 4 min or less (Fig. 4D). Poached eggs are eaten by pouring hot broth into the eggs and cooking them slightly. Although hot broth (100°C) was poured, 0.2 Log CFU/g of Salmonella was detected after 2 min in poached eggs that were not sufficiently cooked without additional cooking (Fig. 4E). When contaminated eggs (3.8 ± 0.4 Log CFU/g) were fried, Salmonella was decreased 99.5% and detected at 0.8 ± 0.1 Log CFU/g until 2 min, and Salmonella was completely dead after 4 min (complete cooking condition; Fig. 4F).
Pert distribution (0.5, 4, and 9) was used to create a probabilistic distribution for egg transportation from manufacturing plants to the market, which was estimated to take 4 h with a minimum of 30 min and a maximum of 9 h. Park and Bahk [26] reported 2.12°C and 12.54°C minimum and maximum temperatures during transit to the market. Therefore, the transit temperature was fitted to the Uniform distribution (2.12, 12.54) to derive the probability distribution (Table 2). After being transported to the market, eggs were stored at 0°C–15°C (often at 4°C) for 0–24 h, using the Pert distribution (0, 4, 15) for storage temperature and the Uniform distribution (0, 24) for storage duration. The Uniform distribution was fitted using the parameters (0, 72) after the eggs were displayed at the market for 0–72 h. Eggs were refrigerated and stored at 0°C–15°C in S. Korea [15]. To derive the probabilistic distribution for the market display, the Uniform distribution (0, 15) was used (Table 2). Jung [27] reported that the market-to-home commuting duration and temperature ranged from 10°C to 25°C and 0.325 to 1.643 h, respectively. The calculated average transport temperature was 18°C. Thus, the Pert distribution (10, 18, 25) was used to model the transport temperature, while the Uniform distribution (0.325, 1.643) was used to model the transit duration (Table 2). Additionally, the data for at-home storage duration was fitted to the Uniform distribution (0, 540) because eggs were consumed within 540 h (about 3 weeks of shelf life). The temperature of eggs was calculated using the Loglogistic distribution (–29.283, 33.227, 26.666, RiskTruncate [–5, 10]) in relation to the temperature of household refrigerators, as described by Lee et al. [34] (Table 2).
| Input model | Unit | Variable | Formula | Reference |
|---|---|---|---|---|
| Product | ||||
| Pathogens contamination level | ||||
| Salmonella prevalence | PR | = RiskBeta (1,202) | This research; [17] | |
| Initial contamination level | CFU/g | C | = − LN (1 − PR) / 25g | [18] |
| Log CFU/g | IC | = Log(C) | ||
| Transportation | ||||
| Transportation | ||||
| Transportation time | h | Timetrans | = RiskPert (0.5,4,9) | Personal communication1); This research |
| Food temperature during transportation | °C | Temptrans | = RiskUniform (2.12,12.54) | [26] |
| Growth | ||||
| h0 | = Average (LPD × growth rate), Fixed 0.3198 | This research; [21] | ||
| Log CFU/g | Y0 | = Average (Y0i), Fixed 2.2 | This research; [21] | |
| Log CFU/g | Yend | = Average (Yendi), Fixed 6.5 | This research; [21] | |
| ln(q) | = LN (1 / (EXP (h0) − 1)) | This research; [21] | ||
| Growth rate | Log CFU/g/h | GRtrans | = IF (Temptrans > 5.30841, (0.0214 × (Temptrans − 5.30841))2, 0) | This research; [21] |
| Salmonella growth | Log CFU/g | C1 | = IC + 1 / (1 + EXP ( − ln(q))) × (1− (10−|Y0-Yend|/LN(10))) × GRtrans × Timetrans | This research; [21] |
| Market | ||||
| Market storage | ||||
| Storage time | h | TimeMark-st | = RiskUniform (0,24) |
Personal communication; This research |
| Food temperature during storage | °C | TempMark-st | = RiskPert (0,4,15) | Personal communication; This research |
| Growth | ||||
| h0 | = Average (LPD × growth rate), Fixed 0.3198 | This research; [21] | ||
| Log CFU/g | Y0 | = Average (Y0i), Fixed 2.2 | This research; [21] | |
| Log CFU/g | Yend | = Average (Yendi), Fixed 6.5 | This research; [21] | |
| ln(q) | = LN (1 / (EXP (h0) −1)) | This research; [21] | ||
| Growth rate | Log CFU/g/h | GRMark-st | = IF (TempMark-st > 5.30841, (0.0214 × (TempMark-st − 5.30841))2, 0) | This research; [21] |
| Salmonella growth | Log CFU/g | C2 | = C1 + 1 / (1 + EXP (−ln (q))) × (1 − (10−|Y0-Yend|/ LN(10))) × GRMark-st × TimeMark-st | This research; [21] |
| Market display | ||||
| Display time | h | TimeMark-dis | = RiskUniform (0,72) | Personal communication; This research |
| Food temperature during display | °C | TempMark-dis | = RiskUniform (0,15) | Personal communication; This research |
| Growth | ||||
| h0 | = Average (LPD × growth rate), Fixed 0.3198 | This research; [21] | ||
| Log CFU/g | Y0 | = Average (Y0i), Fixed 2.2 | This research; [21] | |
| Log CFU/g | Yend | = Average (Yendi), Fixed 6.5 | This research; [21] | |
| ln(q) | = LN (1 / (EXP (h0) −1)) | This research; [21] | ||
| Growth rate | Log CFU/g/h | GRMark-dis | = IF (TempMark-dis > 5.30841, (0.0214 × (TempMark-dis − 5.30841))2, 0) | This research; [21] |
| Salmonella growth | Log CFU/g | C3 | = C2 + 1 / (1 + EXP (−ln (q))) × (1 − (10−|Y0-Yend|/ LN (10))) × GRMark-dis × TimeMark-dis | This research; [21] |
| Transportation (vehicle) | ||||
| Transportation | ||||
| Transportation time | h | TimeVeh | = RiskUniform (0.325,1.643) | [27] |
| Food temperature during storage | °C | TempVeh | = RiskPer t(10,18,25) | [27] |
| Growth | ||||
| h0 | = Average (LPD × growth rate), Fixed 0.3198 | This research; [21] | ||
| Log CFU/g | Y0 | = Average (Y0i), Fixed 2.2 | This research; [21] | |
| Log CFU/g | Yend | = Average (Yendi), Fixed 6.5 | This research; [21] | |
| ln(q) | = LN (1 / (EXP (h0) −1)) | This research; [21] | ||
| Growth rate | Log CFU/g/h | GRVeh | = IF(TempVeh > 5.30841, (0.0214 × (TempVeh-5.30841))2, 0) | This research; [21] |
| Salmonella growth | Log CFU/g | C4 | = C3 + 1/(1 + EXP(-ln(q))) × (1− (10−|Y0-Yend|/ LN(10))) × GRVeh × TimeVeh | This research; [21] |
| Home | ||||
| Home storage | ||||
| Storage time | h | TimeHome | = RiskUniform (0,540) | Personal communication; This research |
| Food temperature during storage | °C | TempHome | = RiskLogLogistic (−29.283,33.227,26.666,Risktruncate (−5,10)) | [33] |
| Growth | ||||
| h0 | = Average (LPD × growth rate), Fixed 0.3198 | This research; [21] | ||
| Log CFU/g | Y0 | = Average (Y0i), Fixed 2.2 | This research; [21] | |
| Log CFU/g | Yend | = Average (Yendi), Fixed 6.5 | This research; [21] | |
| ln(q) | = LN (1 / (EXP (h0) −1)) | This research; [21] | ||
| Growth rate | Log CFU/g/h | GRHome | = IF(TempHome > 5.30841, (0.0214 × (TempHome−5.30841))2, 0) | This research; [21] |
| Salmonella growth | Log CFU/g | C5 | = C4 + 1 / (1 + EXP (−ln (q))) × (1− (10−|Y0-Yend|/ LN (10))) × GRHome × TimeHome | This research; [21] |
| CFU/g | C5CFU/g | = 10C5 | ||
| Consumption | ||||
| Daily consumption frequency for eggs | % | ConRatio | Fixed 60.1 | [28] |
| CR(0) | = 1 − (60.1/100) | [28] | ||
| CR(1) | = 60.1 / 100 | [28] | ||
| CR | = RiskDiscrete ({0,1},{CR(0),CR(1)}) | [28] | ||
| Cooking method | ||||
| Dry heat cooking | Cook(dry) | = 57.5/100 | [28] | |
| Moist heat cooking | Cook(moist) | = 41/100 | [28] | |
| Raw (uncooked) | Cook(raw) | = 1.5/100 | [28] | |
| Cook | = RiskDiscrete ({1,2,3}, {Cook (dry), Cook (moist), Cook (raw)}) | |||
| Consumption by dry heat cooking | g | Consumpdry-cook | = RiskExpon (42.896,RiskShift (0.065791), RiskTruncate (0.08,360)) | This research; [28] |
| Consumption by moist heat cooking | g | Consumpmoist-cook | = RiskExpon (36.061, RiskShift (−0.016726), RiskTruncate (0,340)) | This research; [28] |
| Consumption by raw | g | Consumpraw | = RiskWeibull (1.2556,41.992, RiskShift (0.067782), RiskTruncate (0.32,153.9)) | This research; [28] |
| g | Consump | = IF (Cook = 1, Consumpdry-cook, IF (Cook = 2,Consumpmoist-cook, IF (Cook = 3,Consumpraw))) | ||
| Total consumption | g | Amount | = IF (CR = 0,0,Consump) | |
| Reduction | ||||
| Dry heat cooking | Reduce(dry) | = 57.5 / 100 | [28] | |
| Moist heat cooking | Reduce(moist) | = 41 / 100 | [28] | |
| Raw (uncooked) | Reduce(raw) | = 1.5 / 100 | [28] | |
| Reduce | = RiskDiscrete ({1,2,3}, {Reduce (dry), Reduce (moist), Reduce (raw)}) | |||
| Reduce(dry) -dry heat cooking | ||||
| Cooking time | h | Timedry-cook | = RiskPert (0.03,0.07,0.1) | This research |
| Food temperature during cooking | °C | Tempdry-cook | = RiskPert (74 × 0.8,74,74 × 1.2) | This research; [14] |
| CFU/g | Reducedry-cook | = IF (AND (Tempdry-cook > 74,Timedry-cook > 0.07), 0, C5CFU/g × 0.01) | ||
| Reduce(moist) -moist heat cooking | ||||
| Cooking time | h | Timemoist-cook | = RiskPert (0.03,0.07,0.25) | This research |
| Food temperature during cooking | °C | Tempmoist-cook | = RiskPert (74 × 0.8,74,74 × 1.2) | This research; [14] |
| CFU/g | Reducemoist-cook | = IF (AND (Tempmoist-cook > 74,Timemoist-cook > 0.07), 0, C5CFU/g × 0.01) | ||
| Reduce(raw) –raw | ||||
| Cooking time | h | Timeraw | = RiskPert (0,0.02,0.03) | This research; |
| Food temperature during cooking | °C | Tempraw | = RiskUniform (0,60) | This research; |
| CFU/g | Reduceraw | = IF (AND (Tempraw > 50, Timeraw > 0.02), 0, C5CFU/g × 0.01) | ||
| CFU/g | Reduction | = IF (Reduce = 1, Reducedry-cook, IF (Reduce = 2, Reducemoist-cook, IF (Reduce = 3, Reduceraw))) | ||
| Final concentration | CFU/g | C6 (Cooked) | = IF (CR = 0,0,Reduction) | This research |
| Dose-Response | ||||
| Salmonella amount | CFU | D | = C6 × Amount | |
| Parameter of Beta Poisson | α | Fixed, 0.89 | [35] | |
| β | Fixed, 4.4 × 10⁵ | [35] | ||
| Risk | ||||
| Probability of illness/person/day | Risk | = 1 − (1 + D / β) − α | [35] | |
The KNHNES [28] raw data on daily egg consumption levels were fitted to @Risk program. In S. Korea, the average daily consumption of raw eggs (consumed without additional cooking) was 39.2 g, with a consumption frequency of 1.5%. The Weibull distribution (RiskWeibull [1.2556, 41.992, RiskShift [0.067782]]) was found to be appropriate for the consumption of raw eggs. The average daily consumption of eggs by dry-heat cooking was 43.0 g by Exponential distribution (RiskExpon [42.896, RiskShift [0.065791]]) at 57.5% frequency. In addition, the average consumption of eggs by moist-heat cooking was 36.1 g by Exponential distribution (RiskExpon [36.061, RiskShift [–0.016726]]) at 41% frequency. This data indicates that the majority of S. Koreans consume eggs daily; nonetheless, the raw egg intake is very low. These results were used to calculate the final contamination level of Salmonella based on the ratio of intake patterns, according to the cooking method and the decreased amount of Salmonella after cooking (Table 2).
The Beta Poisson model [1 − (1 + D / β)−α] evaluated foodborne Salmonella illness after egg consumption by cooking method. Teunis et al. [35] created α = 0.89 and β = 4.4 × 10⁵, where D is the number of viable Salmonella consumed and D (CFU) is determined as Salmonella cell count (CFU/g) × consumption amount (g).
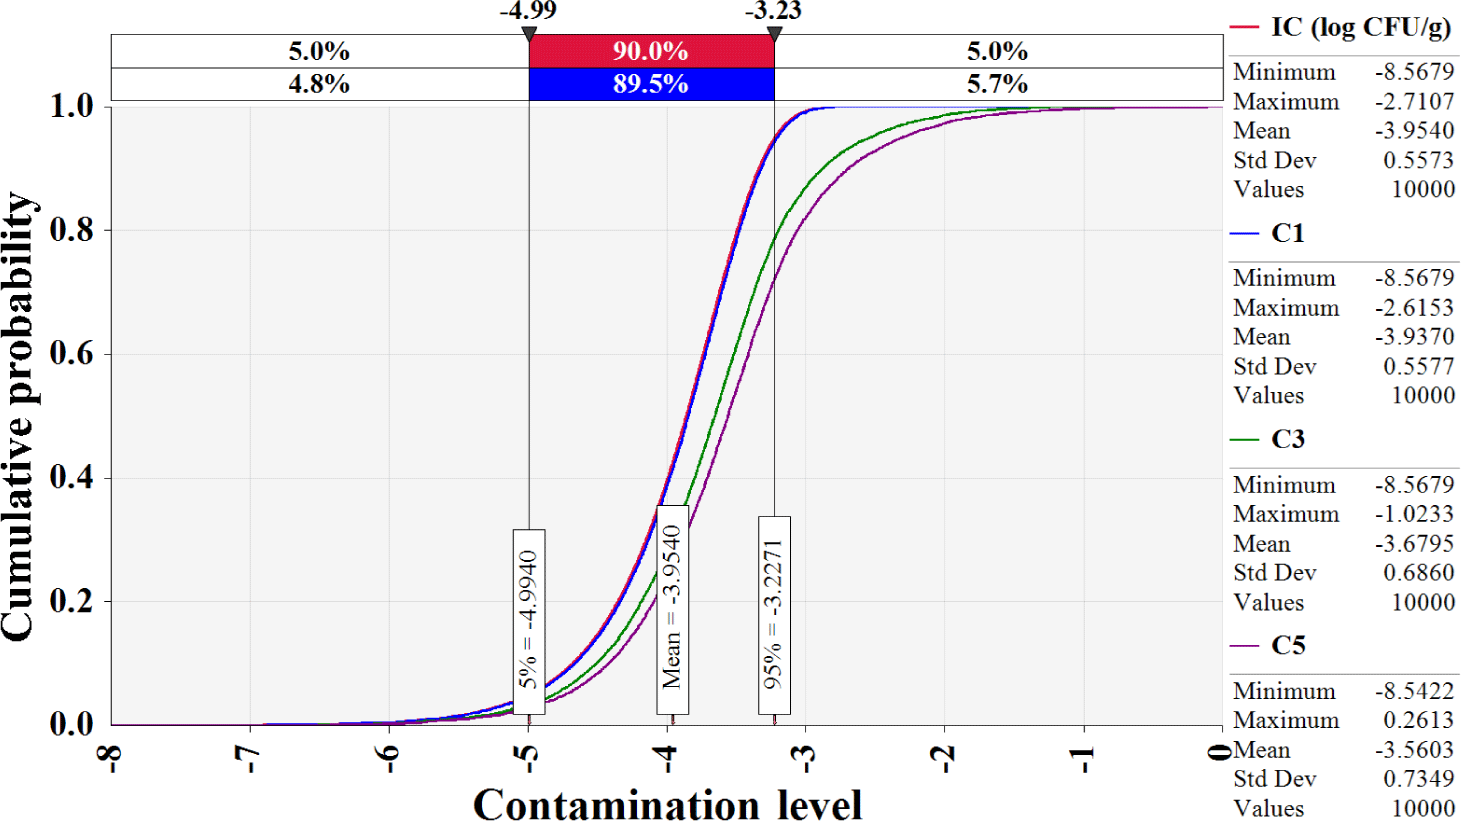
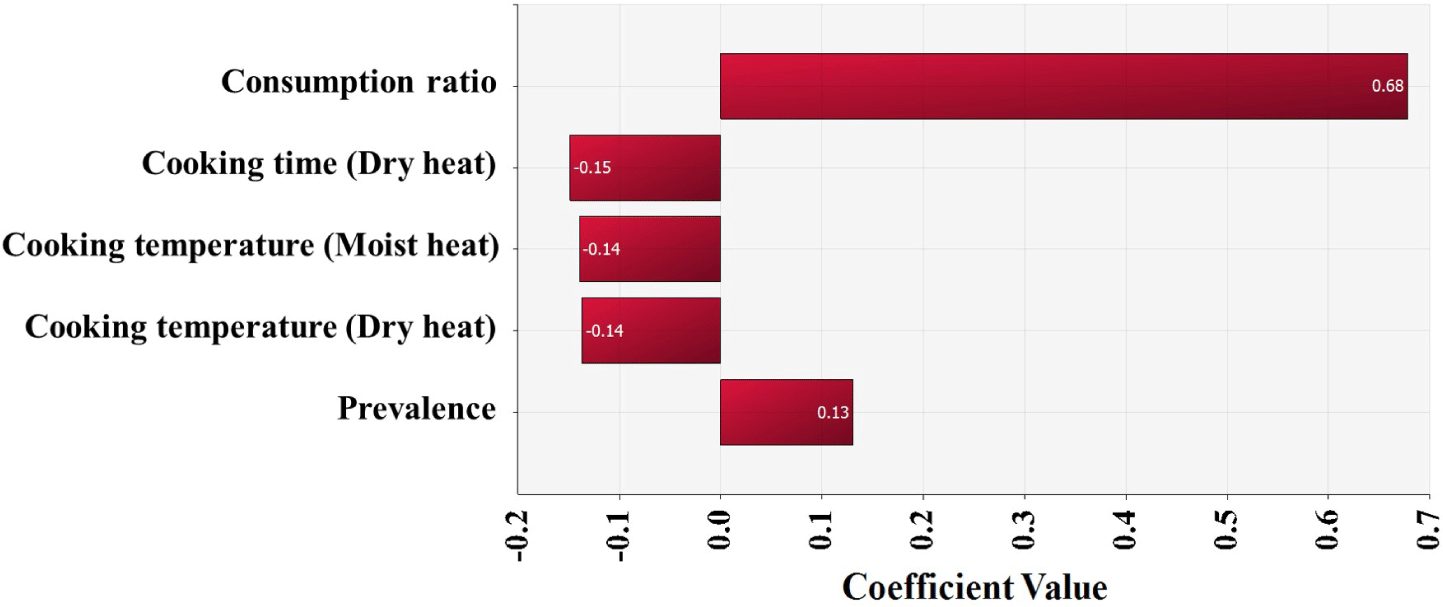
The simulation model was developed using the estimated Salmonella contamination level, predictive models simulating Salmonella cell counts with probabilistic distributions of temperature and time, probabilistic distributions of consumption amounts, consumption frequency, reduction by cooking, and a dose-response model, as shown in Table 2. Salmonella cell counts were predicted to have increased gradually from initial contamination (IC; –4.0 Log CFU/g) to home storage (C5; –3.6 Log CFU/g) using the cumulative density calculated by this simulation (Fig. 5). Salmonella cell counts increased significantly during market display (C3; –3.7 Log CFU/g) as a result of eggs being sold at 25°C. The simulation showed that in S. Korea, the daily risk of Salmonella infection per person per day from consuming cooked eggs was estimated at 6.8 × 10⁻¹⁰ (Table 3). The simulation that did not include cooking procedures revealed that the risk of Salmonella infection from egg consumption in S. Korea was 1.9 × 10⁻⁷ (2.8 × 10²-fold increase) (Table 3). When fitted without cooking procedures, the risk of foodborne Salmonella disease is predicted to be higher. Most people in S. Korea consume eggs that have been cooked in the form of egg rolls, braised eggs, and egg drop soups. Thus, the scenario in which the cooking methods were used was determined to be more realistic and accurate when evaluating the risk of foodborne Salmonella disease from egg consumption. Furthermore, raising the raw consumption ratio increased the probability of foodborne Salmonella disease compared to the baseline scenario (Table 3). When the ratio of raw egg intake was increased to 33%, the probability of foodborne Salmonella disease increased 1.6-fold over the baseline prediction (Table 3). When the raw egg consumption ratio was increased to 50%, the probability of foodborne Salmonella disease increased by 1.9- to 3.7-fold (Table 3). Consuming uncooked Salmonella-contaminated eggs increase the risk of foodborne Salmonella outbreaks. In addition, higher consumption frequency and prevalence increased the risk of foodborne Salmonella disease, while increased cooking time and temperature reduced the risk (Fig. 6).
CONCLUSION
In conclusion, it appears that the risk of foodborne Salmonella disease due to egg consumption in S. Korea is low. In the retail market, Salmonella prevalence in eggs is low, and disinfection procedures may reduce or eliminate the risks of contamination by Salmonella in the manufacturing step. However, the risk of foodborne Salmonella outbreaks increases, if eggs contaminated with Salmonella are not cooked. Consequently, consumption of raw eggs was the most influential input factor in risk estimations. Although this QMRA used insufficient data evaluated under certain assumptions, the risk of foodborne Salmonella illness can be re-estimated when additional data are collected.