
INTRODUCTION
Yeonsan Ogye (YO), a traditional chicken breed in Korea, is designated as Natural Monument No. 265. The YO breed is characterized by distinct physical features, including black feathers, skin, pupils, and bones [1]. For conservation purposes, the YO breed maintained a population of over 1,000 individuals and selected the parent stocks every year without pedigree information. Selection is solely based on external black phenotypic traits, regardless of genetic diversity and inbreeding rates [2]. However, pedigree information is crucial to manage and control inbreeding among individuals, especially for conserved breeds such as the YO [3]. Therefore, a distinct breeding system is needed to prevent potential future inbreeding depression and preserve genetic diversity.
Inbreeding is the mating of related individuals, which increases allele homozygosity in a population and causes inbreeding depression. Inbreeding depression increases the potential for recessive genetic diseases and affects livestock productivity. An inbreeding coefficient, a measure used to estimate inbreeding [4], is defined as the probability that two homozygous alleles in an individual are the same allele derived from a common ancestor (i.e., the probability of identical by descent [IBD]). Traditionally, inbreeding coefficients are calculated using pedigree information [5]. When pedigree information is unavailable, an inbreeding coefficient can be obtained via molecular genetic information using a single nucleotide polymorphism (SNP) array [6]. One of the methods using SNP chip information to measure the level of IBD in livestock is measuring the proportion of runs of homozygosity (ROHs) in the genome [7].
ROH is a contiguous diploid homozygous segment in the genome that is not interrupted by heterozygous alleles [8]. Considering that DNA fragments separate during genomic recombination, the likelihood that long homozygous DNA sequences remain contiguous decreases over generations [9]. Therefore, long ROHs often indicate recent consanguineous mating, whereas short ROHs presumably originated from more distant common ancestors [7]. The inbreeding coefficient based on ROHs (FROH) can be used to estimate the degree of inbreeding and genetic relatedness among individuals, enabling assessment of the actual level of autozygosity in livestock [10,11]. Additionally, some ROH characteristics in a population, such as the average ROH length, average number of ROHs, and ROH distribution across the chromosomes, can be used as indicators of various genetic phenomena [11]. ROHs tend to occur in substantial proportions within specific chromosomal regions because of reduced haplotype diversity. These regions, known as ROH islands [7], are used to identify portions of the genome that have undergone selective pressure and are associated with beneficial traits or adaptations [7,10,11].
In this study, we used ROH analysis to assess genomic inbreeding and genetic characteristics in the YO population. We confirmed correlations between inbreeding coefficients obtained via ROH analysis and other inbreeding coefficients. Furthermore, we identified features of specific genomic regions with many ROHs in the population.
MATERIALS AND METHODS
This study examined 189 YO chickens. The selected samples were parent stocks used in 2018. Genomic DNA (gDNA) was extracted from chicken blood using PrimePrep™ Genomic DNA Isolation kits (GeNetBio, Daejeon, Korea). The concentration and purity of the isolated gDNA were measured using a NanoDrop2000c spectrophotometer (Thermo Fisher Scientific, Waltham, MA, USA). The extracted gDNA was stored at –20°C until use.
gDNA samples were genotyped by using the 600K Affymetrix Axiom Chicken SNP panel (Affymetrix, Santa Clara, CA, USA), which revealed 546,137 SNPs. For greater accuracy in subsequent analyses, a quality control (QC) procedure was performed using PLINK v.1.9 [12]. Using the “--geno” option, 5,385 SNPs with a calling rate of < 90% were excluded; 5,056 SNPs with Hardy–Weinberg equilibrium test p-values < 10-6 were excluded using the “--hwe” option. The “--maf” option, filtering option using minor allele frequency (MAF), was not used for ROH analysis [13]. As a result, 535,696 SNPs were analyzed.
ROH analysis of the YO population was conducted using the “--homozyg” option of PLINK v.1.9, which uses a sliding window method that continuously scans an individual’s SNP data to identify homozygous regions. The parameter settings have a substantial impact on ROH analysis. However, the default parameter values provided by PLINK may be suboptimal because they depend on factors such as the SNP array density and genomic characteristics of the samples undergoing analysis. As noted by Meyermans et al. [13], this issue can be addressed by choosing a method to determine appropriate parameter values. In this study, we followed the approaches recommended by Gorrsen et al. [14] and Meyermans et al. [13] to determine parameter values used for ROH analysis (Table 1).
The minimum number of SNPs in ROHs (--homozyg-snp) was calculated using formula (1) [10].
where L is the number of consecutive SNPs constituting an ROH, ns is the number of SNPs, ni is the number of individuals, a is the false positive rate of ROHs (set to 0.05), and is the average heterozygosity of all SNPs in the population. The average heterozygosity of the YO was determined using the “--hardy” option of PLINK v.1.9. The size of the sliding window was also set to L [13]. The minimum number of heterozygotes in the sliding window (--homozyg-window-het) and minimum number of missing SNPs in the sliding window (--homozyg-window-missing) were set to 1 and 3, respectively [11].
The maximum gap between SNPs (--homozyg-gap) in an ROH was calculated using the genome coverage proposed by Meyermans et al. [13]. The method for determining gap size based on genome coverage initially involved the artificial generation of an individual in which all SNPs were homozygous. Subsequently, by modifying a specific parameter, the ratio of the total length of detected ROHs in the completely homozygous sample to the length of the autosomal genome was calculated. For an artificially created completely homozygous organism, the entire genome represented a single ROH, and genome coverage referred to the maximum detectable coverage achievable using the same parameter value [13]. To generate completely homozygous individuals, a bim (PLINK extension map) file containing SNP information was used to extract the major alleles. Genome coverage was calculated by varying the maximum gap parameter between SNPs from 1 to 300; other parameters were kept constant with the values shown in Table 1.
The minimum ROH length (--homozyg-kb) was set to 500 kb. This is the minimum length that can be obtained at a density of 600K SNPs without the inclusion of very short ROHs generated by linkage disequilibrium [15]. Other parameters were set to the default values in PLINK. To investigate the genomic characteristics of the YO population using ROHs, the total number and total length of each ROH, as well as the average ROH length, were obtained using the “detectRUNS” package in R [16]. Additionally, the identified ROHs were categorized into five length classes: 0.5–2, 2–4, 4–8, 8–16, and > 16 Mb [15].
Four different methods were used to calculate the inbreeding coefficient of the YO population. The first is the FROH, calculated using formula (2) [16].
where is the length of all ROHs in an individual and LAuto is the length of the autosomal genome [17]. FROH was calculated using the “detectRUNS” package in R [17].
The second is the inbreeding coefficient based on homozygous SNPs, calculated using formula (3) [18].
where O is the number of observed homozygous SNPs, E is the number of expected homozygous SNPs, and L is the total number of SNPs in an individual.
The third is the inbreeding coefficient [19] based on diagonal elements of the genomic relationship matrix (GRM), calculated using formula (4) [19].
where xi is the number of reference alleles of the ith SNP, m is the total number of SNPs, and pi is the frequency of the reference allele.
The fourth is the inbreeding coefficient calculated based on the correlation of gametes, calculated using formula (5) [18].
where xi is the number of reference alleles of the ith SNP, and pi is the frequency of the reference allele.
FHOM, FGRM, and FUNI were calculated using the “--ibc” option of genome-wide complex trait analysis (GCTA) [18]. Pearson correlation coefficients were calculated to determine correlations among the four calculated inbreeding coefficients, using the “ggpbur” package in R.
The percentage of SNPs located in an ROH region was calculated to identify ROH islands, regions where individuals in a group have common ROHs. The percentages were calculated through the division of the number of corresponding SNPs present in the ROHs of individuals by the total number of individuals. Among the SNPs present in ROHs, the top 1% of SNPs was set as the threshold; a series of adjacent SNPs over the threshold was designated as an ROH island [20]. To search for genes in ROH islands, candidate genes associated with SNPs were annotated using the chicken SNP annotation information (GRCg6a.103) in BioMart [21]. Quantitative trait loci (QTLs) present in ROH islands were identified using the “GALLO” package in R [22]. QTL analysis was performed based on GRCg6a gff (genome annotation file) file information in the QTL database [23].
RESULTS
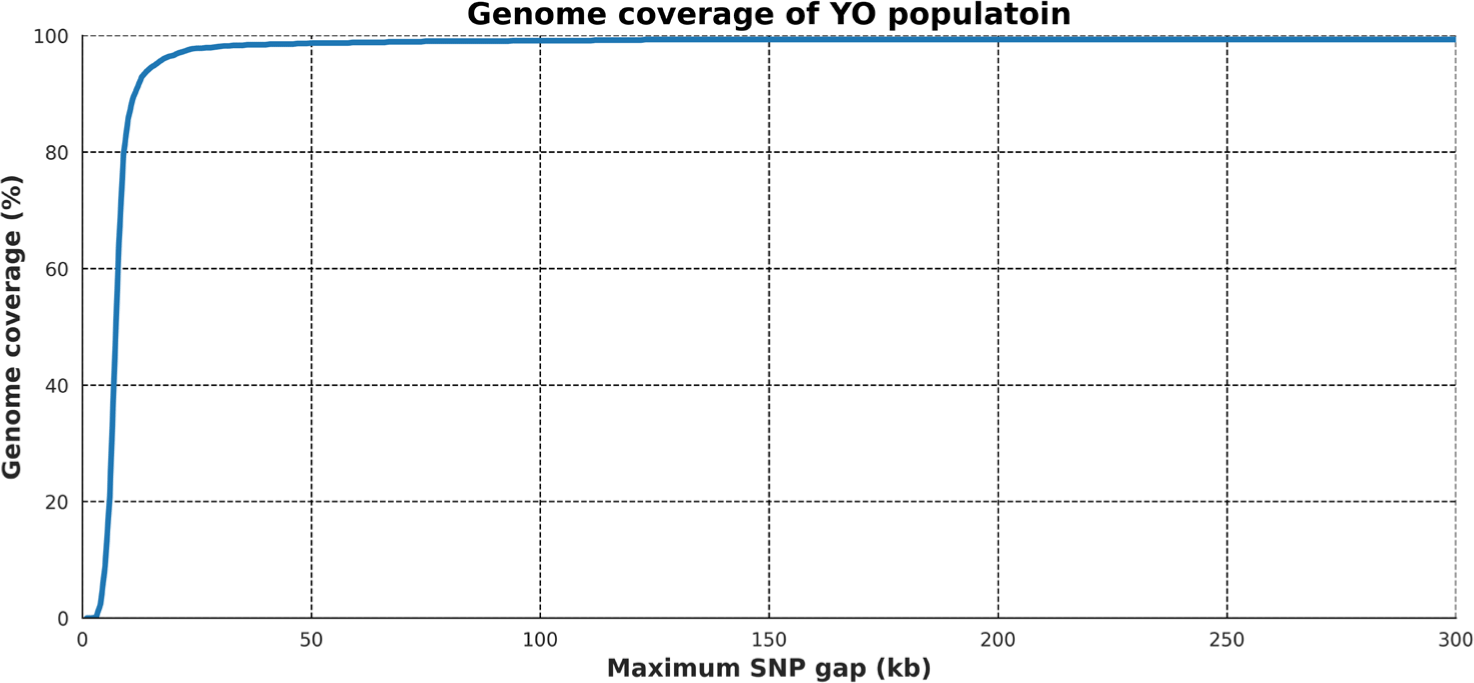
To determine the optimal value for the maximum gap between SNPs in an ROH, the genome coverage of an artificially created completely homozygous individual was assessed by changing the parameter value from 1 to 300. As a result, the genome coverage showed a notable increase from 4 kb/SNP in 600K SNP data. The maximum gap size of 80 kb/SNP reached 99% coverage; this value was selected as the parameter for the maximum SNP gap in an ROH. After reaching the maximum coverage of 99.34% at a gap size of 220 kb, we observed no further changes in coverage as the gap length increased (Fig. 1).
ROH analysis identified 20,339 ROHs in the 189 YO population. The average and total lengths of ROHs based on the number of ROHs per individual are shown using scatterplots (Figs. 2A and 2B) and violin plots (Figs. 2C and 2D).
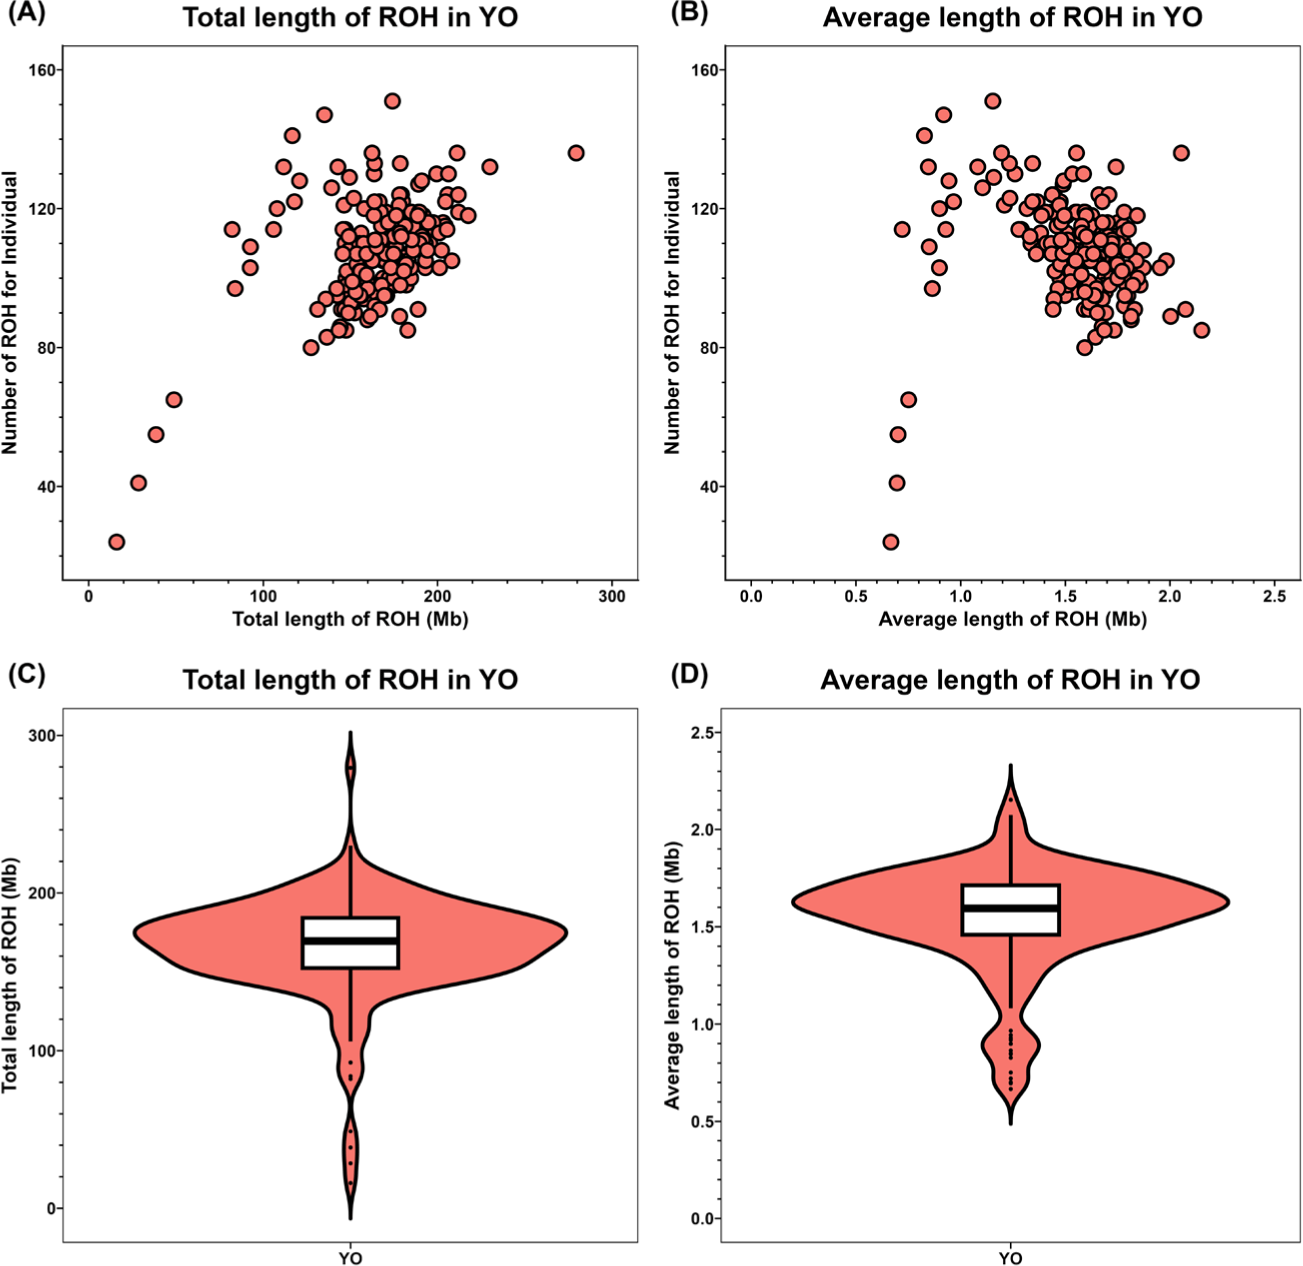
The average ROH length ranged from approximately 2.15 to 0.66 Mb, and the total ROH length varied between about 279 and 16 Mb. The shortest average and total ROH lengths were present in the same individual. The average number of ROHs observed in the YO population was approximately 107, with an average total ROH length of 165 Mb. The average length of an individual ROH was 1.542 Mb (Table 2).
| SROH mean ± SD (Mb) | LROH mean ± SD (Mb) | Number of ROHs mean ± SD |
|---|---|---|
| 165.649 ± 32.364 | 1.542 ± 0.274 | 107.6 ± 15.828 |
The frequency distribution and average length of ROHs were analyzed for individual chromosomes. Chromosome 1 comprised the largest proportion, approximately 19% of the total length. Generally, the proportion of ROHs decreased with chromosomal length (Fig. 3A). Chromosome 5 had the longest average ROH length at 1.834 Mb, followed by chromosome 2 with 1.833 Mb and chromosome 3 with 1.776 Mb (Fig. 3B).
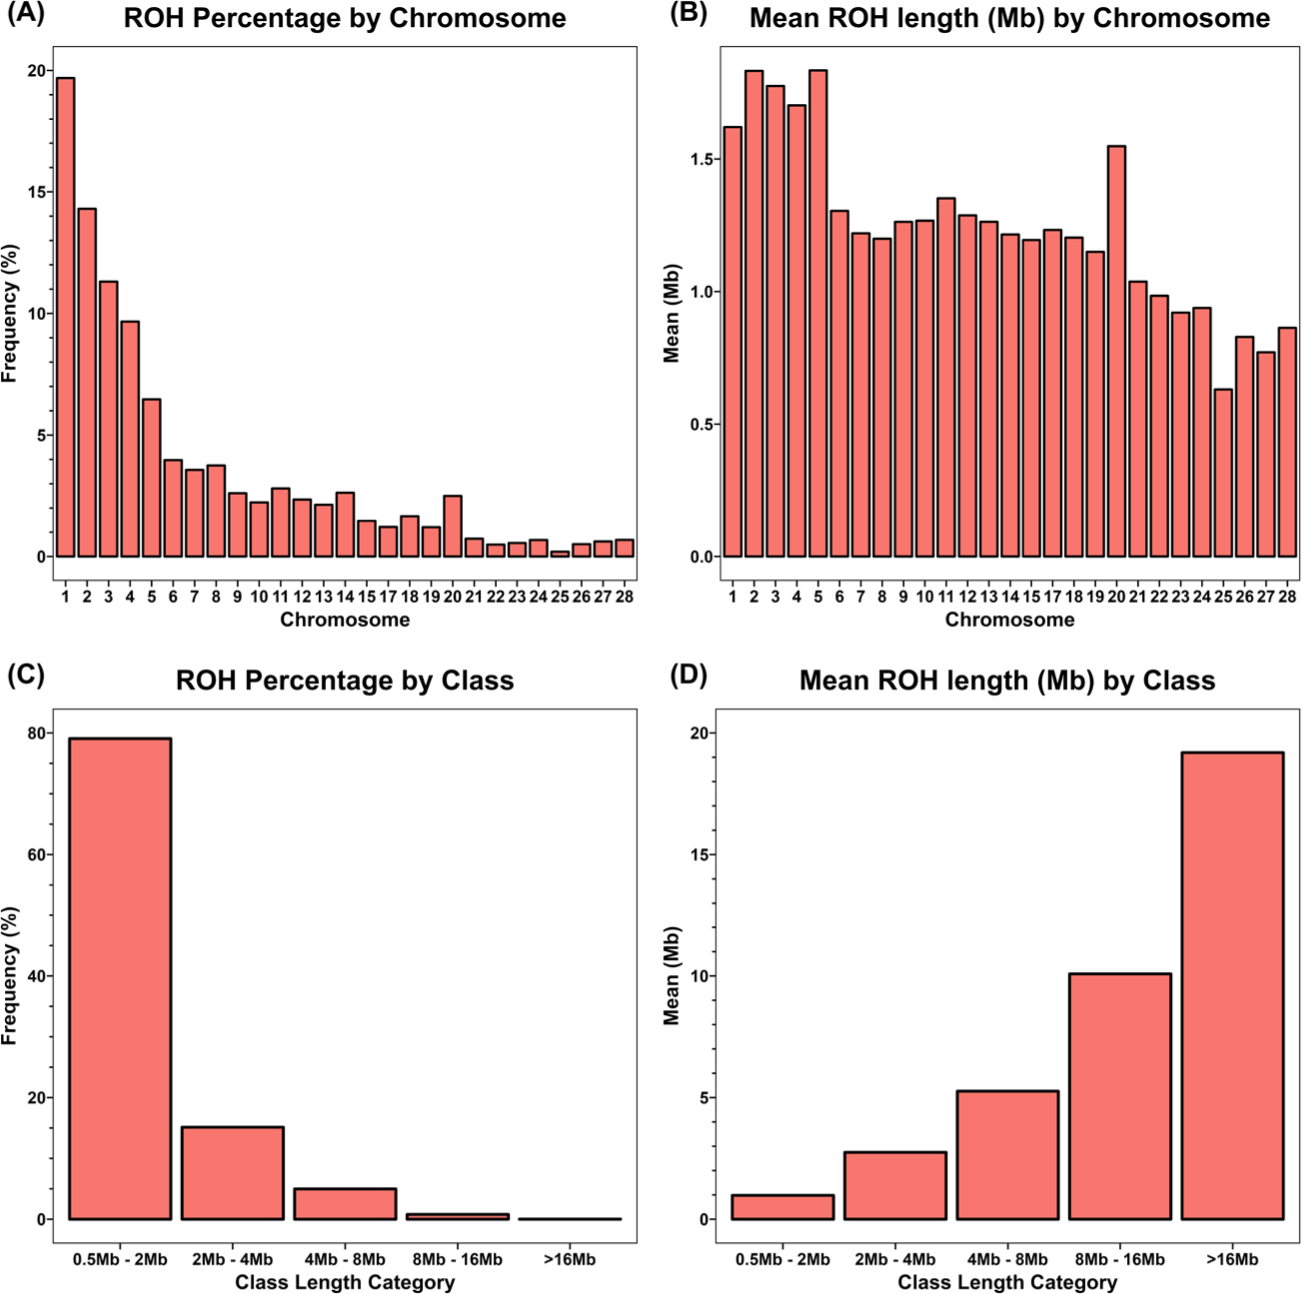
ROHs were classified into five categories according to length: 0.5–2, 2–4, 4–8, 8–16, and > 16 Mb. Of the 20,339 ROHs detected in the YO populations, the majority (79%) had a length of ≤ 2 Mb. In contrast, long ROHs with lengths ≥ 8 Mb constituted only 0.01% of the total ROH length. Four ROHs with lengths > 16 Mb were identified; all were on chromosomes 1 and 2. The longest ROH segment (20.85 Mb) was present on chromosome 2 (Fig. 3C). The average ROH lengths in the five categories were 0.98, 2.75, 5.26, 10.08, and 19.19 Mb, respectively (Fig. 3D).
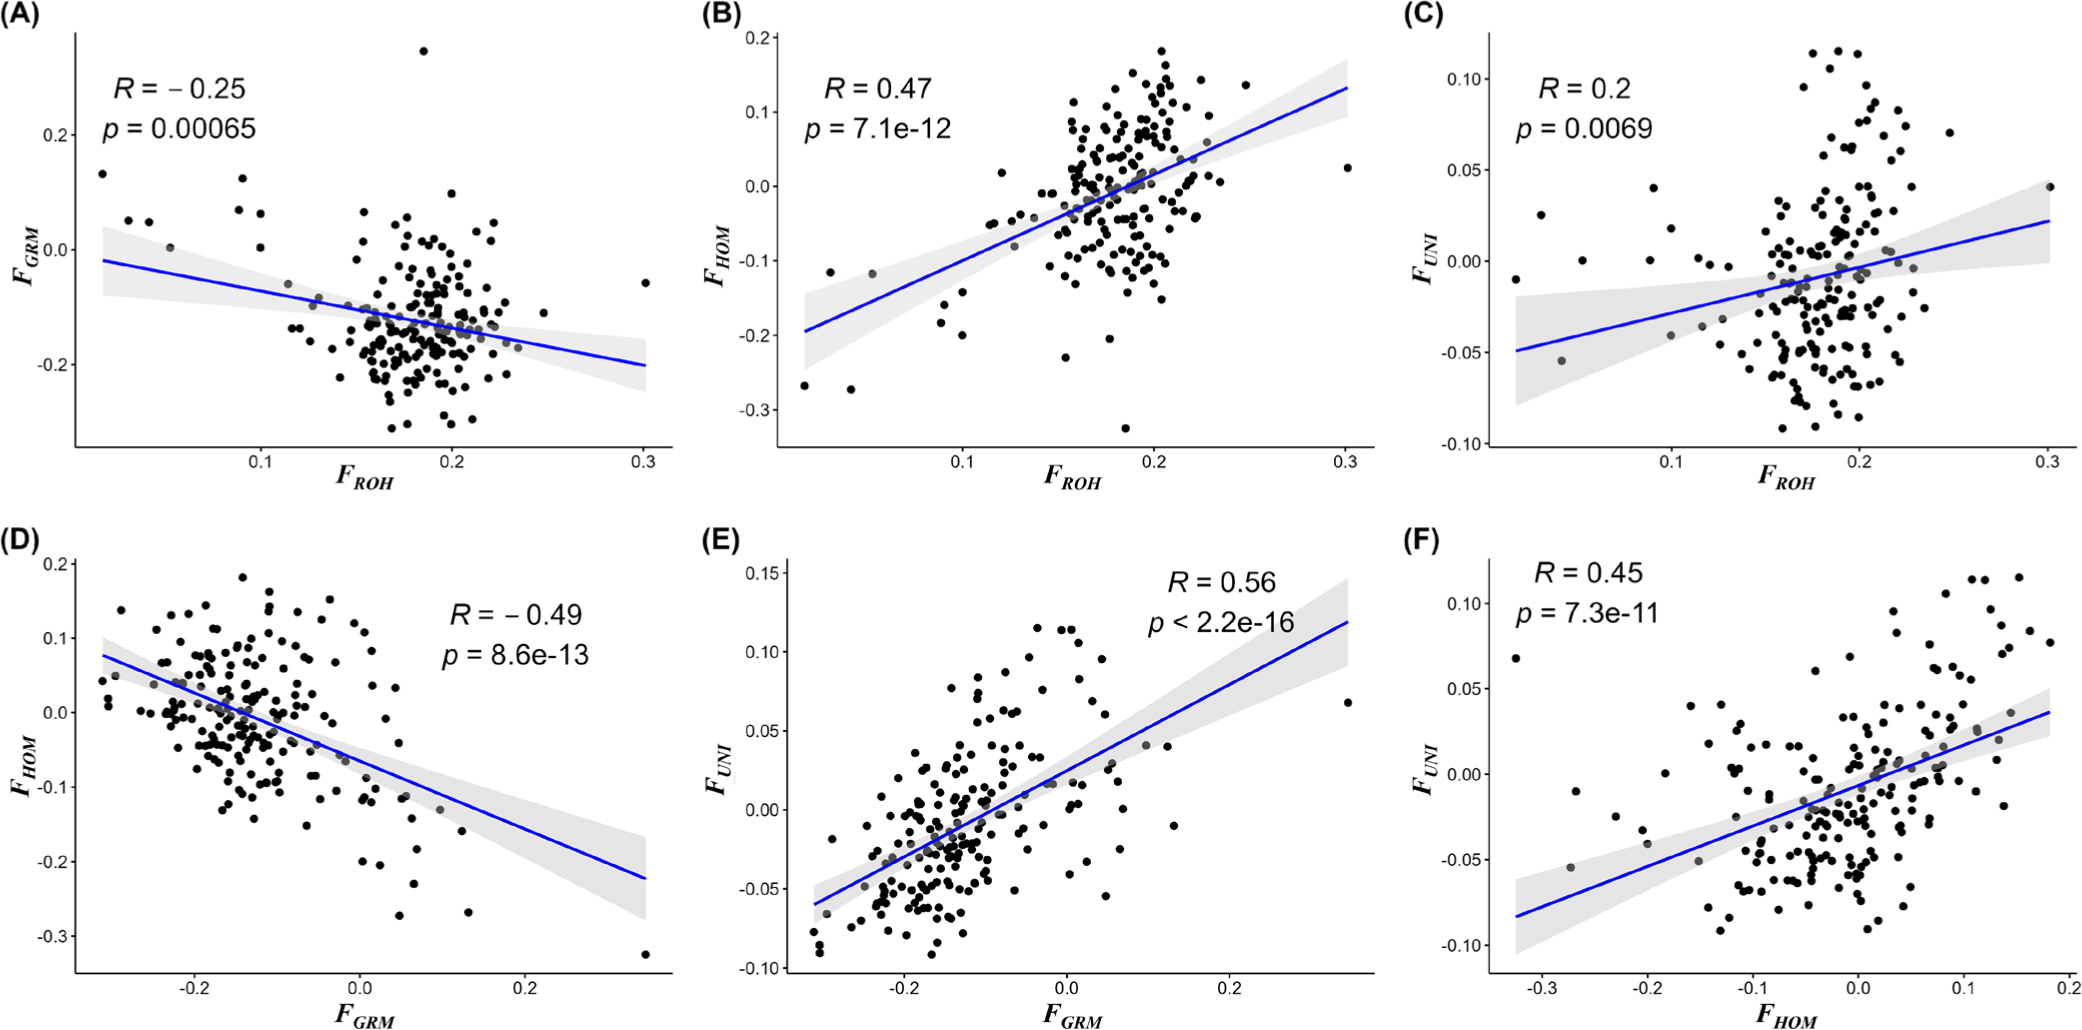
In this study, inbreeding coefficients were determined using four equations to confirm the inbreeding of the YO population. FROH obtained from the ROH information was 0.178. However, all three inbreeding coefficients (FHOM, FGRM, and FUNI) calculated using genomic information had negative average values; FGRM had the lowest value (–0.1344) (Table 3). Examination of correlations among inbreeding coefficients revealed that FROH had the highest positive correlation (0.47) with FHOM, followed by FUNI (0.2). In contrast, FROH had a negative correlation (–0.25) with FGRM (Fig. 4).
| Population | FHOM mean ± SD | FGRM mean ± SD | FUNI mean ± SD | FROH mean ± SD |
|---|---|---|---|---|
| YO | −0.0089 ± 0.0854 | −0.1229 ± 0.0915 | −0.0087 ± 0.0448 | 0.1785 ± 0.0349 |
An ROH island was designated as an area exceeding 49.20%, which corresponds to the top 1% of SNPs among the 534,705 SNPs in ROHs (Fig. 5). 17 ROH islands were identified on six chromosomes; the shortest ROH island was 233 bp (GGA20) and the longest ROH island was 2,069,982 bp (GGA20) (Table 4). Chromosome 5 had the most ROH islands (eight). In total, 152 genes that have gene symbol were annotated in the ROH islands (Table 4). The ROH island on chromosome 11 had the most annotated genes (39).
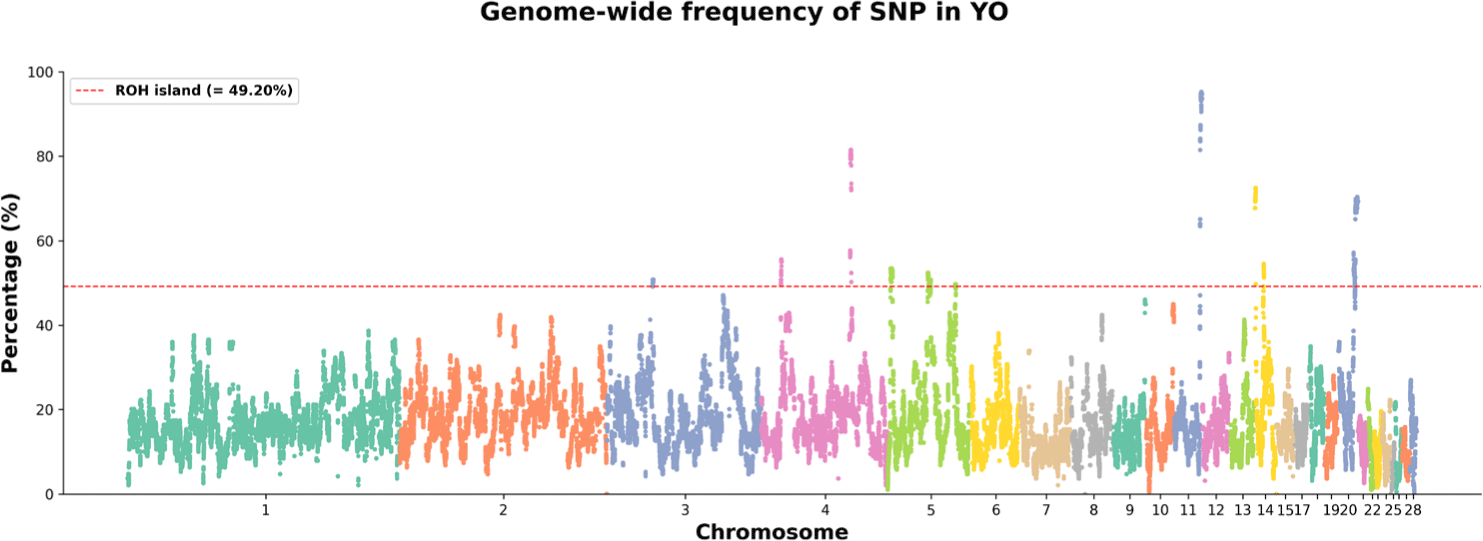
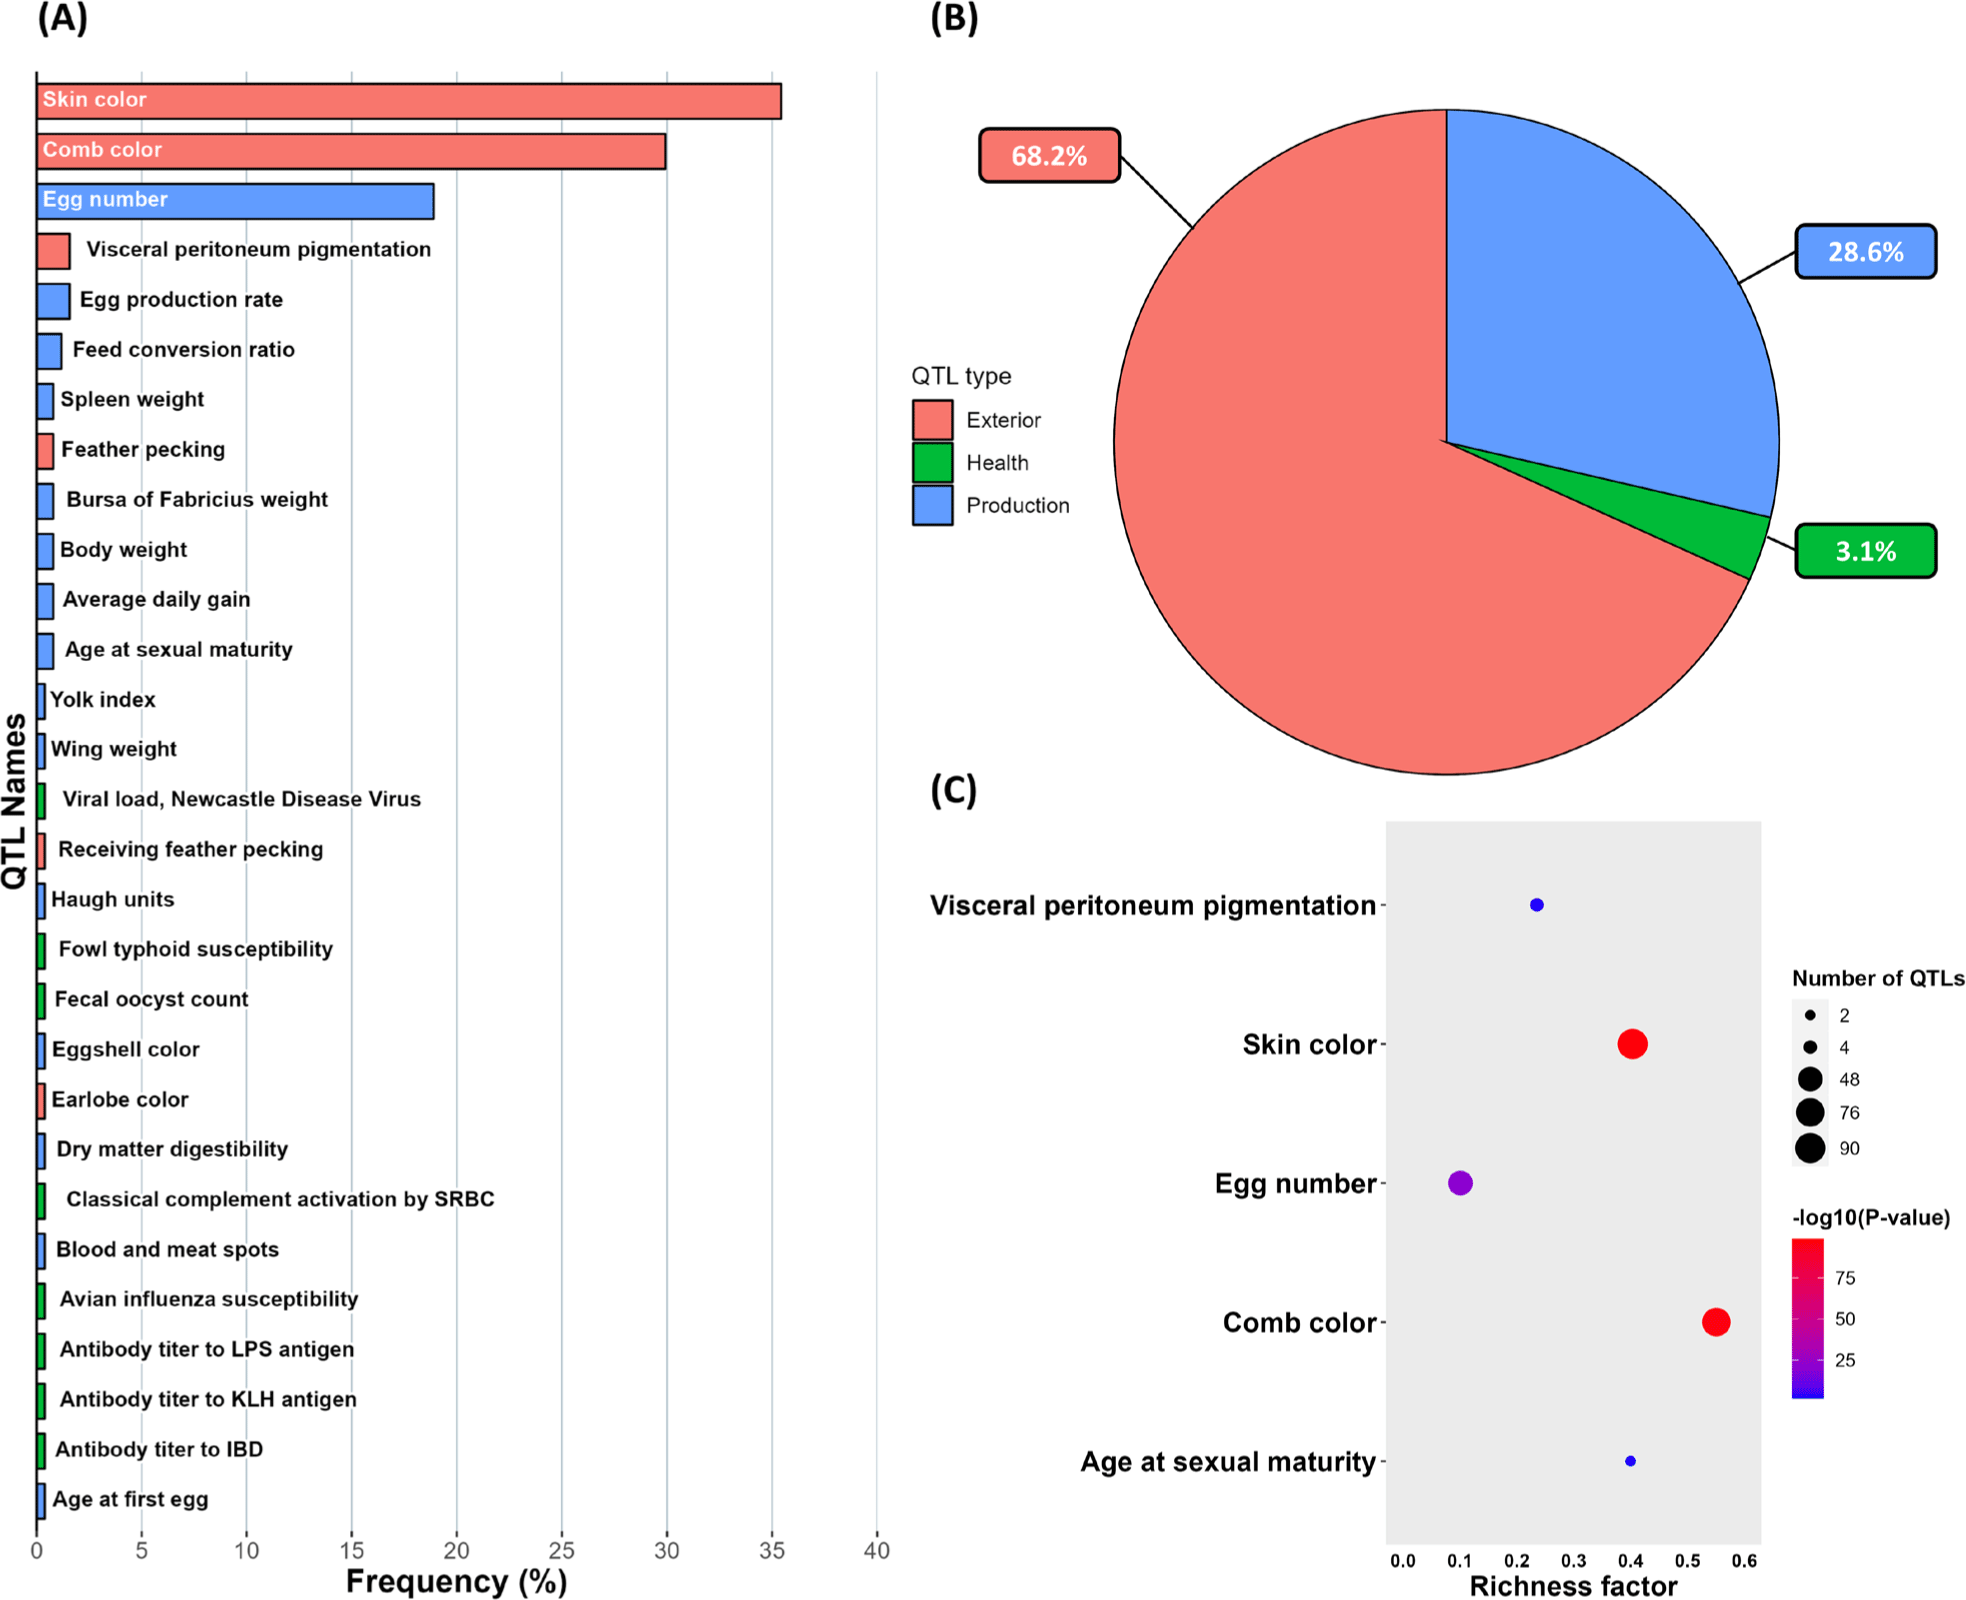
QTL regions overlapping the ROH islands were confirmed using the QTL database [23]. QTLs were classified into four categories according to relevant traits: exterior, health, physiology, and production. 30 QTLs were overlapped with ROH islands (Fig. 6A). QTLs were related to exterior traits (68%), production traits (28%), and health traits (3%) (Fig. 6B). The QTL enrichment analysis showed that five QTLs had a false discovery rate (FDR) ≤ 0.05; three were exterior-related QTLs and two were production-related QTLs including egg number and age of sexual maturity (Fig. 6C). The QTLs with the highest significant FDR p-value were related to skin color and comb color (Table 5).
DISCUSSION
Genetic diversity information of populations is necessary for the development of sustainable conservation strategies in livestock resources. The YO population currently consists of approximately 1,000 individuals. To preserve the YO population, a comprehensive preservation approach includes a dispersed conservation strategy of about 200 subpopulations and keeping the cryopreservation of semen [24]. Previous research conducted that the genetic diversity of the YO population was analyzed using 12 microsatellite markers as part of a continuous effort to minimize inbreeding. This analysis revealed the YO population can be divided into five clusters according to genetic distances among individuals within the population [2]. Although the conservation plan has been continuously improved, the estimation of inbreeding within a population remains challenging because of the absence of pedigree information, which is invaluable for determining inbreeding between individuals. In this study, we estimated the level of inbreeding within the YO population by analyzing ROH.
Various ROH studies have been conducted in livestock. However, the absence of a consensus regarding the definitions of parameters used in ROH analysis is a major challenge [7,14]. Meyermans et al. [13] observed that appropriate parameter values can vary among species and according to SNP data density. Thus, it is important to establish parameter values that are appropriate for specific SNP chip densities [13]. Here, we adopted the genome coverage method of Meyermans et al. [13] to determine suitable parameter values for the high-density chip used.
The length of the gap between SNPs determines the inclusion of homozygous SNPs within the same ROH segment. As a result, the SNP gap length has a substantial effect on ROH detection. For our analysis, we considered a maximum interval of 80 kb, which resulted in a 99% coverage rate, for the ROH analysis. This interval was smaller than the default PLINK value of 1,000 kb. Moreover, inaccurate SNP density parameters can affect ROH detection in regions with low SNP density [13]. However, the high-density SNP data we used contain an average SNP density of > 2 kb/SNP per chromosome [25]. Consequently, the density does not significantly affect the analysis unless the value decreases to < 2 kb/SNP. Because the default PLINK value of 50 kb/SNP exceeds the average density of high-density SNP arrays, we decided to use this default value.
Additionally, SNP pruning using the MAF during the QC process may affect the ROH results [13]. A SNP with a low MAF could refer to a SNP that nearly fixed within the population, indicating a lack of variation in that specific SNP. Thus, the pruning of rare MAF SNPs affects the detection of continuous homozygous segments. Consequently, the removal of SNPs in the QC process leads to measured ROH lengths that are shorter than their true lengths [13]. Therefore, our analysis used SNP data that did not exclude rare MAF SNPs.
ROH is a valuable genomic feature that enables the examination of inbreeding and homozygous patterns. We focused on the genome-wide distribution of ROHs and the frequency of ROHs across different length categories. Our analysis revealed ROHs in 27 of the 28 chromosomes, excluding chromosome 16. In the chicken, chromosome 16 is very short (ca. 539 kb) and includes the MHC-B and MHC-Y regions, which contain major histocompatibility complex (MHC) genes with high genetic diversity [24,26]. The genetic diversity of these regions contributes to the native chicken immune response [26]. Therefore, the absence of ROHs on chromosome 16 was presumably related to its allele diversity and short length (Fig. 3B). The ratio of ROH length to chromosomal length tended to increase with chromosomal length. When ROHs were categorized according to length, most were shorter than 2 Mb; ROHs longer than 8 Mb constituted approximately 1% of all ROHs (Fig. 3C). ROHs exceeding 8 Mb are typically generated by recent inbreeding, whereas ROHs shorter than 8 Mb are derived from common ancestors in more distant generations [9]. These findings indicate that recent inbreeding events were rare in the YO population. Moreover, the presence of numerous shorter ROHs is attributed to the bottleneck effect caused by a past reduction in effective population size [15]. These results are consistent with a previous report concerning a historical bottleneck in the YO population [27].
One of our objectives was to compare inbreeding coefficients calculated using different methods. The average FROH was 0.178. Compared with previous research that identified FROH with 600K SNP chip data in Chinese chicken breeds, the level of FROH in YO was lower than FROH of commercial breeds and similar to Chinese indigenous chickens [28]. Therefore, YO has maintained a moderate level of FROH as indigenous chicken breeds. We assumed that the YO population might have been less affected by inbreeding because the YO population was not subjected to artificial selection based on rigorous criteria conducted on other commercial breeds for production traits. FROH was calculated as a positive value, while the other inbreeding coefficients calculated by using genomic information had negative values (Table 3). These inbreeding coefficients reflect the expected frequencies of homozygosity based on Hardy–Weinberg equilibrium or the correlation between alleles present in individuals. If the observed level of homozygosity within a population exceeds the expected value, the inbreeding coefficients will have positive values; a negative value indicates observed homozygosity that is lower than expected [6]. Accordingly, inbreeding coefficients based on genomic information suggested that the YO population has levels of homozygosity below predicted values. However, these estimators vary according to allele frequencies present in the population [6, 29]. Inbreeding coefficients based on ROHs, such as FROH, provide more accurate estimates of homozygosity in the genome, compared with inbreeding coefficients based on genomic information. Therefore, FROH can assess the actual loss of heterozygosity, regardless of allele frequencies, and is more reasonable for small population sizes, such as endangered or conserved populations [4]. Hence, using FROH could be useful information to detect the inbreeding rate of the YO population, which has no pedigree information, and it would be an effective way to track the variation of the inbreeding rate over generations.
The correlations of FROH with FHOM, and FUNI were all positive, whereas the correlation of with FGRM was negative. This is because FROH and FHOM give equal weight to all alleles, whereas FGRM gives more weight when rare alleles are homozygous [4]. Therefore, FGRM tends to have a negative correlation with FROH in a population with more rare minor alleles [29]. In the YO population, the negative correlation between FROH and FGRM might have been attributed to the lack of MAF pruning during the SNP QC process.
ROH islands represent genomic regions where genetic diversity associated with selection for specific traits has been reduced, and they indicate genomic regions related to selection [30]. Some ROH islands, such as the island on chromosome 3, contained SNPs that were annotated with long non-coding RNAs and micro RNAs, not coding genes. This finding suggests that these regions might be caused by selection acting on uncharacterized noncoding DNA regions and gene regulatory regions, or fixation occurred because of genetic drift [31].
Many coding genes were present in the ROH islands. The ROH island region on chromosome 5 (2.085–3.522 Mb) was reported in indigenous chicken breeds from various countries [30,32,33]. This region contained 11 genes, including the ANO5 and NELL1 genes associated with production-related traits. ANO5 is involved in muscle tissue development and estrogen production, whereas NELL1 is associated with skeletal tissue formation. These genes have important roles in the high body weight gain of broiler chickens [34,35]. ROH islands containing genes associated with the unique phenotype, a completely black color in YO, were also discovered. The MC1R gene in the ROH island on chromosome 11 is involved in melanin synthesis and influences feather coloration in chickens [36]. Furthermore, the ROH island region on chromosome 20 overlapped a region that is likely involved in skin pigmentation in the Korean native chicken [37]. Genes within this ROH island, such as GNAS and RBM38, might be associated with visceral peritoneum hyperpigmentation in chickens [38,39]. GNAS gene encodes G protein α-subunit protein (Gsα) that interact with various G protein-coupled receptor (GPCR) and stimulate the upregulation of cAMP by adenyl cyclase [40]. MC1R is the gene that encodes the GPCR melanocortin-1 receptor, which is coupled with Gsα [41]. Therefore, overactivity of the cAMP pathway caused by the GNAS mutation could give rise to hyperpigmentation [42]. Mutations in the promoter region of the GNAS gene contribute to skin pigmentation in chickens [39]. Based on these findings, the ROH islands on chromosomes 11 and 20 are presumed to have arisen through selection based on phenotypic traits in the YO population.
Comparative analysis of ROH islands and QTLs from the QTL database revealed that a strong association between ROH islands and exterior trait QTLs. Especially among the six exterior trait QTLs that overlapped ROH islands, five QTLs were related to color. Furthermore, the QTL enrichment analysis showed that QTLs associated with skin and comb color traits were significantly enriched in the ROH islands in YO. This evidence could suggest that ROH islands are highly connected with the color of YO, and the long-term selection for a black exterior appearance in the YO breed has critically affected the formation of ROH islands.
CONCLUSION
This study used ROH analysis of genomic information from the YO population to assess the inbreeding coefficient and identify traces of selection. ROH-based inbreeding coefficients are suitable for the conservation of populations without pedigree information, such as the YO population. We found significant correlations between the ROH-based inbreeding coefficient and other inbreeding coefficients, thus validating the use of ROH analysis as a reliable measure of inbreeding. Importantly, the ROH-based inbreeding coefficient was not affected by allele frequencies, conferring an advantage over other methods, which may be influenced by genetic variation within a population. Furthermore, this study identified the characteristics of ROH islands that were associated with exterior appearance and production traits in YO chickens. These results provide useful information for the establishment of effective conservation strategies of the YO population.