
INTRODUCTION
The Anthropocene era is witnessing biodiversity loss, which dramatically affects species adaptation. For example, intraspecific genetic diversity provides a critical basis for evolutionary changes, such as adaptation to new environmental conditions [1,2]. In today’s extreme environments, adaptation traits for livestock include tolerance to climate changes and ability to adapt to poor-quality diets [3]. To ensure sustainability of the livestock industry, researchers are actively bioprospecting for breeds with higher adaptation potential, as this is necessary to respond adequately to challenges associated with climate change, food security and livelihood needs, and conservation of natural resources [3].
The growing demand for animal food products is met through industrial systems. Nonetheless, traditional livestock systems still contribute to the livelihoods of 70% of the world’s rural poor. Smallholders and mixed crop-livestock systems are predicted to continue serving as the backbone of pro-poor agricultural growth in developing countries through 2030 [3,4]. The diversity of these production systems and cultures with regard to farm animal species such as sheep (Ovis aries), which is based on a long history of domestication, has created diverse, locally adapted breeds across global geographic regions. Unfortunately, comprehensive data on many locally adapted or indigenous breeds are scarce, which could adversely affect long-term food security and agriculture sustainability [5].
Malin sheep, which derives from Malaysia (MAL) Indigenous (IN), is the only indigenous sheep breed in Malaysia [6,7]. Compared with exotic sheep breeds from temperate regions, Malin sheep are hardy, exhibiting heat tolerance, highly resistance to diseases such as internal parasites, and tolerance of a poor-quality diet [5,8,7]. The adaptive capacity of Malin sheep provides a glimpse of the range of genetic diversity among the world’s livestock. Nevertheless, imported, exotic sheep breeds such as Dorper and Boer are in high demand in local markets due to their meat quality [9,10] whereas Malin sheep are regarded as having a lower meat composition [11], wool of little benefit to the livestock industry [12], small body size, and slow production rate [6]. These factors have caused local herders to choose exotic breeds over Malin sheep (Department of Veterinary [DVS], personal communication). However, the lack of interest in Malin sheep has caused their population to decline nationwide. In addition, no regular updates regarding the Malin sheep population have been conducted, and no proper risk status has been calculated.
The most recent study of the Malin breed was conducted in 2014 by Mastura et al. [7] and involved the Malin nucleus herd maintained by the National Institute of Biodiversity Veterinary (NIBV) in the Jerantut district, located in Pahang, East Coast region of Peninsular Malaysia. In their study, Mastura et al. [7] examined various phenotypic characteristics of Malin sheep, including morphologic and morphometric traits. The FAO [5] stated that recording the geographical distribution of animals is an integral component of phenotypic characterization. However, as the findings pertained only to Malin sheep in the NIBV population, which is well-managed and adequately supervised by DVS personnel, comprehensive studies of other Malin sheep smallholders are warranted. Therefore, this study was conducted as a primary survey of Malin herd locations and phenotypic characteristics across Peninsular Malaysia, including other local farmers nationwide with variable livestock management methods. The field characterization of these small Malin herds provides information regarding the different phenotypic characteristics of these sheep. The present study recorded the geographic distribution and differences in morphological and morphometric traits among Malin sheep. We then quantified the traits using multi-variate statistical analyses to define the best measures representing body conformation when comparing Malin sheep across the studied locations. These findings will help clarify herd positions and identify populations that require management attention.
MATERIALS AND METHODS
To clarify Malin herd positions nationwide, we collaborated with the federal DVS to determine the locations of small Malin sheepherders. Inventories of Malin sheep populations were obtained manually via email correspondence and telephone by the state DVS after local herders assented to participation in a sheep census. Our research team also conducted phone calls and population searches of the Malin breed based on data from internet searches and personal communications. Raw data on herd locations and population sizes were compiled into a master spreadsheet and later shared with the federal DVS.
This study was conducted between October 2019 and February 2020. All procedures involving animals performed in this study were approved by the Animal Ethics and Care Committee at UKM (FST/2019/SHAIRAH/20-MAR/999/-MAR-2019-DEC-2021) and by the DVS Approval Committee (REF: JPV.BPI.600-1/7/1).
Locations for the study of Malin sheep populations were chosen based on a purposive sampling technique. This sampling technique depends entirely on personal knowledge of an individual that can be contributed to the research [13] but cannot be obtained from another individual [14,15]. We obtained additional information regarding Malin sheep populations from a few active herders via telephone. However, due to logistical issues, details were used only for data recording purposes and not determination of sampling locations. Hence, the phenotypic data were purposely collected from 15 locations in 3 states (Pahang, Perak, and Kelantan) based on recommendations from the respective state DVS personnel and pandemic constraints.
All collected data were obtained from 152 adult female (n = 102) and male (n = 50) sheeps from different herds in Pahang (n = 59), Perak (n = 30), and Kelantan (n = 73). As part of the genetic diversity study, the inclusion criteria were set to select for physically matured sheep aged between 9 months and 3 years, as confirmed by their keepers. In addition, the FAO [16] recommended that the sample size specifically for phenotypic and genotypic characterization research should not exceed 10% of the total animal population and that at least 5 animals be sampled from each selected population. Table 1 summarizes the population and sampling sizes for the studied locations.
Using the census population size from the sampling locations, we calculated the effective population size (Ne) using the demographic method based on the number of male and female animals according to Hill’s formula (Equation 1). Only mature male sheep (sires) and female sheep selected for breeding purposes were used to calculate the Ne value.
where M = Mature male sheep or sires; F = Mature female sheep; and Ne = Effective population size.
All qualitative traits for morphological characterization were recorded following the FAO guidance list for sheep morphological characteristics [5]. Observed traits included wool color (WC), wool type (WT), presence of horn (PH), head profile (HP), hoof color (HC), and horn shape (HS). For WC, the classification was based entirely on personal observation without the aid of a color chart, assisted by veterinary officers. Qualitative data were tabulated in a spreadsheet and further analyzed using descriptive statistics such as percentage (%), frequency, and number of individual sheep (n). Chi-square (χ2) tests for heterogeneity were carried out using MINITAB software, testing the null hypothesis that different qualitative characteristics for each trait observed among the Malin herds occur at random (p < 0.05) [17].
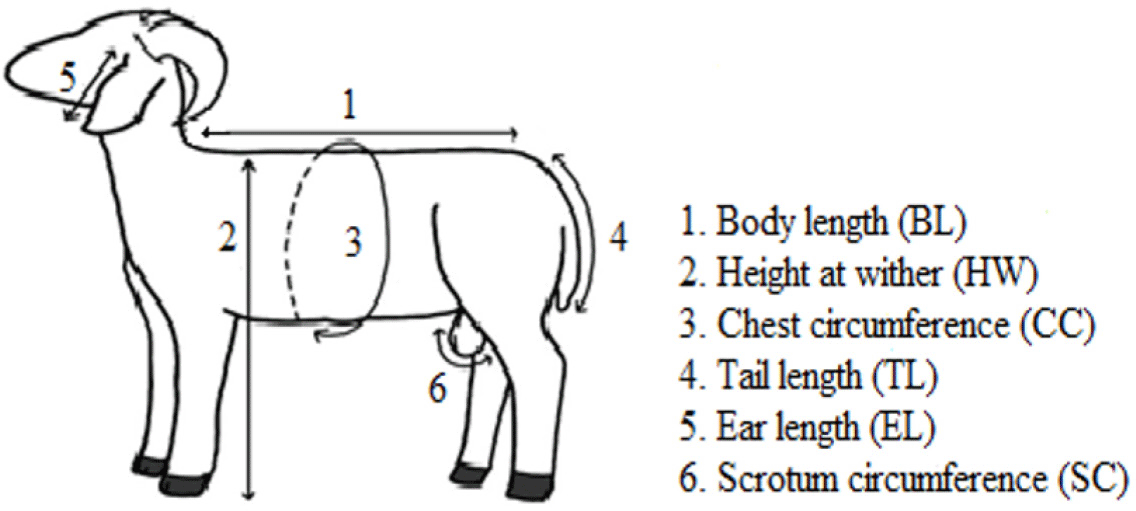
The body weight (BW) and linear body measurements were recorded using an animal weighing scale and flexible measuring tape. Seven body measurements were recorded, including BW, body length (BL), height at wither (HW), chest circumference (CC), tail length (TL), ear length (EL), and scrotum circumference (SC). Before any measurements were collected, sheep were made to stand straight in body position and raise their head to avoid inaccurate measurements [18]. In addition, care was made to take all morphometric measurements before sheep had their first feeding and watering for that particular day in order to avoid post-feeding effects. Fig. 1 illustrates the measurement of sheep characteristics other than BW, and Table 2 provides descriptive details.
Morphometric data were analyzed using R software (version 3.6.3) and PAST software (4.09). However, due to some missing BW data, weight was estimated using an imputation method prior to downstream statistical analyses.
Missing data are commonly obtained using an imputation method [19] to avoid reducing the sample size. This study applied a stepwise linear regression imputation model to estimate missing data on sheep BW [20]. With regression imputation, the information of other variables (i.e other body measurements BL, HW, etc.) is used to predict the missing values in a variable (i.e body weight BW) by using a regression model. Three models, Model1, Model2, and Model3, were built to generate a regression formula to examine the high contribution of linear body measurements to BW readings, along with other predictors (states, districts, sex). This analysis involved several addition and reduction processes of independent variables until statistical significance was achieved (p < 0.10). Each model calculated and estimated BW based on linear regression by including and excluding a number of predictors, such as district, state, and sex. To choose the best model for estimating logical BW readings, the model showing the highest R2 value and lowest number of Akaike Information Criteria (AIC) was considered [21]. All imputations and BW predictions were performed in R using the MASS package.
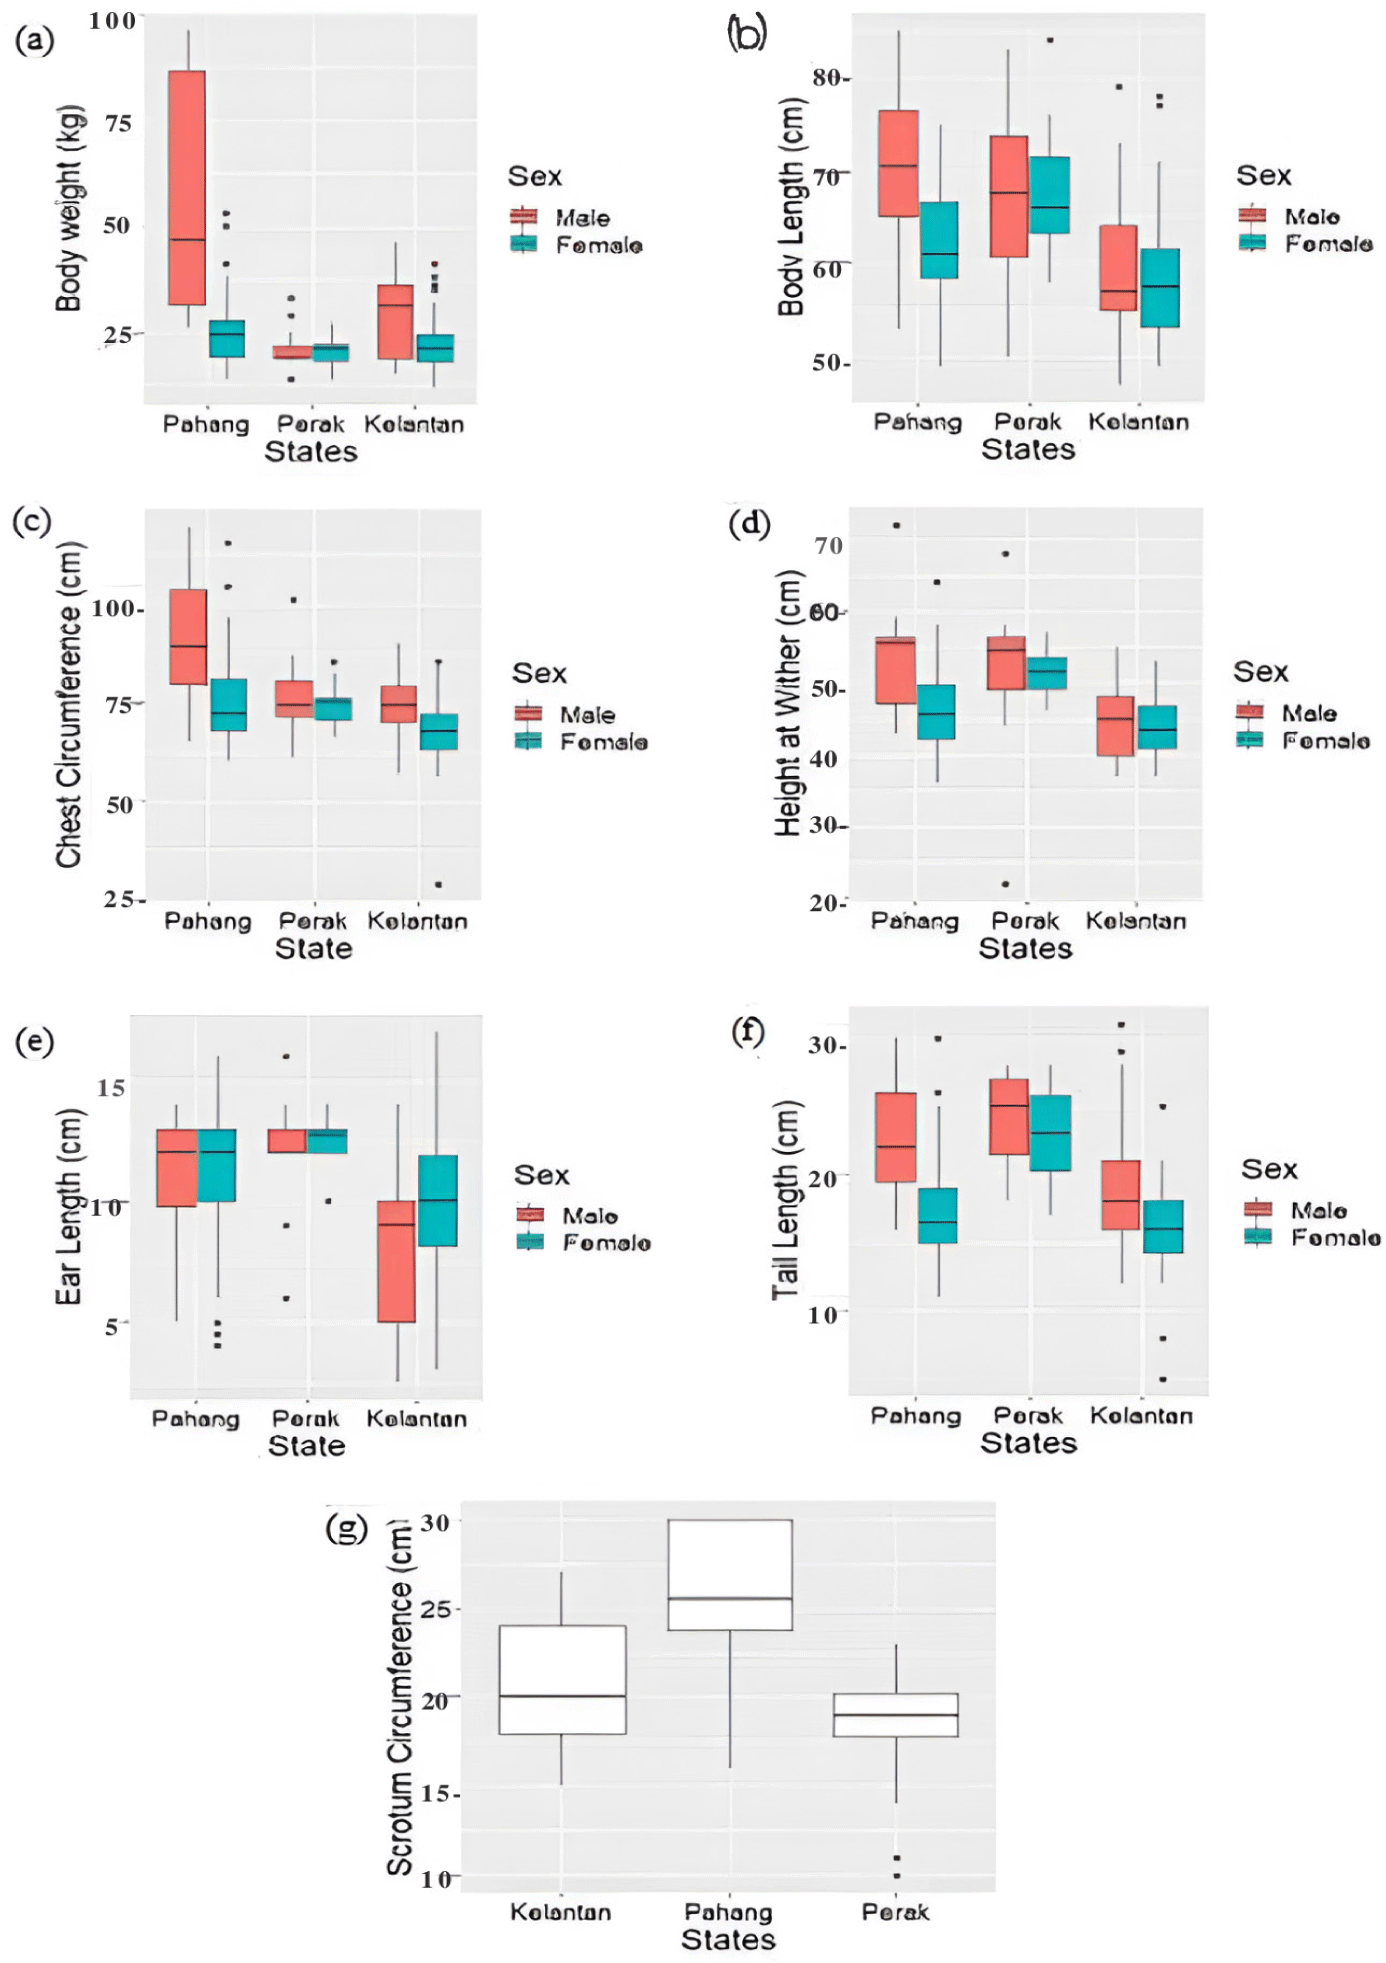
Prior to hypothesis testing, the Shapiro-Wilk normality test was conducted to determine the data distribution. Non-parametric Kruskal-Wallis tests were subsequently employed to identify statistical differences in morphometric traits between studied locations among male and female sheep separately. This test compares the median value of each morphometric attribute [22]. A boxplot diagram was constructed using the ggplot package in R to display the distributions of all the morphometric data for each studied location.
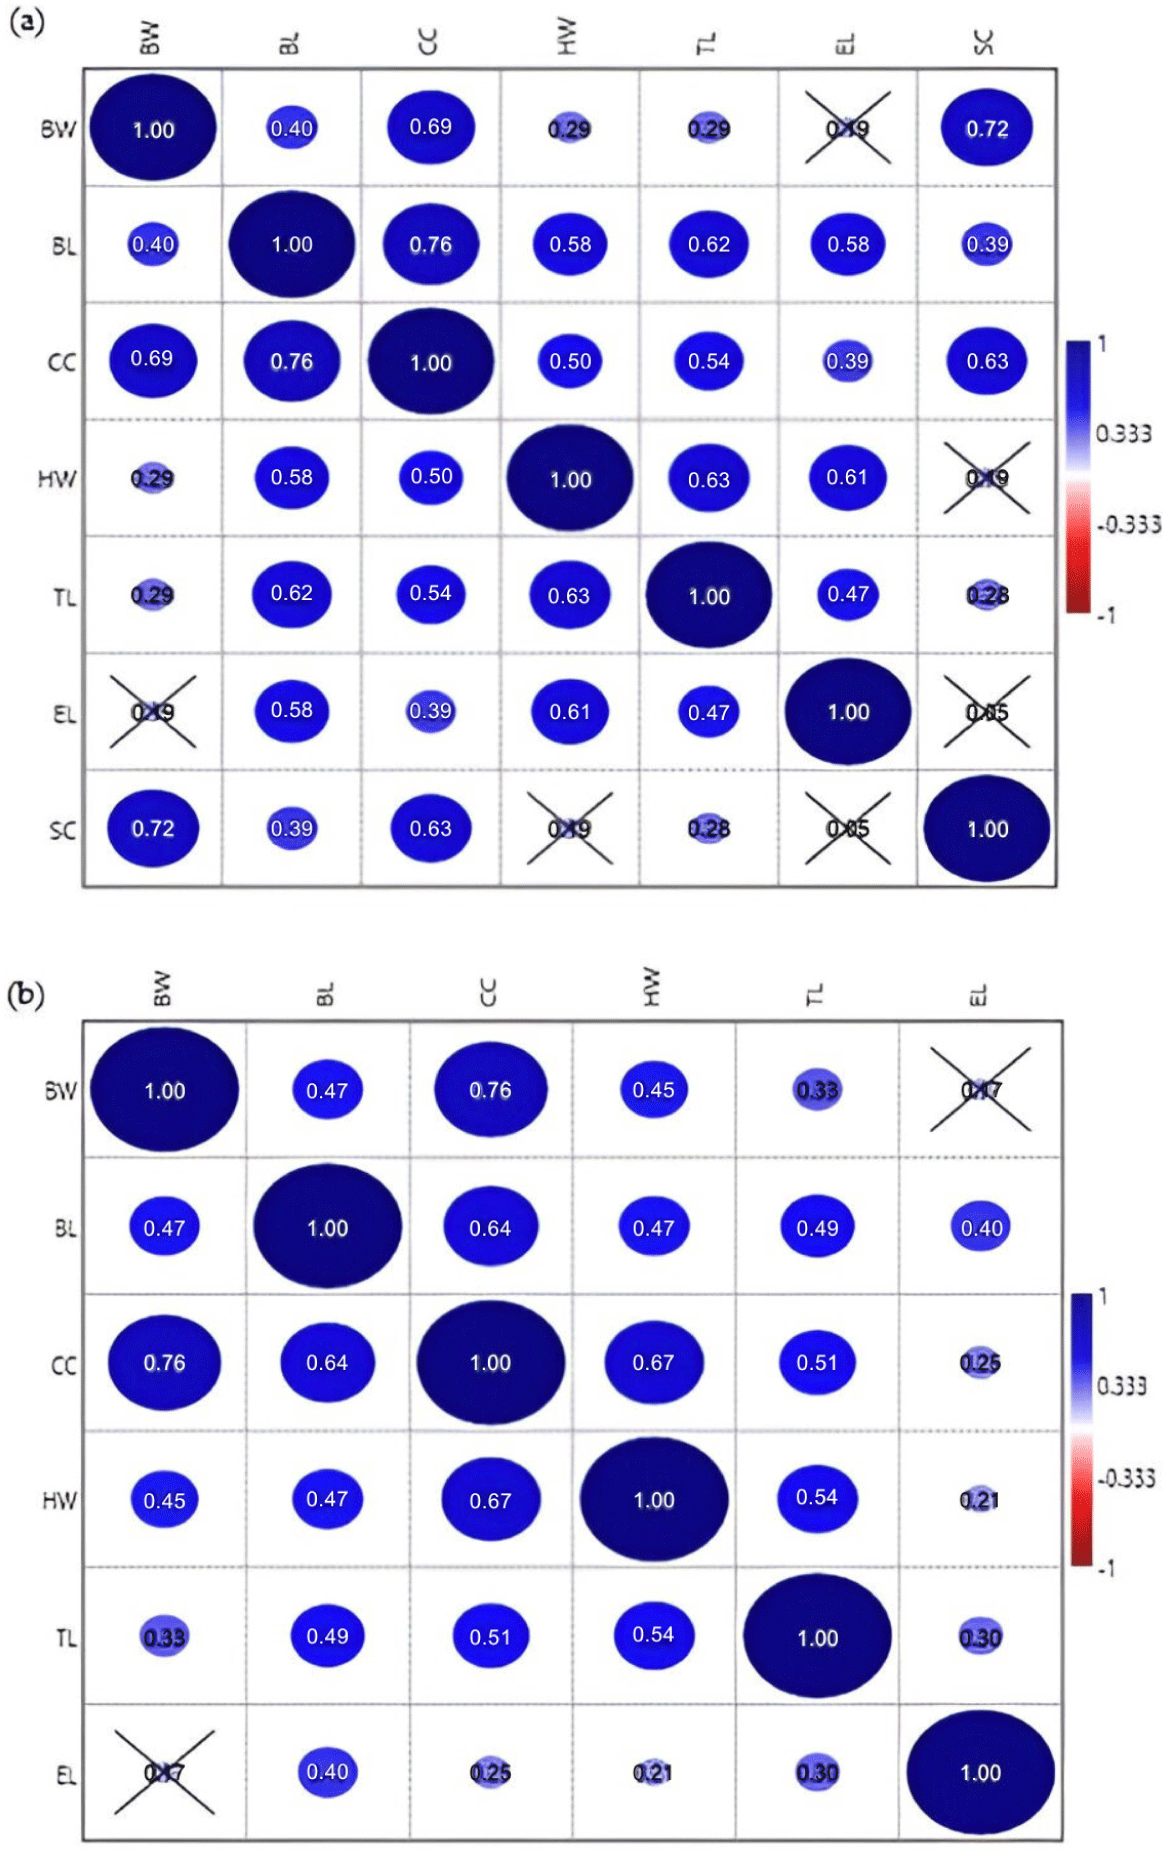
To infer any associations between morphometric variables and determine their strength [23], the correlations between BW and all linear body measurements were determined using Spearman rank correlation analysis. The correlation coefficient range was between +1 and −1 [24]. Each coefficient value explained a different correlation relationship level, classified as either very weak (value = 0.00 − 0.19), weak (0.20 − 0.39), intermediate (0.40 − 0.59), strong (0.60 − 0.79), or very strong (0.80 − 1.00) [23].
Based on the multi-morphometric variables analyzed in this study, we further visualized the phenotypic resemblance of Malin sheep individuals across their geographic space in comparison with sheep from Jerantut using non-metric multidimensional scaling (NMDS) plots as an ordination method. In NMDS analysis, coordinates of an object (each individual sheep) are plotted into similarity and dissimilarity sets based on rank in 2-D scatter plots without any emphasis on the magnitude of similarities or dissimilarities [25]. In an NMDS analysis, individual sheep will be plotted at a closer distance when they share a greater amount of morphometric similarity; conversely, they will be plotted further away when they share less similarity [26–28]. The similarity measure of the Gower method was used due to the capability of measuring many physical units [29,30], such as in kilograms (kg) and centimeters (cm). Sheep from Jerantut were separated as one particular population to serve as a benchmark herd, as sheep from this location are likely maintained under optimal animal husbandry conditions. Different groups were marked with different colors, as depicted in Table 3.
| Pahang | Perak | Kelantan | |||
|---|---|---|---|---|---|
| Studied location | Symbol | Studied location | Symbol | Studied location | Symbol |
| C-01 | + | A-01 | ▼ | D-01 | o |
| C-02 | ■ | A-02 | ▼ | D-02 | ● |
| C-03 | X | D-03 | + | ||
| C-04 | * | D-04 | * | ||
| D-05 | X | ||||
| D-06 | Δ | ||||
| D-07 | ▲ | ||||
| D-08 | □ | ||||
| D-09 | ■ | ||||
Following visualization using an ordination plot, multi-variate hypothesis testing was performed using analysis of similarity (ANOSIM) and similarity of percentage (SIMPER). ANOSIM was used to determine if there were any significant differences between Malin herd populations [31], whereas SIMPER was used to determine the highest percentage of morphometric variables contributing to any such differences [27].
RESULTS
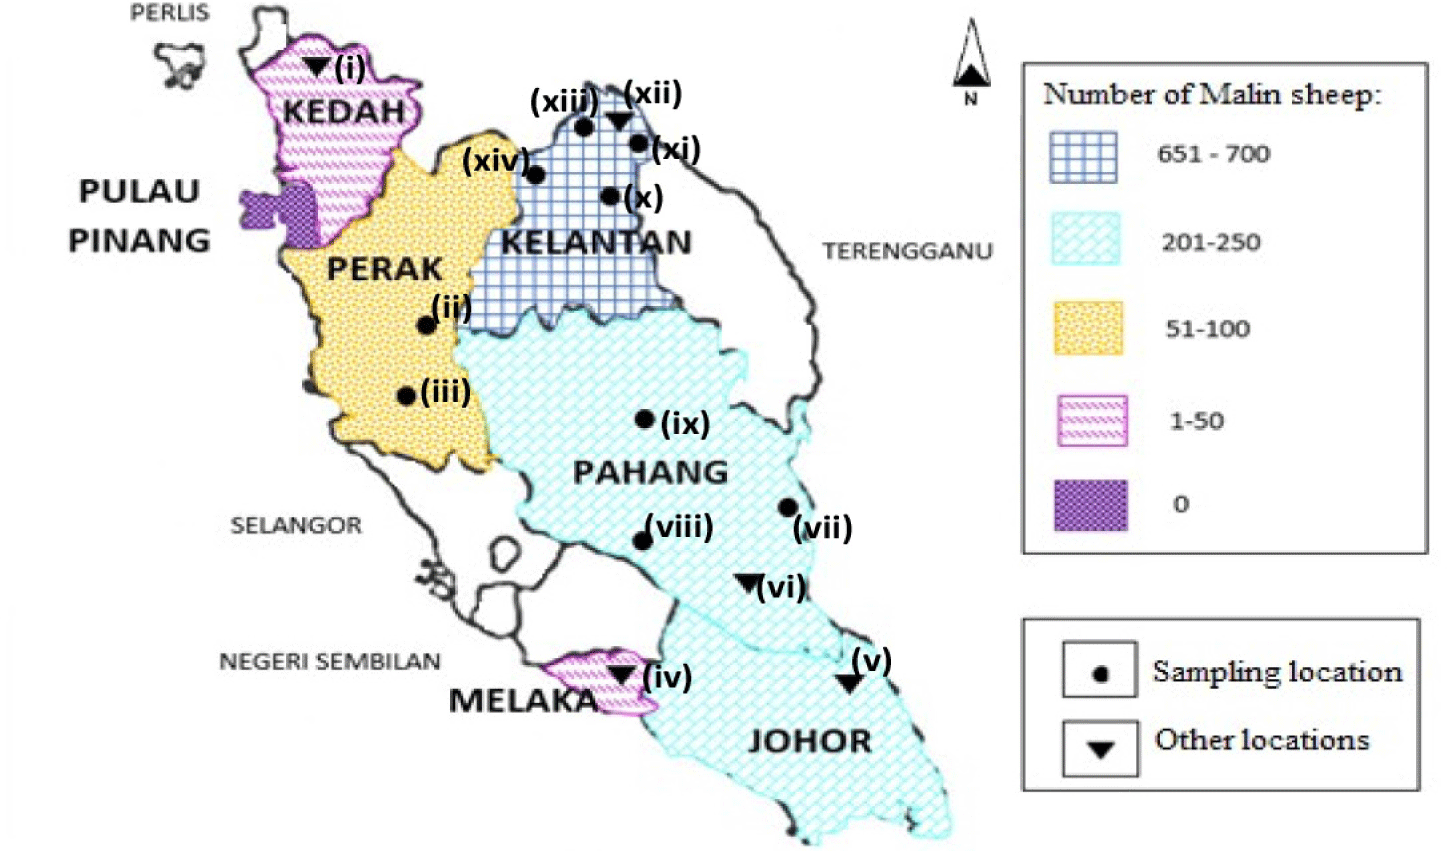
In the present study, we characterized the geographical distribution and occurrence of Malin sheep across Peninsular Malaysia. Malin sheep populations were recorded in six states: Kedah, Perak, Kelantan, Pahang, Melaka, and Johor (Fig. 2). The data were obtained from (1) correspondence with state DVS personnel and/or (2) from personal communication through telephone calls. In addition, the latest update from state DVS staff confirmed that no Malin sheep populations exist in Pulau Pinang (Penang) or across East Malaysia (Sabah and Sarawak). No information was obtained regarding the existence of Malin populations in other states, such as Terengganu, Negeri Sembilan, Kuala Lumpur, Selangor, or Perlis, however, we do believe that small and scattered Malin populations might be present.
Apart from census population size (Table 1), we also documented the number of male and female Malin sheep in each study location based on the inclusion criteria. Using this information, we then calculated the effective population size (Ne), as shown in Table 4. The overall Ne value for Peninsular Malaysia determined based on data from all sampling locations was 177. Within each farm, two locations (C-03 and D-03) had a Ne value of zero because no Malin male sheep were kept on the farm. The other 12 locations had a low Ne value (< 50), and only location C-02 had a Ne value > 50.
Based on census population size, seven sampling locations had more than 30 sheep, with three locations in Pahang (C-01, C-02, C-03), two in Perak (A-01, A-02), and two in Kelantan (D-04, D-08). The remaining eight locations (C-03, D-01, D-02, D-03, D-05, D-06, D-07, and D-09) had < 30 sheep. Overall, Kelantan had a higher number of Malin sheep than Perak and Pahang.
The phenotypic characteristics are presented in Table 5. First, in terms of WC, Malin sheep had four variations (Fig. 3). Overall, more than half of the studied Malin population showed light brown (Lb) wool. This was followed by brown (Br) wool at 19%, and a combination of 16% black and brown (Bl + Br) and 8% white and black (W + Bl). With regard to WT, Malin sheep had either smooth (41%) or coarse (59%) wool. The HP was 72% straight and 24% convex. Most Malin sheep had no PH, with only one-quarter of Malin sheep having horns. Of sheep with horns, almost all had curvy horns, and only 3% had scurs HS (see Fig. 4). With regard to HC, 51% of Malin sheep had white hooves, and 47% had black hooves. The Chi-square χ2 heterogeneity test (Table 5) detected significant differences in the proportion of phenotypes only for WC (p < 0.05); therefore, we rejected that different color variations in Malin sheep were random. The Lb color were found to be statistically dominant for Malin wool. None of the other traits exhibited statistically significant differences.
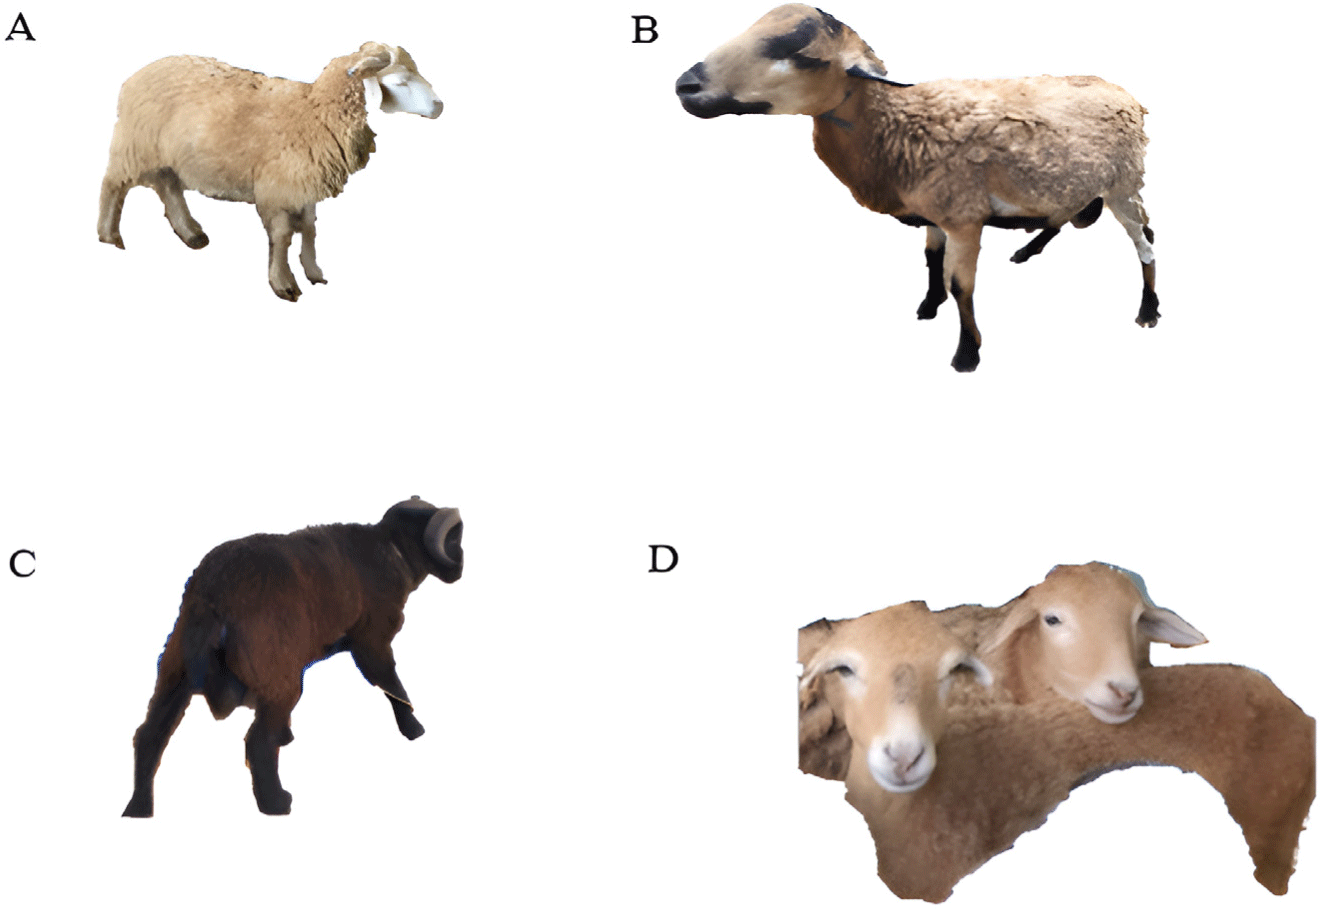
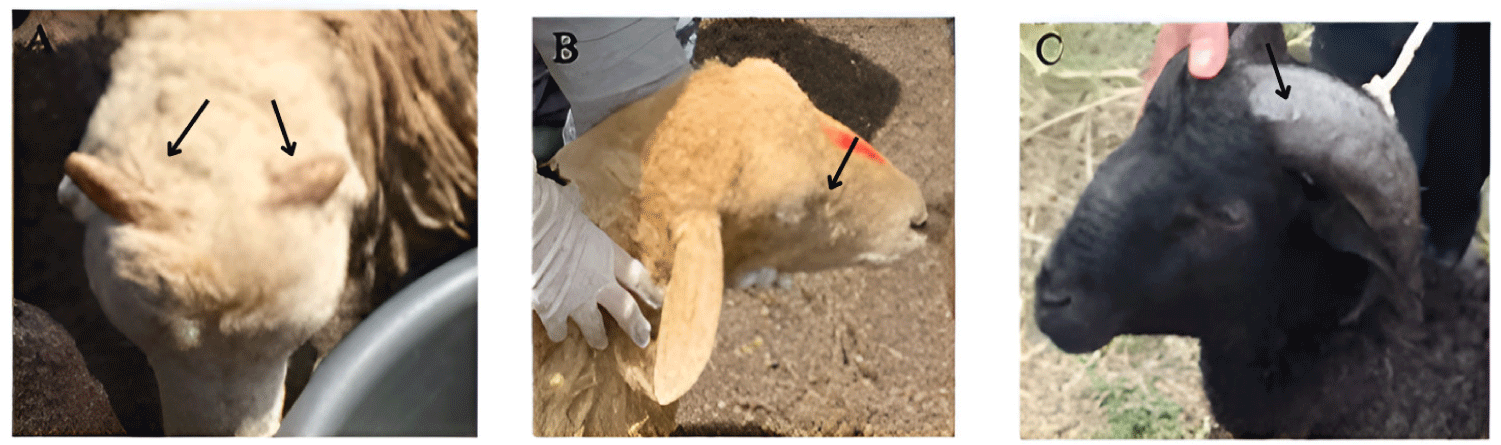
Table 6 lists all imputation models. Model1 is the full model that involves four predictors (linear body measurements, states, districts, and sex); Model2 consists of three predictors (without districts), whilst Model3 is the simplest model with only two predictors (linear body measurement and sex). In Table 6, Model1 showed the highest R2 value (R2 = 0.7123) and the lowest AIC number (AIC = 964); however, Model1 underestimated a few BW readings for adult sheep (weight < 12 kg) shown in Table 7. Model2 had an intermediate R2 value (R2 = 0.6808) and AIC number (AIC = 975). Both Model1 and Model2 indicated that the linear body measurements making the highest contribution to BW estimates were BL, CC, and HW. In contrast, Model3 had the lowest R2 value and highest AIC number, and only CC contributed to the BW reading with this model.
Estimations for all 13 missing data are shown in Table 7, with a comparison made across three models. Model2 provides the acceptable range of body weight imputed for all Malin sheep individuals, AIC number and R-values, and the significant contribution of all three predictors (body measurements, states, sex). Thus, values estimated using this model are used for downstream analyses.
Shapiro-Wilk normality tests indicated that the data for the majority of linear body measurements were not normally distributed. Therefore, the downstream statistical analyses in the current research adopted a non-parametric statistical approach for analyzing all morphometric traits. These morphometric traits were compared across three states (Pahang, Perak, Kelantan), as shown in the boxplots of Fig. 5. Kruskal-Wallis tests were performed for all traits, separately between females and males. Each morphometric trait showed significant differences (p < 0.05) across all studied populations, except with regard to female BW (p > 0.05). Overall, Malin sheep populations in Pahang exhibited the highest median value for five of the seven morphometric parameters, as compared with Perak and Kelantan: BW (Mdn [J] = 46.75, [B] = 24.5), BL (Mdn [J] = 70.5, [B]=61), CC (Mdn [J] = 89, [B] = 72), HW (Mdn [J] = 55.5, [B] = 45.5), and SC (Mdn [J] = 25.5).
The strength of the correlations between linear body measurements was determined using the Spearman coefficient correlation method (Fig. 6) to identify the best set of morphometric traits for general morphological characterization. No negative correlations were detected. In male sheep, CC and BL exhibited the strongest correlation (ρ = 0.76), which was statistically significant (Fig. 6A). For females, the strongest and most significant correlation was detected between CC and BW (Fig. 6B), with the same correlation value as for males (ρ = 0.76). All pairwise correlation analyses between morphometric traits of male sheep were statistically significant with varied correlation strength, except for correlations between BW-EL, HW-SC, and EL-SC (Fig. 6A). In contrast, female sheep exhibited only one insignificant correlation, between BW-EL (Fig. 6B).
The phenotypic resemblance of individual sheep across populations can be visualized using NMDS ordination plots (Figs. 7 and 8). We used the Malin herd from Jerantut (C-02) within the state of Pahang (refer to Table 3) as a reference population for comparison with other populations because it is a nucleus herd maintained in a proper care and husbandry environment by the NIBV. Fig. 7A shows that in general, there were some overlapping individual animals from all three states. Nonetheless, although two male sheep, each in Pekan and Bera (within Pahang) clustered closely with males in Perak and Kelantan, many individual sheep from Jerantut scattered far to the left of the NMDS-1 axis, indicating that they were phenotypically distinct from the others. One of the morphometric characteristics, BW, which was mapped onto these plots, suggests that those sheep were heavier than the others (Figs. 7B, 7C and 7D).
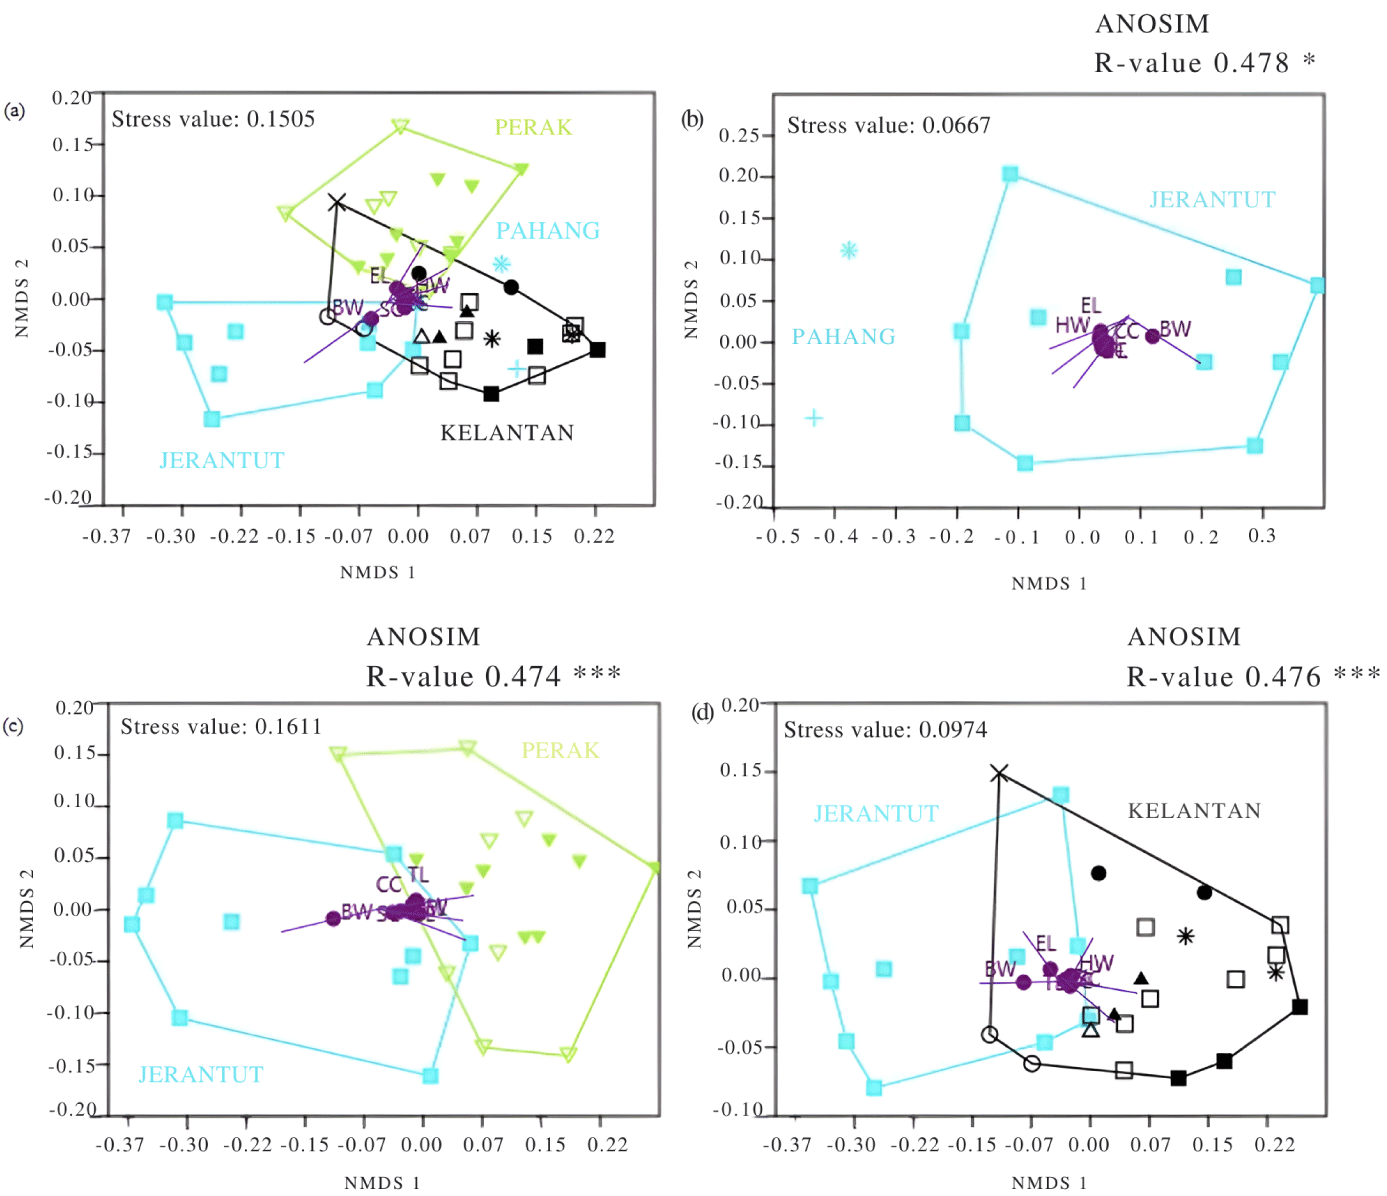
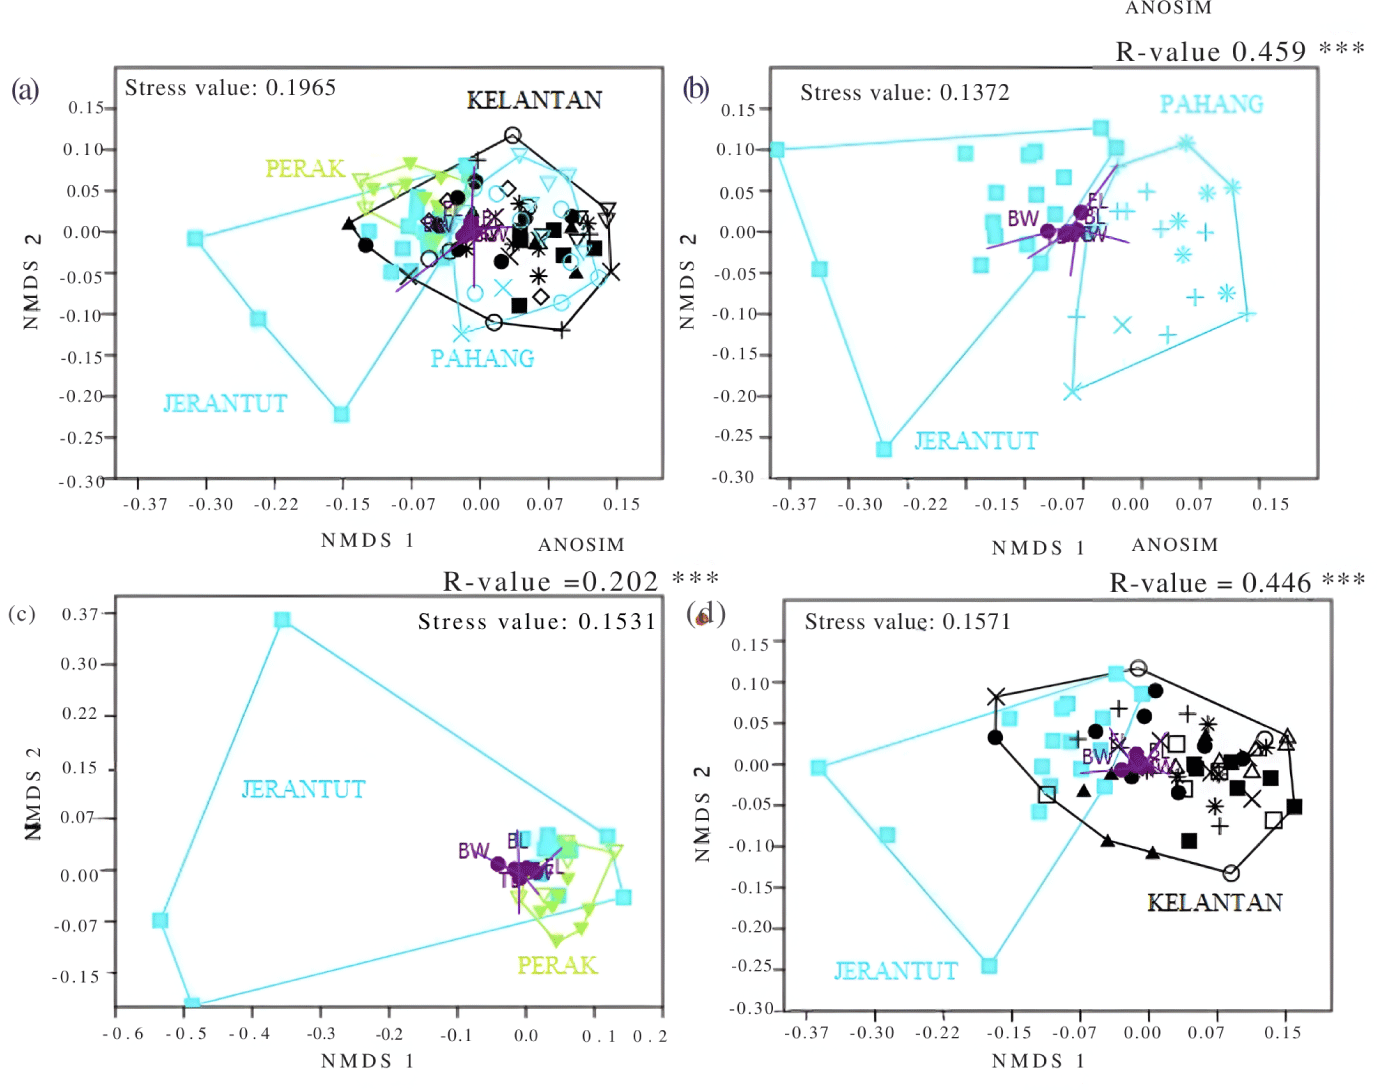
The clustering pattern of Jerantut female sheep shown in Fig. 8 was quite similar to that of Jerantut male sheep, although almost all female sheep grouped closely among each other, regardless of their state of origin (Fig. 8A). Across all other plots, a few females in Jerantut consistently clustered together to the left of NMDS-1 axis (Figs 8B, 8C and 8D). This grouping was again influenced by BW, suggesting these animals were heavier. In Fig. 8C, Perak female sheep were scattered close to the Jerantut females at the far right of the NMDS-1 axis, whereas only a few Kelantan sheep were close to Jerantut (Fig. 8D). In contrast to Pahang, there was no single overlapping, and all sheep showed diverged clustering from Jerantut female sheep (Fig. 8B). ANOSIM revealed that comparisons for both males and females were statistically significant, with all R-values < 0.5.
Cumulative SIMPER analysis showed three variables of male sheep (BW, CC, and BL) and four variables for female sheep, BW, CC, BL, and HW, were the greatest contributors to the percentage of differences between the population in Jerantut and other studied locations, as indicated in Table 8.
DISCUSSION
Phenotypic characterization of farm animal genetic resources for food and agriculture (FAnGR) involves the systematic documentation of observed characteristics of breeds, their geographical distribution, production environments, and use of resources [5]. Comprehensive data on the distribution of Malin sheep populations, the adaptive capacity of breeds, and their management could provide an indication of the range of options available in terms of the genetic diversity of Malaysian small ruminants, yet the paucity of available data hinders these overall aims.
According to Mastura et al. [7], Malin sheep populations can be found in Kelantan, Terengganu, Pahang, and Negeri Sembilan. However, our recent findings indicate that Malin sheep populations are distributed in different states: Kelantan, Perak, Pahang, Johor, Melaka, and Kedah. In addition, recent information from the DVS showed no Malin sheep populations in Penang, Sarawak, and Sabah. These differences highlight the importance of collecting and regularly updating livestock information, which is a prerequisite for sustainable management of animal genetic resources [32]. We also reported that overall, Kelantan has the highest number of Malin sheep. This finding is in agreement with the report of Syamsul et al. [33], which described Kelantan as an agrarian state in which almost all herders have small livestock farms that contribute to economic growth within the east coast region of Peninsular Malaysia. Furthermore, a Malin sheep population has been maintained in Kelantan since 1980 according to an FAO report [34]. Very small Malin sheep populations (less than 50 animals each) are also found in Melaka and Kedah, though this might be due to the limited information and survey.
Our sampling effort found that the Malin farm (C-02) in Jerantut, Pahang, has the highest number of sheep, whereas the average size of other herd populations maintained by smallholders is fewer than 30 animals. The C-02 farm is maintained by the NIBV and monitored directly by the federal DVS. Farm C-02 is the nucleus group center for the Malin sheep breed and plays an important role in conserving and enhancing genetic quality [7]. While the population size of this nucleus herd is adequately documented, records for Malin herds maintained by smallholders in other locations are also necessary in order to plan further actions. Each Malin herds from smallholders across the country has the potential to be used as Farm Animal Genetic Resources (FAnGR) to ensure food security and maintain genetic diversity. However, effective management of FAnGR requires comprehensive knowledge that includes demographic data linked to the size and structure of the population [35]. Compared to census population size, Ne is the preferred measure for the assessment of the risk status of livestock breeds since it is approximated based on the number of both breeding female and male individuals; therefore, it allows the rate of inbreeding or loss of genetic diversity within the population to be inferred [36,37]. We must emphasize that the calculated Ne values across the populations nationwide in our findings provide indications of a concerning trend that could jeopardize biological conservation of the Malin breed.
Husemann et al. [37] reported that Ne is a vital genetic population and biological conservation indicator, as it directly translates overall population size to ideal population size by showing the loss of genetic variation at a similar rate within the same population. Most Ne values are lower than the actual population size. Several factors contribute to low Ne values, such as an imbalance between male and female sheep, non-random breeding, and differences in population size by generation [38,39]. The smaller the Ne value, the lower the variation in genetic traits inherited by subsequent generations. Ne can be considered the primary indicator for monitoring the extinction risk of an animal group based on the range of Ne values [40] as practiced in certain countries including UK [41], Germany [42], and Poland [43]. The overall Ne value for Peninsular Malaysia determined based on data from all sampling locations was 177, which fell between 50 and 200, indicating that the breed is threatened and that the Malin populations need additional conservation action [43]. Proper action, such as systematic management practices and regular monitoring, should be continued.
Because most livestock animals do not have pedigree information or are not intensively studied, estimating the Ne value can be carried out without the need to calculate the inbreeding value within an animal population [40]. Given its risk status, the animal husbandry and production systems for Malin herds kept by smallholders need upgrading to ensure proper care and the long-term sustainability of this native breed. Therefore, thorough surveys that evaluate the actual population sizes and then deposit these data into the Domestic Animal Diversity–Information System (DAD-IS) are warranted.
Phenotypic features of Malin sheep suggest their diversity and adaptability
Numerous studies have reported the phenotypic diversity of sheep breeds other than Malin (e.g., [17,44,45]. Recording morphological traits such as WC aids in the identification process and breed characterization [46]. Variations in morphological traits are likely affected by breed characteristics, geographical distribution, and the local environment [47], as well as the livestock management system. Factors such as body size, growth rate, and breed type are commonly considered in animal selection [48]. In addition, BW and SC are essential indicators in selecting sires, as these traits are associated with genetic and reproductive fitness [48,49].
The current study characterized additional phenotypic and morphological features of Malin sheep both qualitatively and quantitatively. There was no specific method for quantification of WC intensity in this study. However, Lb and cream color were the dominant and most frequent colors of Malin sheep wool, in agreement with a report by Mastura et al. [7] on NIBV Malin. The dominance of Lb color suggests that a recessive gene controls the darker color. According to Kalds et al. [50], the Agouti gene (ASIP) controls the expression of yellowish color through the white or tan (AWt) dominant allele (due to phaeomelanin), whereas the recessive allele (Aa) controls expression of the brown and black WC through eumelanin. This coat color explains the connection to the animal’s ability to adapt to environmental stressors, including heat stress, flies, and lice perch [47,51]. The coarse WT observed with Malin sheep in the present study is similar to that reported for other breeds, such as Ethiopian Menz sheep [52] and Garole sheep in India [53]. Although the wool of Menz and Garole sheep is utilized for crafts, the wool of Malin sheep is considered less profitable [12], which has contributed to the lack of interest in this breed among commercial livestock farmers.
Other features, such as HP and the HS provide information as to whether the observed trait represents a primitive or adaptive response to the local environment. For instance, a straight HP is a primitive characteristic trait [44]. In previous studies, Malin sheep populations exhibited only a straight HP [34]; however, the present study observed the presence of a smaller proportion of Malin sheep with a convex HP, likely due to environmental adaptation. Our findings suggest that most Malin sheep still express these primitive features, whereas the majority of other sheep breeds exhibit a convex HP [45,54,55], perhaps as a result of years of domestication. Another feature impacted by domestication is HS, which has undergone so-called miniaturization, as the horns of modern sheep are shorter than those of their wild sheep ancestors [56], making them easier for humans to handle [57]. Horns are typically used by the animals as a shield in combating predators or enemies.
Phenotypic characterization based on livestock observable attributes help to identify and document diversity within and between breeds [18]. Multivariate analysis on body conformation and morphological traits can be performed to evaluate these variables simultaneously and determine any differences of groups and/or breeds, thus further provides support for conservation program [18,26,28].
By examining morphometric traits, we found marked differences between the groupings of the NIBV nucleus herd and other Malin sheep populations in graphical plots. These differences are likely related to two primary factors: (i) inbreeding and (ii) low nutrient consumption. Even though the specific mechanisms by which inbreeding affects a breed’s genetic morphometric characteristics remain unknown, several studies have reported the impact of inbreeding on livestock linear body measurements. Research based on data collected over a 38-year period showed that HW readings in Sardinia Anglo-Arab horses declined from 163 cm to 161 cm [58]. Another study on Hostein-Friesian cows that were inbred for 25 years reported decreases in BW, HW, BL, and CC values. An experimental study by Cerna et al. [59] reported that inbreeding negatively affected BW after 100 days in the Czech Republic sheep breed.
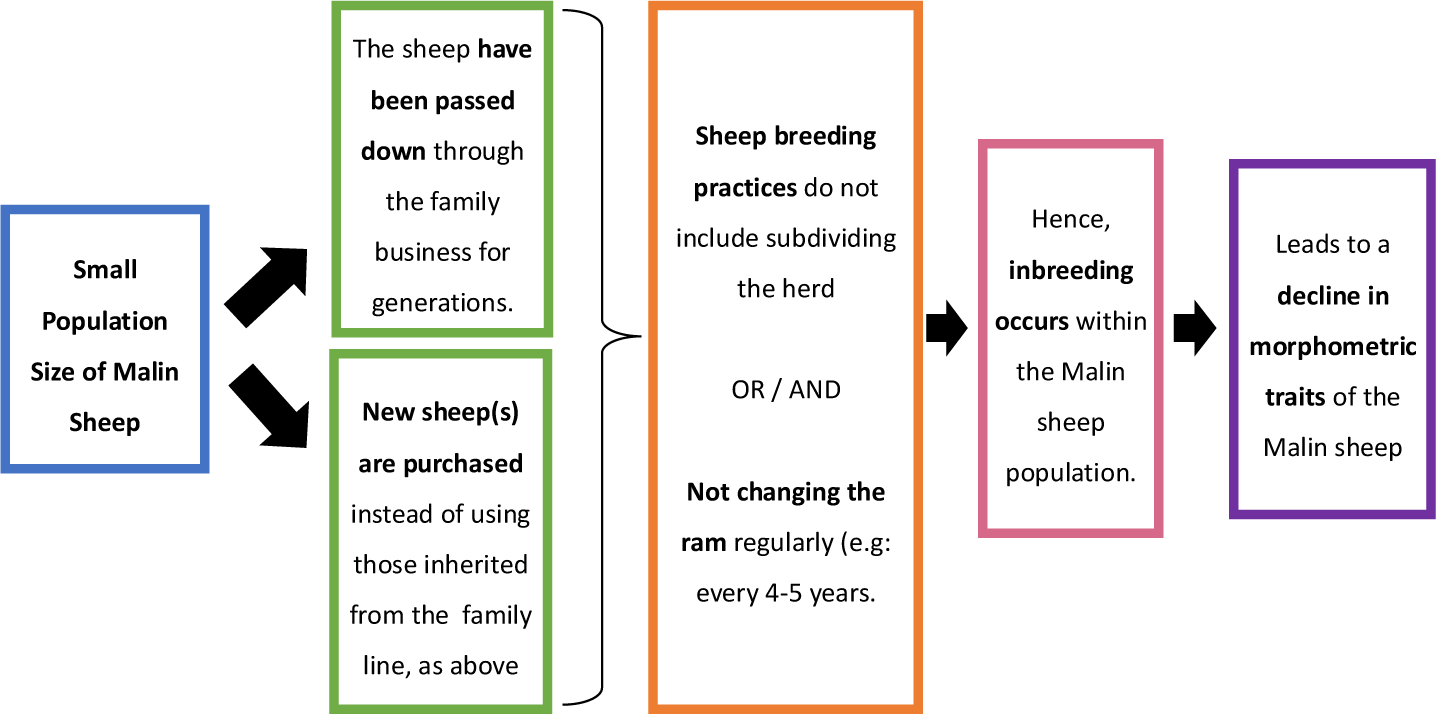
Due to poor livestock management methods, we suspect that inbreeding is an ongoing issue among Malin sheep maintained by smallholders. In support of this hypothesis, the flow chart shown in Fig. 9 explains the causes that eventually led to inbreeding in the Malin sheep populations. In particular, many herders repeatedly use the same rams and breed them with genetically related ewes, without keeping any pedigree records. Changing the ram every 4 to 5 years is crucial for preventing inbreeding in sheep populations [60]. The situation is further exacerbated by the poor nutrient content of the sheep diet, as many animals freely graze in the surrounding area. Nevertheless, we were surprised to learn that most Malin sheep examined in our study were healthy, and the ease of caring for these animals is one of the main reasons smallholders keep Malin sheep.
Although our recent findings offer updated, comprehensive data for the Malin breed compared with previous research, there are still limitations that should be addressed in future studies. Initially, our sampling plan was to include the Johor state in order to represent the southern region and other districts by considering the Titiwangsa Mountains range, which forms the backbone of Peninsular Malaysia. However, the COVID-19 pandemic affected the initial plan and introduced logistical challenges. It is also imperative to revisit the Malin population in Pahang, which had missing data that had to be estimated using the imputation method to avoid under- or overestimation; such data could impact further management actions. Collection of other data related to production traits and growth rates would also be beneficial in achieving better, systematic livestock management to prevent loss of genetic diversity and preserve this invaluable biological heritage.
CONCLUSION
Regular inventories and field surveys of Malin sheep, including phenotypic characterization and analysis of geographical distribution throughout Malaysia, can add new information, indicate risk status, and ensure this breed’s welfare. Differences in surrounding environments and management practices that contribute to variations in phenotypic traits and extreme discrepancies in morphometric features shown by Malin sheep need to be recorded and addressed accordingly. Inbreeding and inefficient sheep management practices can hinder conservation and rehabilitation of Malin sheep; however, with proper and resourceful animal husbandry practices, Malin sheep, as shown by the NIBV, could exhibit morphometric characteristics that make them commercially desirable. By applying these strategies, sheep populations maintained by smallholders can provide a range of options to help ensure the sustainability of Farm Animal Genetics Resources for both global and local livestock industries.