

INTRODUCTION
Major histocompatibility complex (MHC) B diversity can be evaluated using microsatellite markers in MHC gene regions. The degrees of variation and polymorphism differ depending on the location of markers within the MHC region. Markers located near or within most polymorphic regions, such as Class I and II, provide more information regarding polymorphism content and allele diversity than those in the lower diversity MHC gene regions. The chicken LEI0258 marker exhibits high allele variation and is linked to the MHC-B locus; some of its alleles are correlated with MHC-B serological haplotypes [1]. Moreover, the relationship between the LEI0258 marker and previously defined MHC Class I (BF) haplotypes in the blue-egg Caipira chicken shows strong genetic disequilibrium. This marker has been associated with disease resistance, production, and reproduction traits in various chicken populations [2–4]. These findings suggest that LEI0258 can serve as a valuable and affordable genetic marker for investigating MHC genetic diversity in chickens. LEI0258 is a variable number tandem repeat (VNTR) marker characterized by two repeat sequences of 13 bp (ATGTCTTCTTTCT)n (R13) and 12 bp (TTCCTTCTTTCT)n (R12). The allele size of this locus is primarily determined by different combinations of the R13 and R12 repeat motifs. However, additional polymorphisms in the flanking region contribute to greater allele variation in this marker with similar or different repeat motif combinations. Recombination at the B-BNT gene also may contribute to this locus’s evolution [5].
More than 50 different allele sizes (variations in length) have been reported for LEI0258 in diverse chicken populations, including breeds from Asia, Africa, Europe, and North and South America. A broader allelic range (182–552 bp) has been identified in many chicken breeds through either polymerase chain reaction (PCR)-capillary electrophoresis (CE) or PCR sequencing [1,5–11]. The number of alleles and the allele size range considerably vary among breeds; these differences may contribute to breed-specific characteristics due to unique allele counts and structural mechanisms.
The allele detection method (e.g., CE or Sanger sequencing), along with the genotyping instruments and size standards (500 Liz and 600 Liz), can result in different allele sizes. Unlike other microsatellite markers, LEI0258 fragment size primarily varies due to the gain or loss of 12 or 13 bp repeat motifs. However, alleles with 1–8 bp differences, caused by deletions upstream or downstream of the LEI0258 repeats, have also been identified. Due to the subjective nature of the microsatellite allele binning process, alleles identified in one population might be reported as different alleles in another population, misrepresenting the diversity of this marker.
Sequencing of the alleles provides their exact size (bp) and reveals additional polymorphisms, such as single-nucleotide polymorphisms (SNPs) and insertions or deletions (indels). Thus, comparing alleles identified by CE with those determined by PCR sequencing validates allele sizes across global chicken populations. Despite these efforts, this marker remains uncharacterized in numerous breeds, suggesting greater allele diversity in LEI0258. Therefore, this study investigates reported Sanger sequences of LEI0258 alleles from Asian, African, and North American chickens, along with those from our study populations, to summarize the global allele distribution and diversity of LEI0258 marker. Allele variation was examined in terms of fragment size (bp) and variants (repeat copy numbers, unique combinations, SNPs, and indels), and the underlying evolutionary mechanisms. This information will assist researchers in studying this marker in new chicken populations by providing clarity with respect to correct allele sizes.
MATERIALS AND METHODS
The sequence data for this study consisted of two sources; the first data set was obtained by re-sequencing 59 homozygous samples corresponding to 21 fragment sizes from South Korean, Bangladesh, and Sri Lankan local chicken populations [12]. Sequences of each sample were obtained using the primer pair (CAJF01F) 5’-TCGGGAAAAGATCTGAGTCATTG, and (CAJF01R) 5’-TGATTTTCAGATCGCGTTCCTC [6]. These primers cover the region that flanks the primers generally used for PCR-CE of the LIE0258 locus [6,7]. Therefore, the exact allele size (bp) can be obtained by Sanger sequencing its forward and reverse strands.
The second sequence data set included 562 sequences retrieved from the NCBI database, with GenBank accession numbers. These include commercial and standard chicken breeds in North America [6], Asian chicken breeds [5,7,13,14], and African chicken breeds [15,16].
The number of total, common, and population unique alleles (private alleles) was analyzed and visualized using GenAlEx and R ggplot2 package [17].
The sequences were edited using the BioEdit sequence alignment editor [18] and aligned using the Clustal multiple aligned option in MEGA7 software [19]. The copy number of repeats of R13 (“ATGTCTTCTTTCT”) and R12 (“TTCCTTCTTTCT”) were counted. As LEI0258 is a compound of R13 and R12 repeats, respectively, all possible repeat copy combinations were summarized. To identify polymorphisms in the regions surrounding the repeats, the flanking sequences were defined based on the coverage provided by the LEI0258 sequencing primers (not the conventional genotyping primers) [6], which span the whole LEI0258 marker region. Accordingly, the upstream flanking region was defined from position –1 to –64, and the downstream region was defined from position +1 to +88, including the last R12 repeat. SNPs and indels within these defined flanking regions were detected using DNASP6 software [20].
Repeat combinations and flanking sequence polymorphisms (SNP and indels) were identified using sequences corresponding to 90 fragment sizes (182 to 565 bp) from African, Asian, North American, and commercial chicken populations. Within each population, 100% identical sequence of each allele was removed to avoid redundancy. Therefore, at least one sequence for each fragment size was kept. Occasionally, fragments of similar sizes with a different flanking sequence identity and repeat copy numbers were included for the analysis.
Evolution relationships between alleles were analyzed based on the indel variations and SNP polymorphisms in the upstream and downstream of the repeat region. Flanking sequence polymorphisms, both indels and SNPs were converted to binary values. Alleles were grouped based on the sequence identity and segregation points. Relationships were visualized using a Neighbour-joining network tree analysis in the SplitTree program [21].
To establish a relationship between allele size and repeat motif combination, exploratory analysis focusing on the copy numbers of the R13 (“ATGTCTTCTTTCT”) and R12 (“TTCCTTCTTTCT”) motifs in relation to allele sizes (measured in base pairs). The copy numbers of each motif were manually determined from aligned sequences, while allele sizes were derived from sequencing data. Two primary analyses were conducted: 1. The correlation between R13 and R12 repeat numbers, aimed at evaluating whether the two motifs exhibit co-variation; and 2. The relationship between total repeat copy number and allele size, intended to assess whether repeat expansion contributes to increased fragment length. Scatter plots were generated to visualize these relationships both across the entire dataset and within individual populations. While no formal hypothesis was conducted, the Pearson correlation coefficient was calculated and used as a descriptive measure to indicate the relative strength of the association between the variables. These analyses were intended to provide an initial, qualitative understanding of the potential correlations rather than definitive statistical conclusions.
RESULTS
The global diversity of LEI0258 allele sizes and repeat combinations was analyzed via sequencing. Eighty-eight allele sizes, ranging from 182 to 565 bp, were identified. Asian chicken populations exhibited the highest allele diversity, with 63 of the 88 alleles. African chickens had 56 alleles, whereas North American standard and commercial breeds had only 28 alleles. All three populations shared 19 allele sizes; in terms of private alleles, 23 were detected in Asian breeds, 20 were observed in African breeds, and only five were found in North American standard breeds (Fig. 1). The wide range of LEI0258 allele variation has important applications in population genetics, breed differentiation, and the preliminary characterization of MHC diversity, offering a valuable tool for selective breeding, conservation programs, and potential association studies targeting disease resistance and production traits.
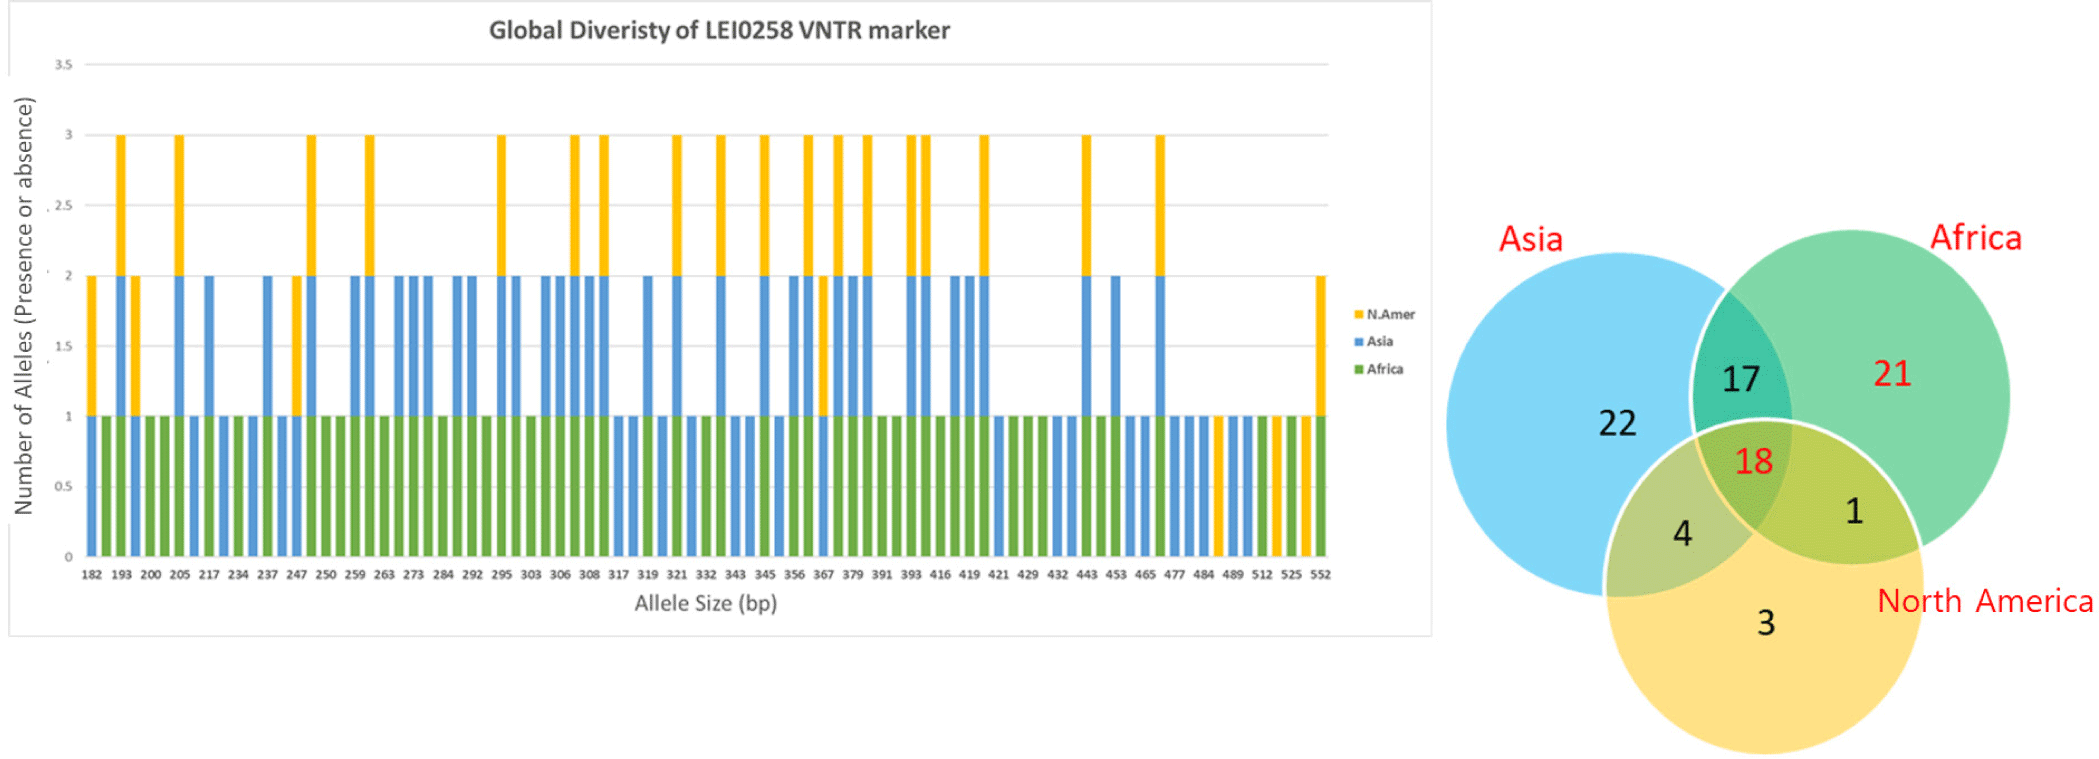
American and European chicken populations display lower diversity because they have been selectively bred for economically important traits or to maintain specific MHC alleles. These experimental populations, selected for serologically known MHC alleles, and the purebred standard populations [6], exhibit limited genetic variability compared with local chickens due to their small population sizes.
PCR fragment size significantly varied due to combinations of the R13 and R12 repeat elements. The numbers of R13 and R12 repeat copies varied among allele sizes and populations (Table 1). In the first Asian chicken dataset, 21 LEI0258 allele sizes were observed, including four different R13 repeats (1, 12, 15, and 22 copies) and 15 different R12 repeats (3, 4, 5, 7, 8, 9, 11, 12, 15, 16, 18, 20, 21, 25, and 27 copies). Almost all repeat copies were consistent with previous reports [6,7,9,13,22].
Seventeen different combinations of R13 and R12 were identified in this dataset. Fourteen contained a single copy of R13 but exhibited varying R12 copy numbers according to allele size. One new combination (R13 = 1, R12 = 25) was identified in the Korean native chicken with a 465 bp allele.
Considering the entire dataset, 18 different variants in R13 copies and 26 different variants in R12 copies were identified. The range of R13 copy numbers (1-29) was consistent with previous reports, although 11 of these copy numbers were not found in any of the populations studied. A single copy of R13 was the most common; 55% of all combinations contained one copy of R13. The number of R12 repeats ranged from 2 to 28 copies, which exceeds the range of 2-20 copies [6]. All possible R12 copy numbers were observed, except for 23 copies.
Higher combinations of R13 and R12 repeats (48 combinations) were identified across all three populations. Notably, each population displayed unique distributions of repeat copy numbers (Table 2; Figs. 2A, 2B, 2C, and 2D). Some of these combinations were common across all three populations or shared between Asian and African, or Asian and American chickens.
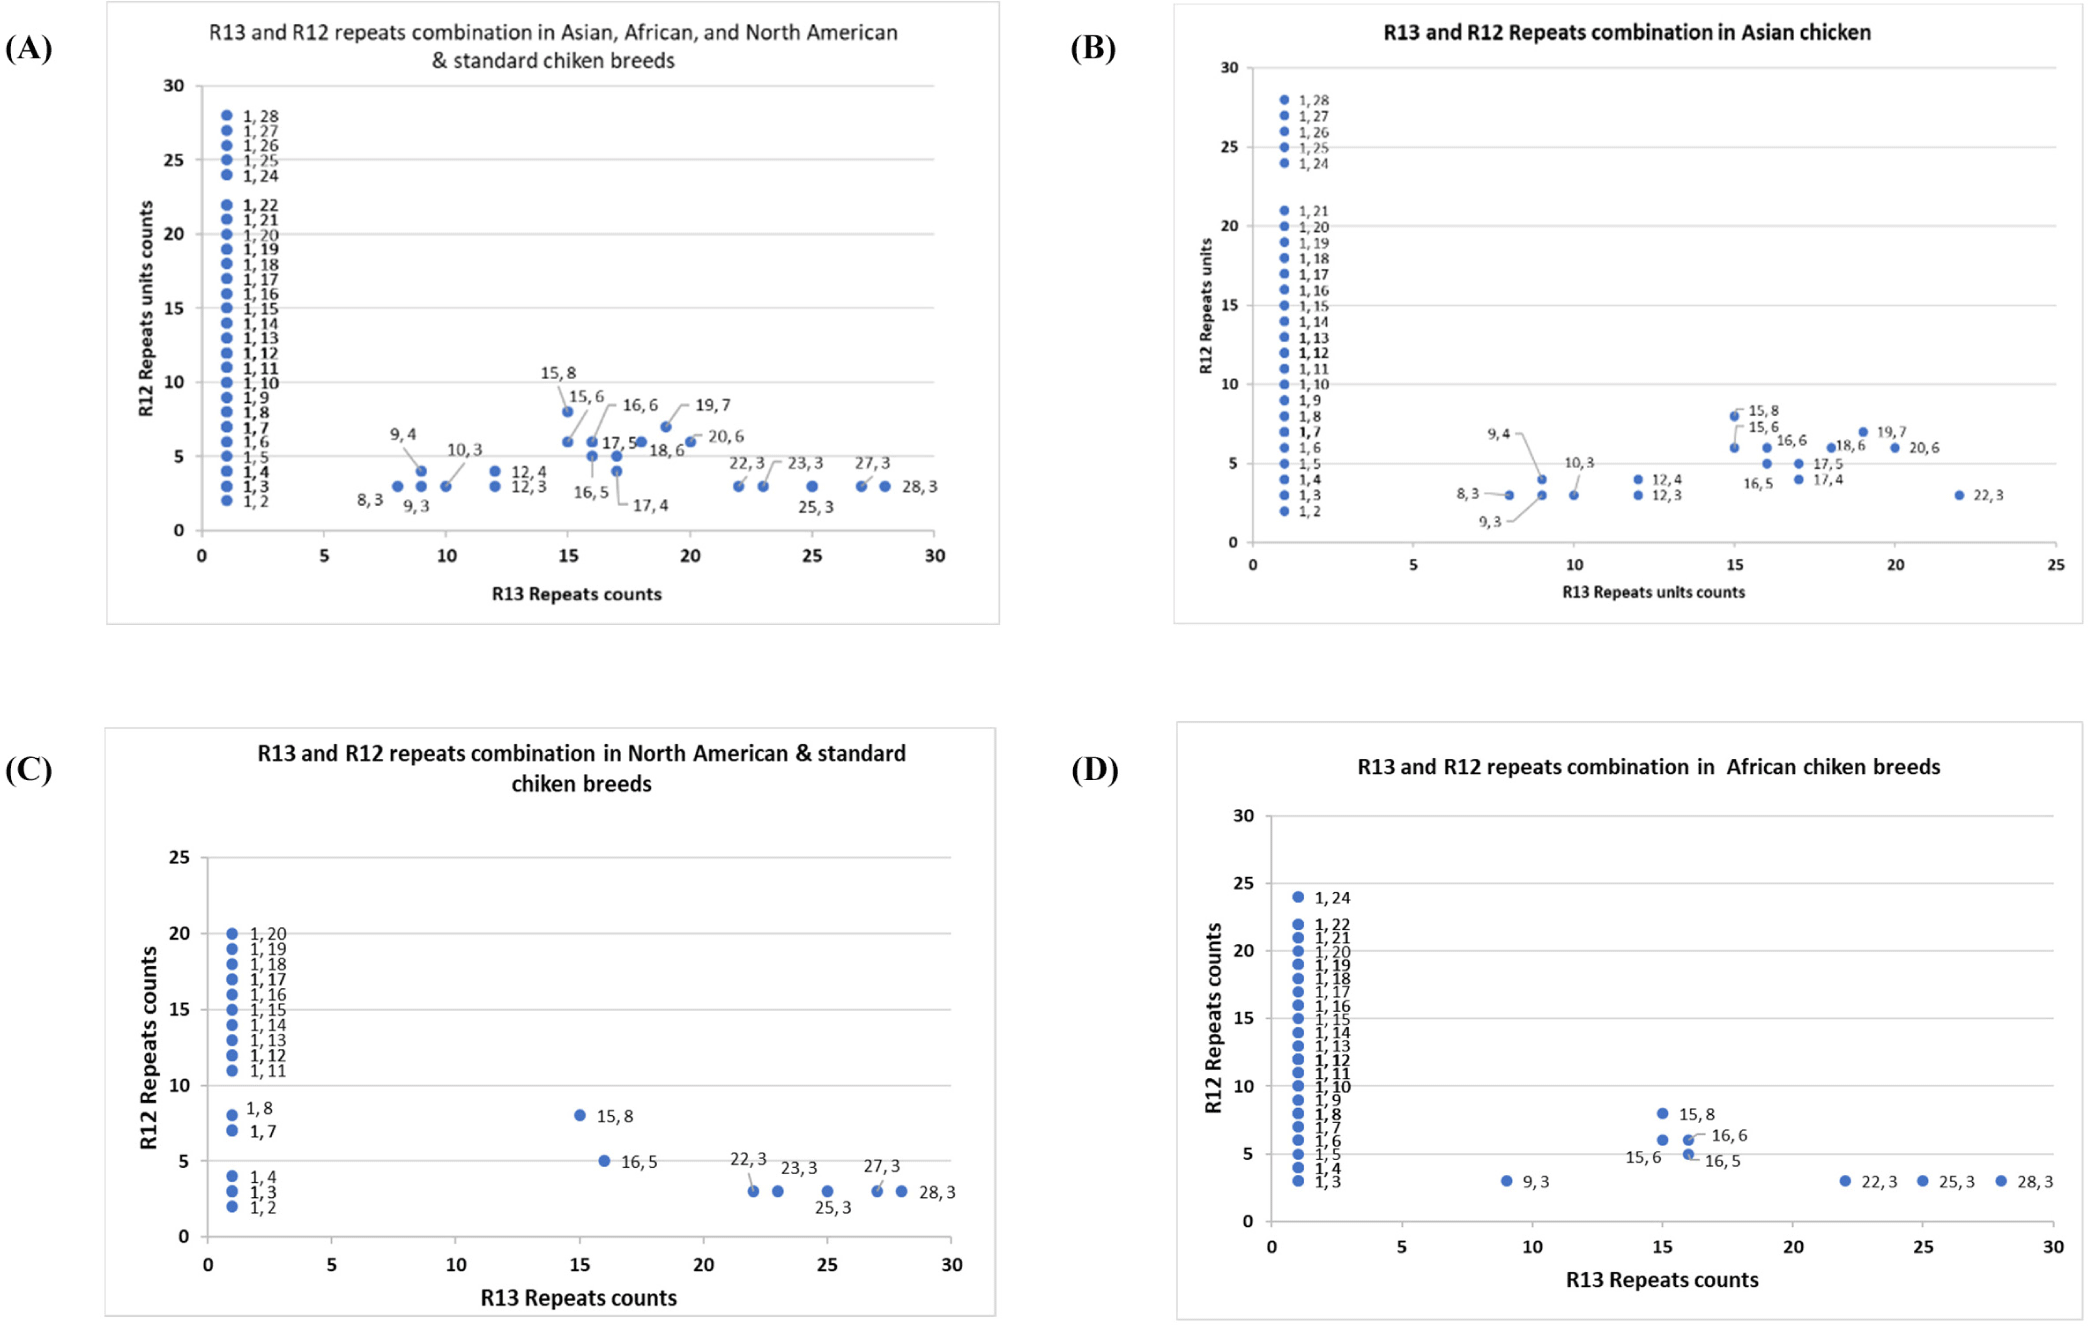
Missing alleles in North American chickens, particularly those with the 1-3, 1-9, 1-10, and 1-24 combinations, might be present in other populations [6]. All of these alleles and repeat possibilities were found in Asian and African chickens.
Sixteen new repeat combinations (1-25, 1-26, 1-27, 1-28, 8-3, 9-4, 10-3, 11-3, 12-3, 12-4, 17-4, 17-5, 17-6, 18-6, 19-7, and 20-6) were exclusively present in Asian chickens (Fig. 2 and Table 1); the 22-3, 25-3, 27-3, and 28-3 combinations were not observed in Asian chickens. However, these combinations were found in American and African chickens. The African chicken population examined in this study did not exhibit any unique combinations of R13 and R12; one unique combination (27-3) was found in North American chickens, and another unique combination (29-3) was present in commercial chickens.
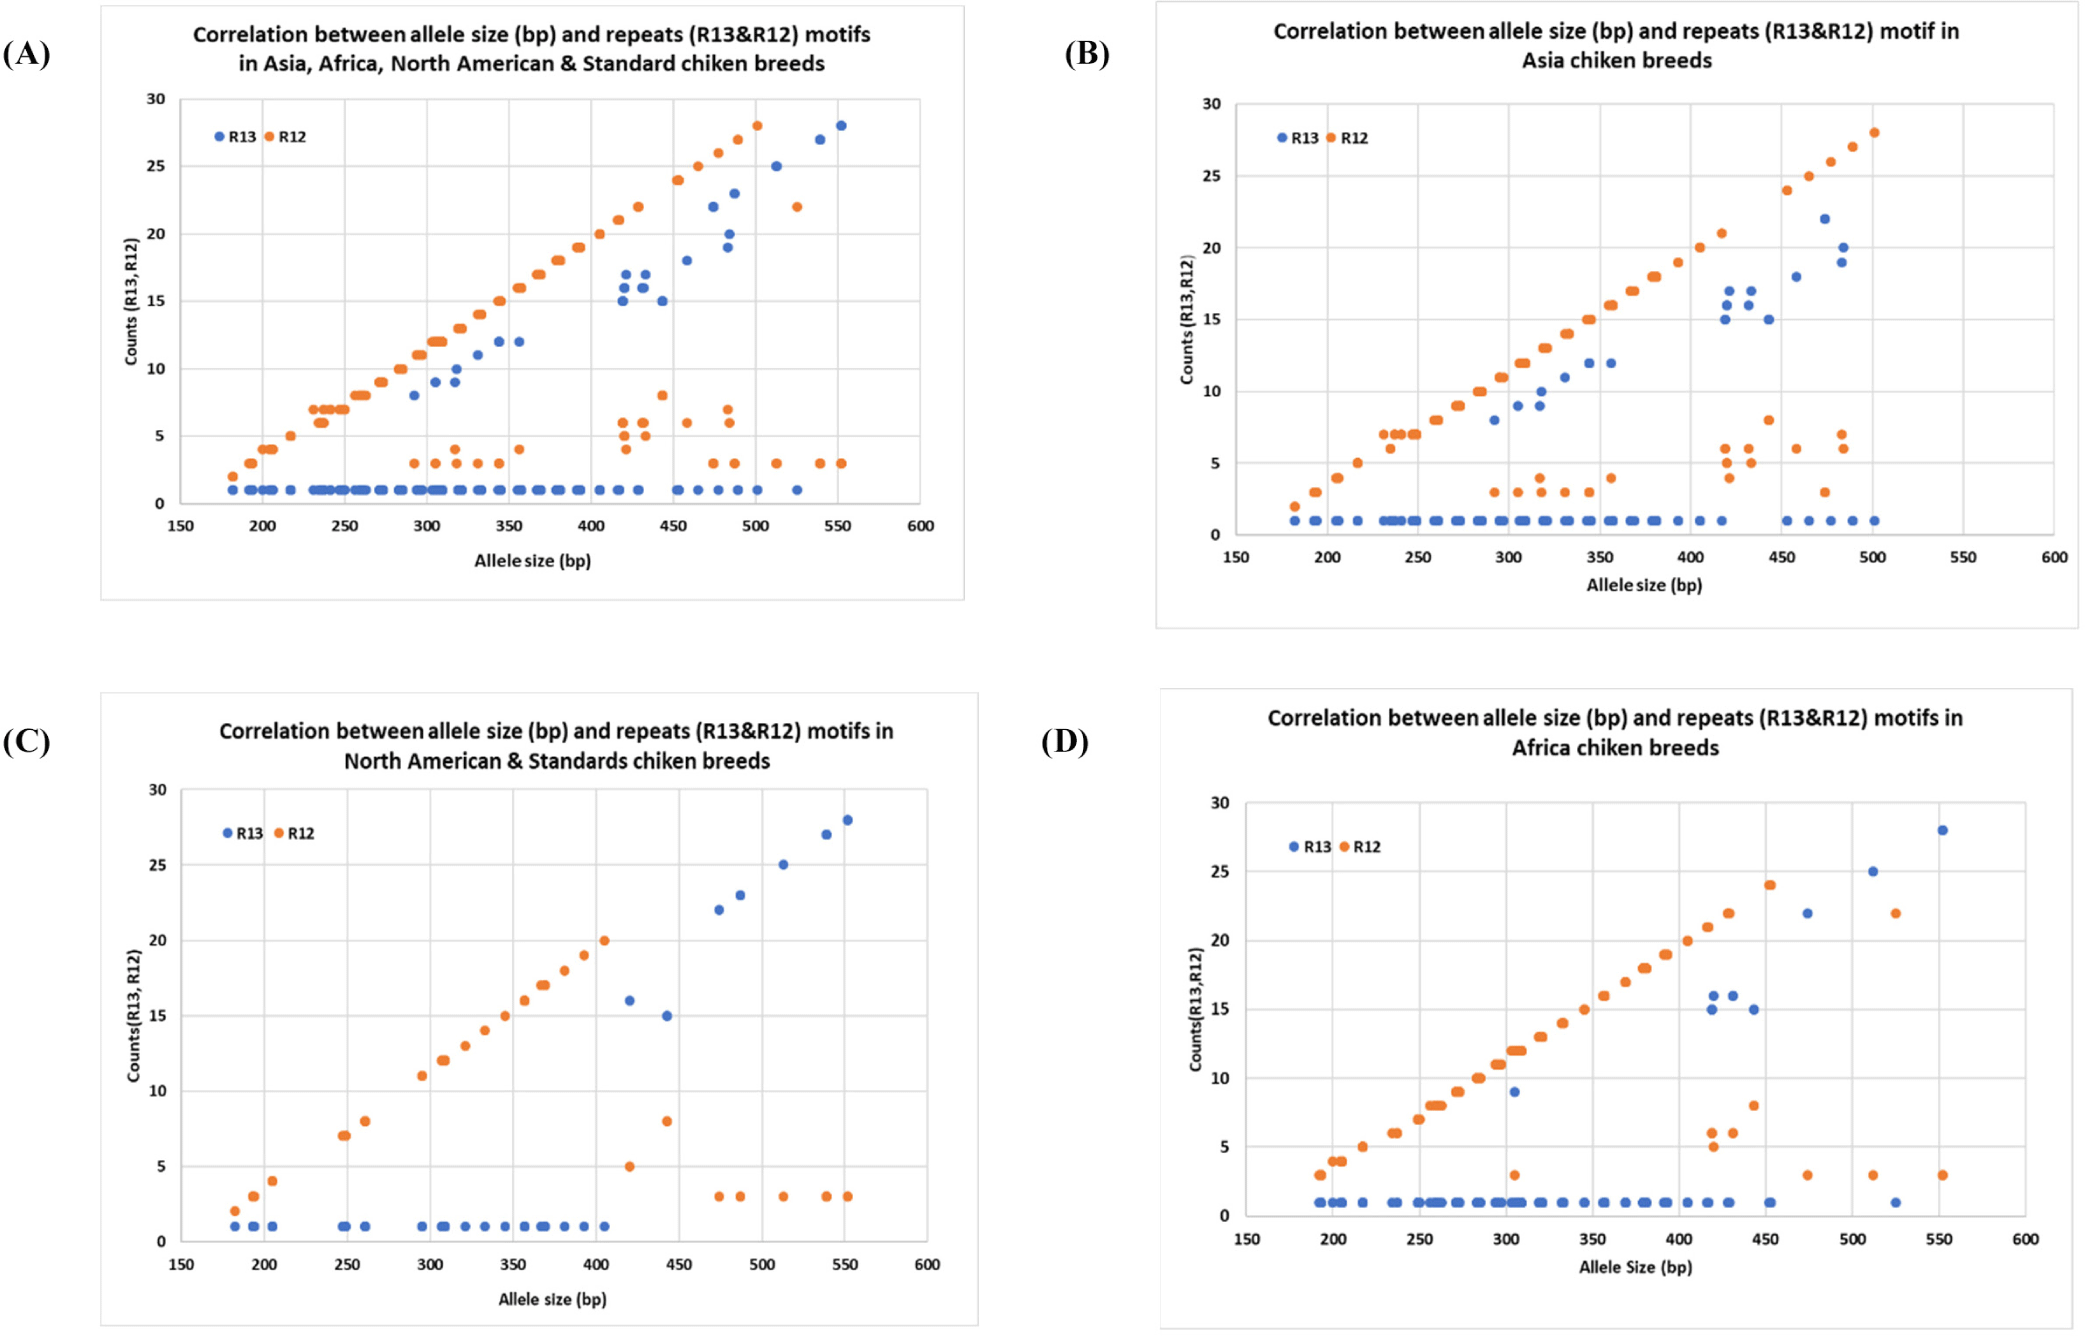
Although many mathematically possible combinations of R13 and R12 motifs exist, only 48 combinations were identified; this number is higher than the 37 that was reported by a previous study [9]. Twenty-six allele sizes had only one R13 repeat with 2-28 R12 repeat motifs (Figs. 3A, 3B, 3C and 3D), comparable to the previous findings [9]. In the Asian, African, and North American populations, this combination displayed a linear relationship with increasing allele size up to certain sizes. However, for at least 23 allele sizes (i.e., 292, 305, 317, 318, 331, 344, 356, 419, 420, 421, 431, 433, 443, 445, 458, 474, 483, 484, 487, 512, 513, 539, 552, and 565 bp), the linear trend shifted, revealing more than eight R13 repeats and various copy numbers for the R12 repeat (2-8). Mutation mechanisms led to allele sizes that differed by only one base but had completely different VNTR motifs. Some of these alleles were private, being unique to specific populations. For example, the 317 bp and 318 bp fragments differ by a single base but have completely different R13 and R12 repeat motifs: 9-4 and 10-3, respectively. Additionally, the 331 bp allele had two different motif combinations in different populations: in the Asian wild red jungle fowl (GenBank accession number: KF535097), this allele had a 1-14 R13/R12 combination, whereas in domestic chicken (GenBank accession number: KX365371), it had an 11-3 combination for the same repeat units. Similarly, the 356 bp allele found in an African breed (GenBank accession number: MG518246) had a 1-16 combination; the same allele in a Chinese chicken breed (GenBank accession number: KX365375) had a 12-4 combination.
A higher rate of polymorphism in the flanking region is also associated with differences in allele size. Evolutionary mechanisms maintaining a fixed number of alleles with greater variation in LEI0258 have been discussed [5]. LEI0258 alleles can have the same fragment size and repeat motif combinations but differ in their flanking sequences; additionally, the same fragment size with different motif combinations is possible.
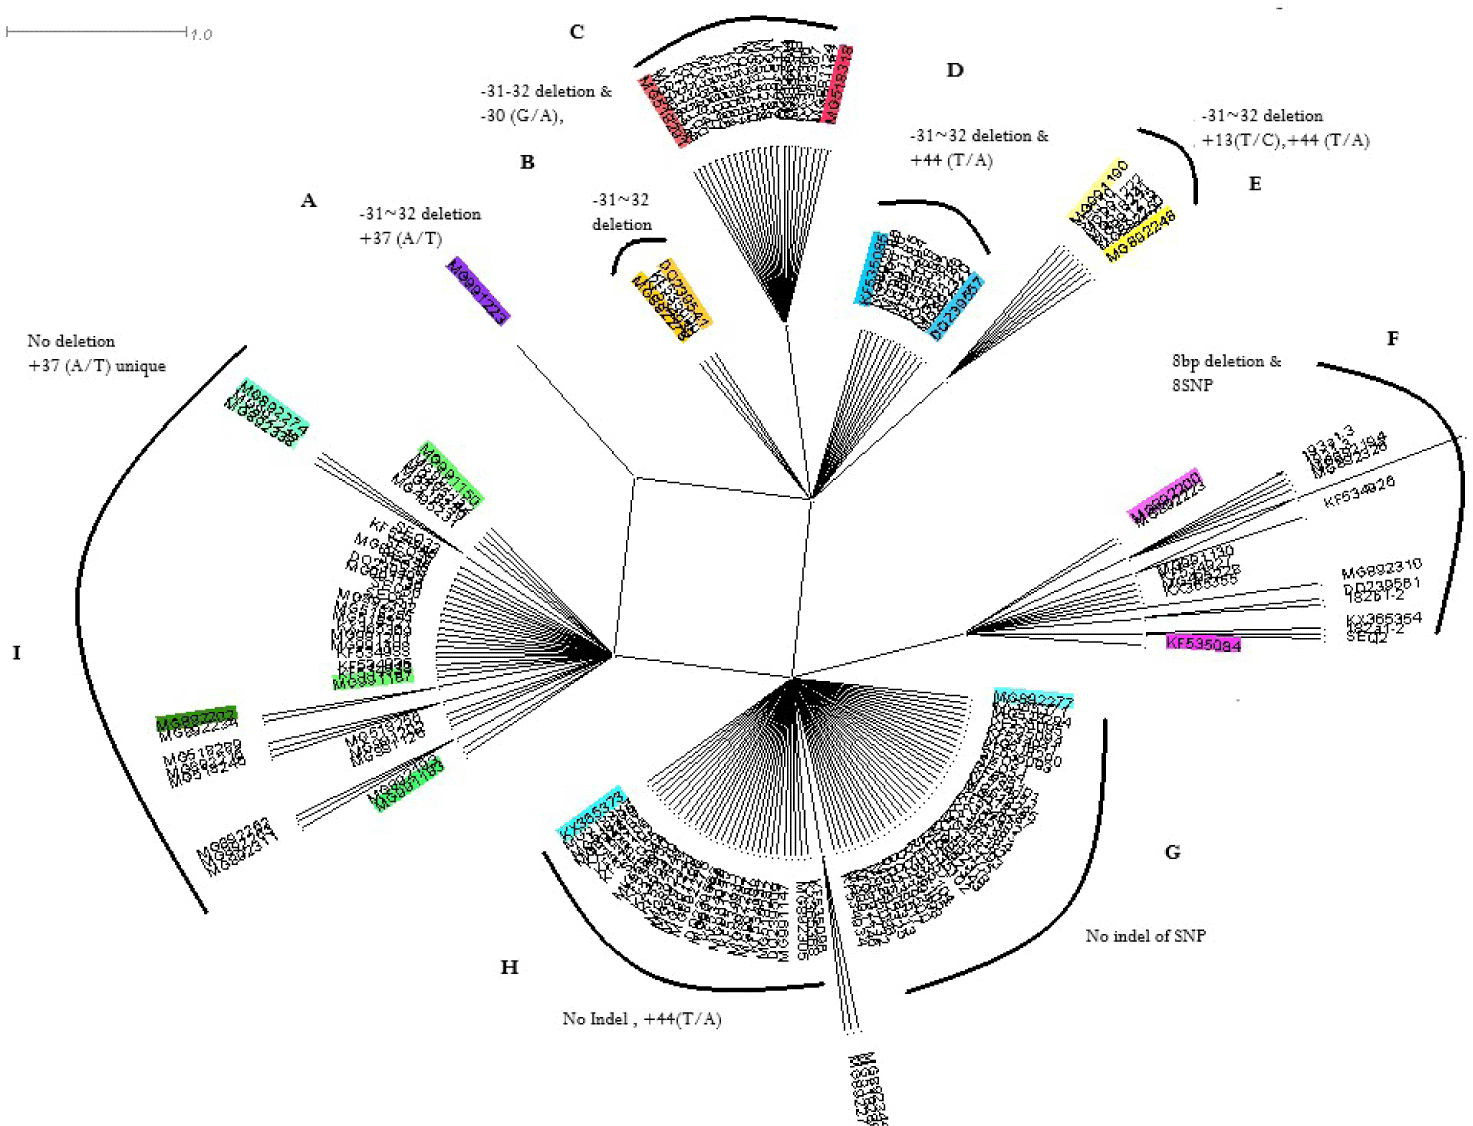
SNPs and indels were observed in the flanking region. Downstream of R12, an 8 bp deletion (“ATTTTGAG”) from +21 to +28, and a 2 bp deletion (TT/∆) at –31 and –32 in the upstream region, are the primary causes of changes in allele size by 2 or 8 bp. For example, a 2 bp deletion in the 309 bp allele creates a 307 bp allele. Similarly, 2 bp deletions in the 381 bp and 285 bp alleles result in 379 bp and 283 bp alleles, respectively. The 8 bp deletion was mostly observed in alleles ranging from 182 to 217 bp and in the 241 bp allele. However, these two mutations were never found together. Moreover, single nucleotide deletions were reported; a few of these were monotonous, whereas the one-base deletion at +31 was more frequent. Five probable SNPs were identified at +3, +13, +31, +43, and +46, along with three SNPs at –12, –30, and –45 (Table 3). Additional allele variation beyond 170 bp, based on the most common flanking sequence variants (SNPs and indels), is summarized in a network tree, which shows that these alleles are divided according to the presence of the main indel variants, whereas the subclusters are due to the SNPs (Fig. 4).
Population used for sequencing: KNC, Korean native chicken; JF, Bangladesh red jungle fowl; NN, Naked neck chicken; CO, commercial broiler; SL, Sri Lankan native chicken; NW, Korean native white line; HI, Bangladesh Hilly chicken; CD, Bangladesh common chicken; AS, Aseel chicken; YO, Yeonsan Ogye; HF, Hanhyup F line.
DISCUSSION
VNTR, in which non-coding DNA sequences are organized as tandem repeats, is among the most polymorphic genomic loci in higher vertebrates, invertebrates, bacteria, and plants. A locus with a 2–6 bp sequence repeat is known as a microsatellite, whereas sequence repeat loci ranging from 10–100 bp are categorized as minisatellites. Although the LEI0258 marker is located in a non-coding region, the interplay between its repeat motifs (R12 and R13) and flanking sequence polymorphisms (such as SNPs and indels) may influence the structural evolution of the locus. This could potentially impact regulatory elements or create a linkage with nearby functional MHC genes, recommending further investigation into its functional significance [23]. While many VNTR markers are considered selectively neutral with no known functional effects, some can influence biological functions directly or are closely linked to important gene regions, undergoing selection through the “hitch-hiking effect” [24,25]. In chickens, LEI0258 is a compound minisatellite marker situated within the B-BTN gene and is linked to the MHC-B complex on microchromosome 16.
Due to the high mutation rates in the repeating and flanking regions of LEI0258 and its significant associations with disease and economically important traits, this VNTR marker is considered highly valuable for the molecular identification of MHC alleles across chicken populations. To date, more than 50 distinct allele sizes have been reported for LEI0258 using CE. Substantially different amplicon sizes at this locus can be separated by gel or CE. Moreover, many of these alleles have been sequenced in at least one population. Comparisons of allele sizes estimated by electrophoresis with sequences of the same alleles have shown small base pair disparities. This size inconsistency ranges from 1 to 20 bp. In addition to indel polymorphisms and the loss or gain of repeat copy numbers that contribute to size differences, external factors such as PCR amplification, genotyping instruments, internal size standards, and allele-calling software may explain these small base pair differences. Therefore, sequencing is necessary to determine whether these allele differences are due to polymorphisms (indels and SNPs) or extrinsic factors.
Sequencing each allele is not always practical or cost-effective for genotyping large sample sizes. LEI0258 exhibits high heterozygosity. If new genotypes or alleles are heterozygous, additional steps, such as cloning, are required before sequencing. When sequencing all alleles is limited, the use of available sequence information and control or known allele sizes is more appropriate in identifying new LEI0258 alleles in any population. Nonetheless, CE is effective when the same DNA analyzer and internal size standards are consistently used, which reduces allele size inconsistencies.
This subtyping system enables the unprecedented differentiation of LEI0258 alleles among numerous chicken breeds worldwide. Asian and African chicken populations include many indigenous breeds. Compared with commercial breeds, Asian, African, and European local breeds show considerable diversity in allele size and a high polymorphism rate in the repeating regions (R12 and R13) [5,9,26]. This reflects the unique genetic variation preserved in Asian and African indigenous chickens.
In contrast, commercial breeds have fewer alleles. Highly selected layer lines have fewer alleles than broiler breeds [12,27]. The North American chicken populations exhibit low diversity because they have been selectively bred for a few MHC alleles and improved for economically important traits. Specifically, the experimental population (selected for serologically known MHC alleles) and purebred [6] displayed limited genetic variability in the MHC.
Measures of allele number or allele richness are more sensitive than heterozygosity to founder events followed by population expansion [28]. Loss of alleles during a founder event reduces allele richness but not heterozygosity [29]. This partially explains the observed high heterozygosity despite the reduction of allele number, which could also indicate a heterozygote advantage, as MHC heterozygotes may recognize a broader range of antigens.
Furthermore, the presence of numerous alleles and their frequencies hold the potential for a response to selection [30–32]. We speculate that the diversity of LEI0258 alleles reflects the immense allele diversity of the MHC region that remains to be discovered in indigenous chickens.
Common alleles are segregated among populations that separated genetically long ago. This phenomenon partially explains the evolutionary stability of MHC allele sizes over generations, given their biological importance in disease resistance. Sequence analysis of these common allele sizes indicates that alleles can differ due to SNP polymorphisms in the non-repeating sequences, despite the presence of identical repeat variations. These observations reflect the parallel evolutionary mechanisms underlying the substantial MHC diversity.
The higher number of alleles (n = 14) shared between African and Asian chickens suggests a historical genetic relationship. However, inferring such genomic relationships using a single gene region is inappropriate. According to the literature, most populations share several common alleles. Theoretically, closely related breeds share many alleles, whereas more unrelated populations likely share fewer alleles but have distinct allele distribution. One population might possess several alleles with high frequencies, while similar alleles may have low frequencies in other populations. This is because the number of alleles, or allele richness, and allele frequencies depend on population size, breeding history, founder effect, and genetic drift. Since MHC allele diversity significantly correlates with the pathogenic dynamics of living environments, selecting alleles and their effects align with the rare-allele hypothesis.
In this study, many rare alleles were found in Asian and African chickens, based on both allele size and polymorphisms in the flanking sequences. Significant negative Tajima’s D values (< 0) supported the observation of an excess of rare alleles. This may be due to the linkage of the target locus with a gene in the MHC-B region or population expansion after recent bottleneck events.
We observed that alleles of similar size but with different repeat motif copy number combinations occurred within the same populations and among distant populations. This could be misleading when discriminating populations based on shared allele-based genetic distance estimation. Similar observations have been discussed [9], suggesting that this is due to homoplasy. The high mutation rate in microsatellite markers is likely responsible for homoplasy, so it can no longer be assumed that alleles identical by state (IBS) are identical by descent (IBD). Therefore, phylogenetic relationships estimated based on allele size similarity or shared alleles at a single locus are not reliable indicators of an IBD relationship.
Several factors affect the mutation rate of VNTR loci. The size of the repeat motif and repeat copy numbers are central because microsatellite mutation is primarily due to intramolecular slipped-strand mispairing (SSM) during replication. Recombination might also contribute to minisatellite mutations during or after replication, in addition to SSM, which is generally responsible for indel mutations. The evolution of the LEI0258 locus aligns with these mechanisms and can be explained by the classical stepwise mutational model (SMM) [33]. Considering that R13 and R12 repeat copy number variation determines the allele size range, the mutation rate of these two repeats is crucial. According to the SMM, the addition or deletion of one unit of R13 or R12 results in an increase or decrease in allele size. It is evident that in all populations, R13 exhibited a lower mutation probability (17 of 29 possibilities) than the R12 repeat unit (25 of 26 possibilities). For example, in the 182–417 bp allele range, only one R13 repeat copy number was observed, whereas the R12 copy number linearly increased. However, this mutation pattern shifted in larger alleles, where the R13 copy number tended to increase while the R12 copy number decreased after the 417 bp allele. Therefore, it remains difficult to explain the mutation rate of compound markers such as LEI0258 solely based on repeat copy numbers and linear or geometric relationships between mutations and allele size. This presents a limitation for automated allele size calling programs (e.g., TANDEM), because the power function relationship is typically applied for microsatellite repeats (di-, tri-, and tetra-nucleotides) to transform allele size into integers. Compound markers with different mutation rates may not perform well under this algorithm.
The evidence for the role of recombination in the evolution of non-coding VNTR loci has been reviewed [34]. Homologous recombination and localized recombination between non-identical homologous alleles of VNTR both occur, resulting in novel allele variation and sequence conversion. Evidence of recombination at the LEI0258 locus using flanking sequences has been studied [5]. Moreover, the butyrophilin-like (BTN) gene cluster in the chicken, where LEI0258 is located, undergoes duplication and gene shuffling events between the BG-like and B32.2-like genes. These events may lead to localized recombination between existing alleles, resulting in novel alleles with new repeat combinations that deviate from the typical pattern of repeat copy number combinations.
SNPs and indel variation in the flanking regions also drive LEI0258 allele variation. We observed alleles with different sizes that had identical tandem repeat copy numbers; the size difference was caused by small deletions in the flanking regions. For example, the 307 bp and 309 bp alleles have identical LEI0258 repeat units but differ by a 2 bp deletion in the upstream region. Similarly, some alleles possessing identical or different LEI0258 repeats have an 8 bp deletion. SNPs in the flanking region generated new alleles, regardless of allele size or copy number variation. However, we identified more alleles based on this flanking variation than previously reported. Previous studies assessing the correlation between the serological B haplotype [6,9] and MHC-B SNP panel-based haplotypes [26,35,36] showed that different B or SNP haplotypes are associated with the same LEI0258 allele (e.g., the 193 bp allele is found in B15.1, B11, and B27). The use of these flanking sequence polymorphism differences may help to determine whether distinct B haplotypes are associated with different alleles at the same LEI0258 loci.
CONCLUSION
Sequence information for the LEI0258 marker from diverse breeds around the world reveals LEI0258 allele diversity and population-specific MHC diversity. Moreover, various mutation mechanisms (SSM, SNPs, indels, and recombination) contribute to this allele variation. Sequence data helps overcome the limitations associated with STR-based subtyping. However, novel LEI0258 alleles might still exist in understudied chicken populations. The comparison of newly detected LEI0258 alleles in local chickens with those in standard chicken populations and reference cell lines exhibiting known MHC-B serological haplotypes could facilitate inferences regarding the MHC serological haplotypes in local chickens as a preliminary step in MHC characterization.
When typing new populations for LEI0258 diversity, comparisons with existing reference alleles of the same size should be performed to avoid allele inconsistency. Additionally, sequence information for novel alleles should be compared with common and shared alleles to understand their evolutionary patterns.


