

INTRODUCTION
Currently pork production scale of Korea in 2013 amounted to one million ton which is the 11th largest in the world. It means that industry marketability related to pork reaches the global level and the number of pig slaughtering is apt to increase from 13,002,551 in 2009 to 13,805,588 in 2013 [1]. A pork meat export due to air infectious disease and infectious foot-and-mouth disease through other routes dropped from 33,070 ton in 2001 to 3,735 ton in 2007 but increased again to 8,249 ton and then sharply increased in February by 63 percent compared to January of 2013 [2]. It has been reported to help trigger exports to Japan and therefore, rise in domestic pork market is considered to continue [3].
Typical diseases giving health damage to swine farms, Swine Chronic Wasting Diseases (SCWD), cause general debility, undergrowth, diarrhea and respiratory disorders [4]. 4.5 million pigs perish per year due to aerial infection and cause enormous damage to pig farms [3]. According to the recent research on SCWD, it has been reported that pig chronic wasting disease was caused by Brachyspira species in bacilli of air pollutants [5]. It means that all kinds of bacilli in particulates among air pollutants have influence on pig’s productivity. Therefore, it is urgent to eliminate particulates and bacilli lest swine farms should get damage.
The Chronic wasting diseases (4P: Post-weaning multisystemic wasting syndrome, Porcine Respiratory Disease Complex, Porcine Reproductive and Respiratory Syndrome, and Porcine Epidemic Diarrhea) mentioned above have turned out that they are caused by aerial bacilli [6]. Disorders through aerial infection are presumed to occur by several factors such as poor breeding environment, immunodeficiency, feeding management and stress. Above all, a combination of insufficient breeding houses and environment management has been recognized as a foremost cause.
Overall pig production industry of Korea aims at gaining weight without considering porcine health and quality. As market price of pork meat is also settled by the ratio of payment to fresh weight, swine farms could make profits once increasing more than a certain weight regardless of porcine quality. It is a matter of course that swine farms are currently under difficulties due to 4P chronic wasting diseases still widespread, rise in grain prices and reinforcement of all the environment regulations. In addition, as the final consumers’ requirement for pork meat has reached to high level, it is important for protection and development of pig production industry of Korea to produce pig meat of good quality and to meet consumers’ requirements by improving productivity index of pork carcass and ultimately to strengthen competitiveness of domestic pork for differentiation from import meat in a diversified meat market. Summarizing expectations in production index of pig carcass as a link, if swine farms produce pig meat of high quality by developing feeding management to the change of the consumer demand and such produced pig meat is differentiated by meat grade and transparency of meat distribution is secured, consumers would trust and purchase pig meat and therefore, it is understandable to give a chance to develop pig production industry in Korea.
However, there are few domestic researches for increasing pig productivity. Especially, fundamental data on relationship between pig productivity and air pollutants exposed to pig are much fewer than those on measurement of indoor air quality. Since such basic data have been so far measured in a veterinary and agricultural rather than environmental and technological concept, there are scarcely data on air quality of pig building measured qualitatively and quantitatively. In addition, it is not possible to adopt typical rearing mode warranting pig welfare under domestic condition that country area of Korea is relatively small compared to other developed livestock countries. Thus, mechanical apparatus for reducing properly air pollutants which are principal factors provoking pig stress should be installed in pig building for sustaining productivity and welfare of pig efficiently.
There are many previous studies related to reduction of air pollutants emitted from pig building through applying various control techniques to commercial pig building on-site directly [7–9]. However, there are few field tests regarding productivity index and stress hormones of pigs about prevention of airborne infectious diseases by reducing air pollutants in pig building. Therefore, an objective of this study is to evaluate contributions of air cleaner to air pollutants and pig productivity under on-site situation of commercial pig building.
MATERIALS AND METHODS
The manufacture of air cleanser applied to this study was intended to reduce air pollutants emitted from pig building. Its operation mechanism is based on combination of filtration by dry filter and eradication by plasma ion emission. The former equipment and the latter equipment were installed to air cleaner for lessening gaseous and particulate pollutants and biological pollutants, respectively. It is a wall-typed air cleaner and its dimension is as follows: 2 × 0.5 × 0.5 m. As a result of preliminary test before experiment setup, anion emission from this air cleaner was maintained to mean 30,000 no./cc.
This study was conducted in experimental pig building (4.0 × 11.5 × 2.5 m) situated at the National Institute of Animal Science of Korea. The swine house had two pig housing rooms and one pig housing was composed of 9 pens (6.0 × 5.2 × 0.5 m). Each room was installed with open partitions and constructed from galvanized steel spindles 3.7 cm apart, on either side of a 1.1 m wide central alley. 1.2 m deep manure pit was equipped under a partially slatted and concrete floor with a pit surface area of 23.0 m2. The inside of the building was insulated with 0.8 mm steel plate and 50 mm styrofoam in the side walls and ceiling. A negative pressure system attached to the wall was applied to the pig building as a ventilation mode and the 70 cm-diameter wall exhaust fan in the compartment ventilated air formed in the pig building. An controller sustained ventilation rate automatically based on the optimal room temperature (15°C–25°C) and relative humidity (40%–70%). The detailed layout of the experimental pig building is shown in the Fig. 1.
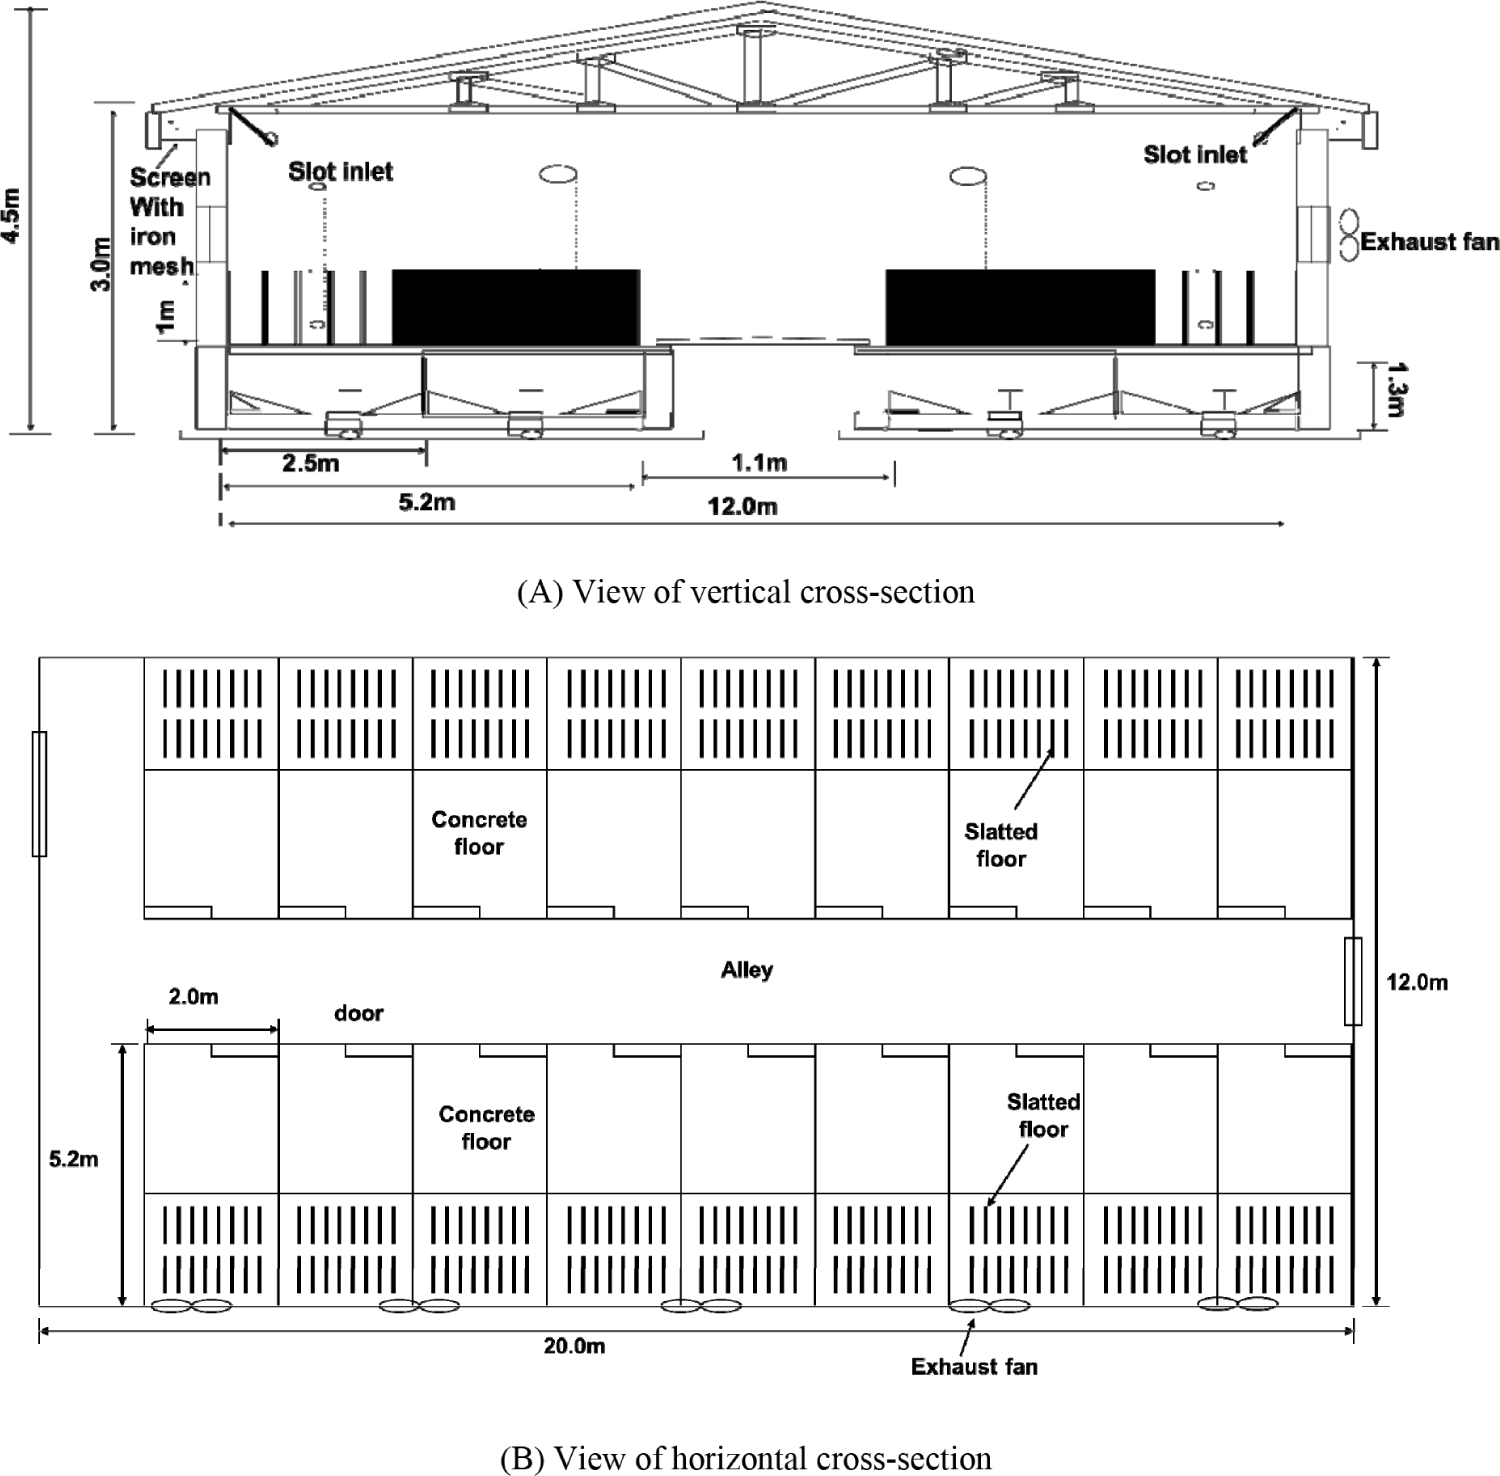
Fattening pigs with the approximate average weight of 80 kg were randomly housed in each pen. According to the NRC nutrient requirements, All the pigs were feeder-fed at 16% protein corn-soybean meal-based diet. Manual feeding was applied to pigs once every two days and they were given ad libitum access to feed and water supplied by a nipple.
The experimental procedure was approved by the Institutional Animal Care and Use Committee at Seoul National University of Science & Technology (approval No.: 2023-0003). Experimental period was between September 2018 and February 2019. Air pollutants concentration and pig’s productivity index between the control room without air cleaner) and the treatment room with air cleaner) has been monitored for six months according to pig’s rearing stage: 0 day (farrowing), 21st day (farrowing–weaning), 70th day (weaning–nursery), 140th day (nursery–growing) and 180th day (growing–fattening). As presented in Table 1, total 4 units of air cleaner were installed in the wall per each pen in the treatment room. The measurement location for airborne pollutants was 1.5 m above the floor in the middle of the central alley in the control and treatment room. Air sampling for measuring concentrations of air pollutants were between 2 PM and 4 PM and three times, respectively. Simultaneously several indices for evaluating a contribution of air cleaner to pig’s productivity were monitored for three pigs of total 15 pigs reared in each pen, selected randomly and marked with oil-based pen at the experiment initiation, in the control and treatment room.
Ammonia and hydrogen sulfide were measured according to the analytical method recommended by National Institute of Occupational Safety and Health (NIOSH). Using air sampling pump (Model 71G9, Gilian Instrument) adjusted at 2.0 L/min of flow rate, air was collected for 30 min into the all-glass impinger 30 (Ace Glass) including the absorption fluid (10 mL, 0.1 N-H2SO4 solution) for ammonia and into charcoal tube (Gilian Instrument) for hydrogen sulfide, respectively. The sampling media after air sampling were carried to the laboratory and then analyzed with Ion Chromatography (761 Compact IC, Metrohm), equipped with a Metrosep A Supp 5 (4.0 × 150 mm) column and a Metrosep A Supp 4/5 Guard (4.0 × 50 mm) guard column. The eluent was a mixture of 3.2 mmol/L sodium carbonate and 1.0 mmol/L sodium bicarbonate at a flow rate of 0.7 mL/min. The detection limit was 0.01 ppm.
The real-time direct recorder (E285, DustMate) was used to monitor particulate contaminants: total suspended particle (TSP), particulate matter (PM)10, PM2.5 and PM1. This equipment is operated based on sensing electronic signal released from particles by light scattering and its measurement range is 0–6,000 µg/m3. The representative value was calculated by averaging data obtained for 30 min monitoring.
For sampling airborne microbes, the one-stage viable particulate cascade impactor (Model 10-800, Andersen) which is set at flow rate of 28.3 L/min was applied based on microbial culture. The trypticase soy agar media (Lot 2087730, Becton Dickinson and Company) and the 2% Malt extract agar (Lot 3111376, Becton Dickinson and Company) were utilized for culturing total airborne bacteria and fungi, respectively. After finishing air sampling for 5 minutes, the culture media were carried immediately to microbial analysis laboratory and have been cultured in the incubator for 1–2 days under a 30°C–37°C condition for bacteria and for 3–5 days under a 20°C–25°C condition for fungi, respectively. After microbial culture, the colony grown in agar media was enumerated and then calculated as airborne microbial concentration by dividing the number of colony into air volume sampled.
The pig productivity indices adopted in this study are pig’s body weight gain, feed conversion, pig activity index and stress hormones. The pig’s body weight gain was monitored using the metal scales manufactured for fitting pig. The feed conversion is defined as the ratio of feed intake and body weight gain, which implicates that feed taken by pig are conversed to body weight gain. The pig activity index suggested by Parbst et al. [10] was adopted for observing activities of pigs. According to the report, the pig activity index was defined as the ratio of the number of pigs standing to the total number of pigs reared in pig building. Therefore, measurement of the pig activity index between the control and treatment room was done five times for 30 min through the direct counting method by observer. The mortality rate is defined as the ratio of the number of dead pigs to the total number of pigs according to rearing stage. It is generally utilized as index representing pig productivity.
Students’ t-test, by means of SAS package program, was executed to significantly compare the reduction efficiency of air pollutants and the difference of pig productivity index between the control room and the treatment room. The relationship between indoor air pollutants and pig productivity index was proved by the Pearson’s correlation analysis.
RESULTS AND DISCUSSION
Table 2 presents temporal fluctuation of air pollutants concentrations in control room without air cleaner and control room with air cleaner. It was observed that the levels of all the air pollutants investigated in this study increased as pigs have been developed continuously. Regardless of pig rearing stage, their mean concentrations in control room were higher than those in treatment room except for PM1. Also there were significant differences of air pollutants except for PM1 between control room and treatment room (p < 0.05). Approximate difference gaps of air pollutants concentrations were 5%–10% for 0 day (farrowing), 10%–20% for 21st day (farrowing–weaning), 15%–25% for 70th day (weaning–nursery), 20%–35% for 140th day (nursery–growing) and 30%–45% for 180th day (growing–fattening), respectively. In air pollutants in terms of growing–fattening stage, the air cleaner showed mean reduction efficiencies of 25% for NH3, 22% for H2S, 41% for TSP, 37% for PM10, 27% for PM2.5, 47% for total airborne bacteria (TAB), and 44% for total airborne fungi (TAF), respectively, as compared to air pollutants concentrations in the control room.
Overall the levels of all the air pollutants measured in the control room were similar to or slightly lower than previous data reported from other researches [11–14]. The result that difference gap of air pollutants concentrations between control room and treatment room was much higher as growth stage of pigs proceeds would be attributed to considerable emission of air pollutants derived from lots of manure and feedstuff associated with grown-up pig. This assumption is supported by the report that air cleaner generally shows better reduction efficiency for air pollutants when it is applied to indoor environmental condition representing their high levels [15]. The additional result that reduction efficiency of this air cleaner was higher in particulate and biological pollutants rather than gaseous pollutants would be based on its operation mechanism devised for mainly lessening aerosol. Although there is little information regarding measurements comparing the air entering and exiting the plasma air cleaner, degradation efficiency of approximately 5%–15% for volatile organic compounds was reported by current previous study [16]. The reason that there was no significant difference of PM1 concentration between control room and treatment room can be explained by the fact that it seems not easy to accurately measure ultra-fine particle such as PM1 by utilizing current monitoring technique [17].
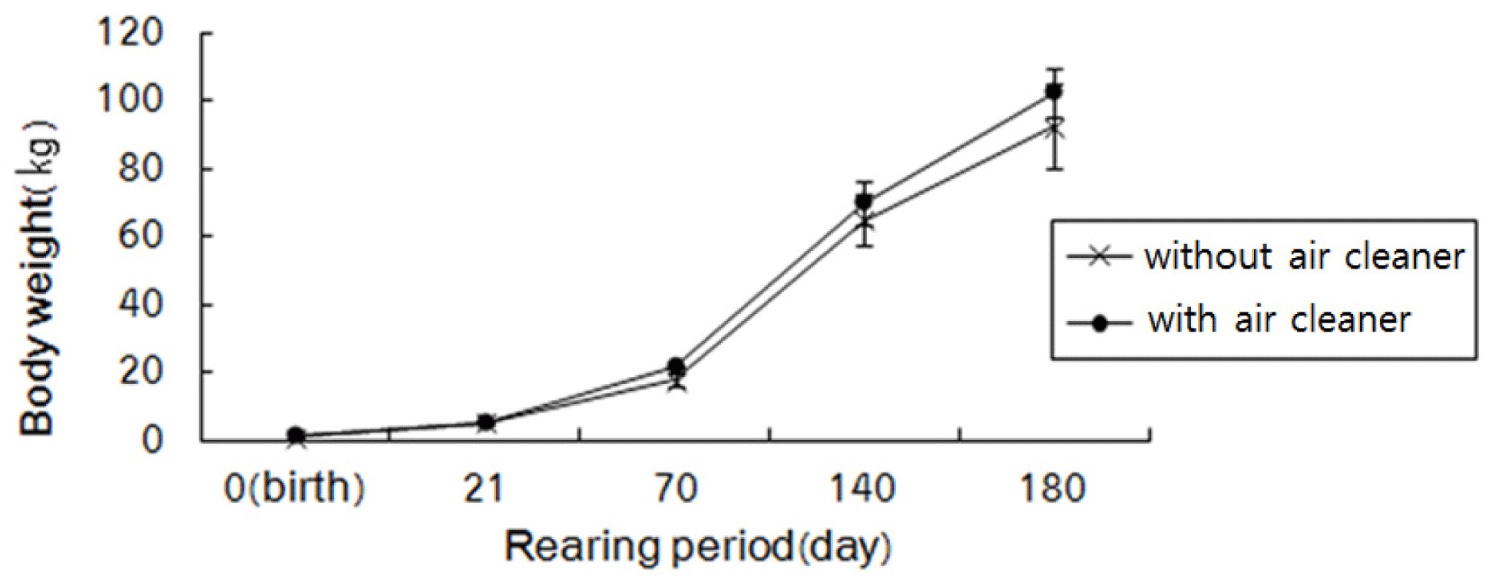
The Fig. 2 shows fluctuation of body weight of 10 pigs selected randomly in the control room (without air cleaner) and the treatment room (with air cleaner) according to pig’s rearing step. Mean pig’s body weight according to rearing step in the control room and the treatment room were 1.42 (± 0.21) kg and 1.32(± 0.23) kg in birth (0 day), 5.32 (± 0.50) kg and 5.24 (± 0.74) kg in 21st day, 21.8 (± 0.44) kg and 17.8 (± 1.92) kg in 70th day, 70.0 (± 6.16) kg and 64.8 (± 7.63) kg in 140th day, and 102.4 (± 7.26) kg and 92.4 (± 12.26) kg in 180th day, respectively. Based on the data of final measurement day (180th day), increase effect of pig’s body weight gain of mean 10kg was found in the treatment room compared to the control room. There was little difference of pig’s body weight gain between control room and treatment room until farrowing step. However, its significant difference occurred from weaning step to fattening step. Currently, no pig building was managed by air cleaner to optimally control indoor air quality even foreign countries as well as Korea. In general, air quality in most of pig buildings has been controlled by ventilation system and its main purpose focused on lessening odor emission. Based on the result of this study, optimal management of air quality in pig building by application of air cleaner implicates significant increase of pig’s body weight gain.
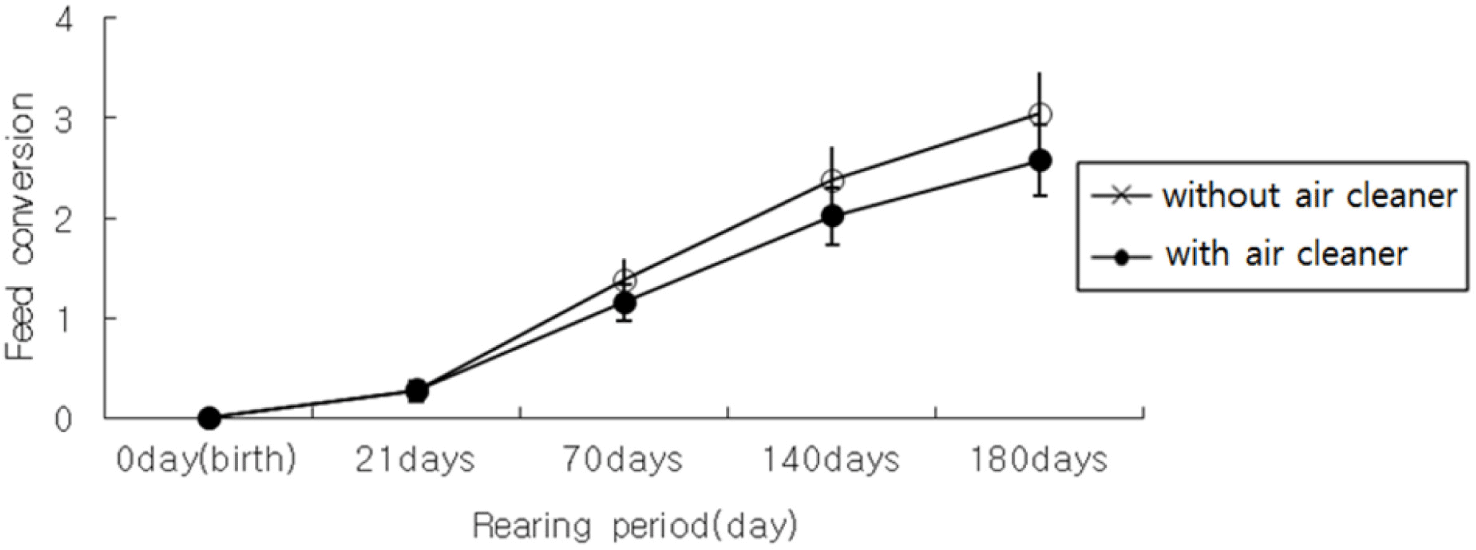
The Fig. 3 shows fluctuation of feed conversion of 10 pigs selected randomly in the control room and the treatment room according to pig’s rearing step. As a result, there was little difference of feed conversion between control room and treatment room until farrowing step. However, it was found that feed conversion has been lower in the treatment room than the control room since weaning step (21st day). Furthermore, as pig’s rearing proceeds, the gap of feed conversion of 10 pigs between control and treatment increased continuously. As low feed conversion means that feed intake by pig is conversed easily to body weight gain, it is implicated that other environmental factors in pig building, such as indoor air quality, also contribute to increase of pig’s feed conversion. Thus, it is presumed that application of air cleaner would play a role in improving pig’s feed conversion.
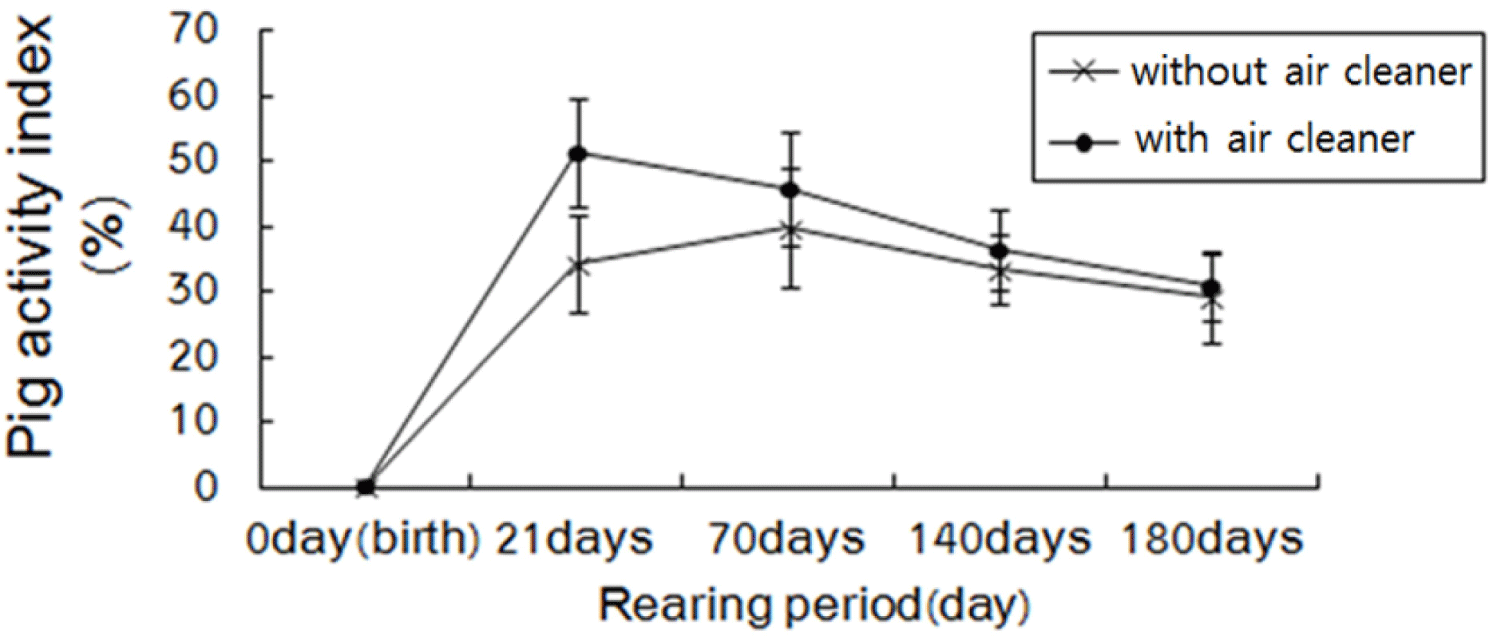
The Fig. 4 shows fluctuation of pig activity index (PAI) of 10 pigs selected randomly in the control room and the treatment room according to pig’s rearing step. As a result, the mean pig activity index was higher in treatment room (30.8–51.3) than control room (29.1–39.8) in all the rearing steps. Kim et al. [18] observed that there was negative correlation between ammonia and pig activity index, which means that poor air quality caused by ammonia weaken pigs’ activities. They also reported that pig activity index in general pig building ranged 10 to 40. Therefore, relatively high pig activity index, approximately 50, obtained from this study would be based on affirmative effect of air cleaner.
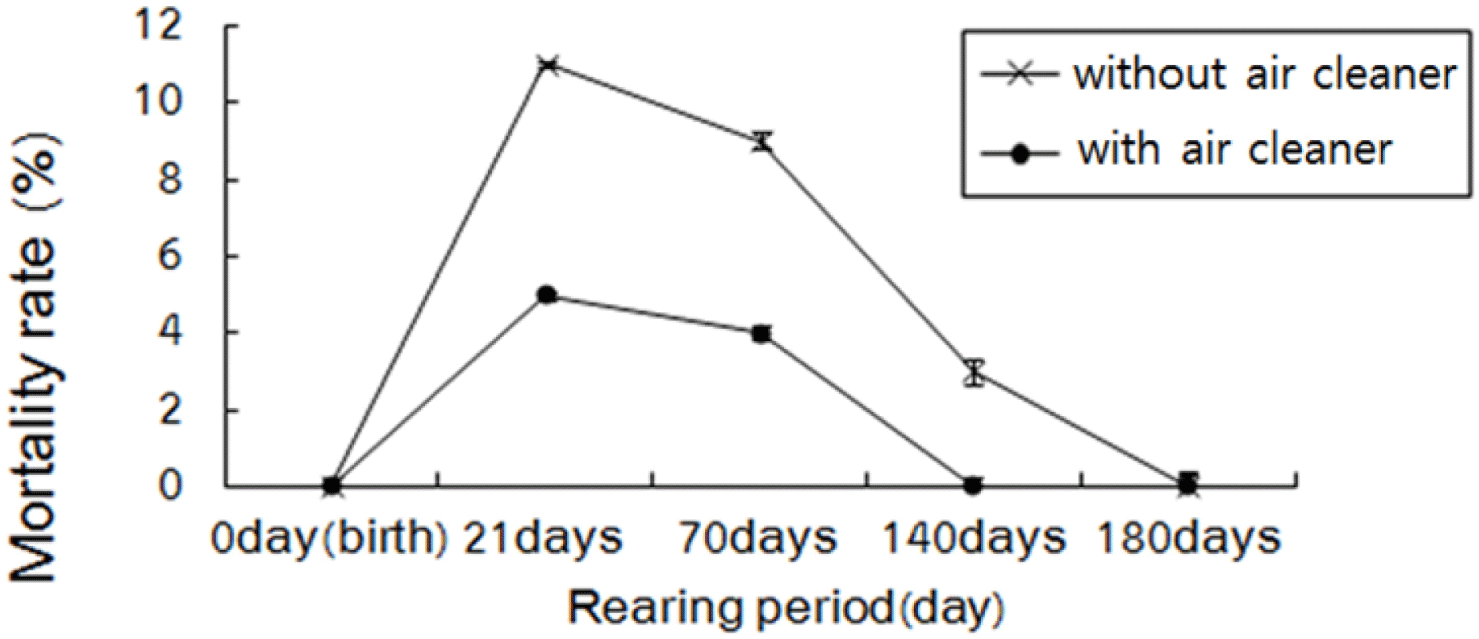
The Fig. 5 and Table 3 show fluctuation of mean mortality rate and the number of dead pigs in the control room and the treatment room, respectively, according to pig’s rearing step. The mean mortality rate was lower in treatment room than control room in all the rearing steps, which means that an operation of air cleaner had a good effect on decrease of mortality rate. However, the difference of mortality rate between control and treatment has been observed until nursery step and there was no pig’s mortality in growing and fattening steps. Statistics Korea [19] indicated that mean domestic pig’s mortality rate ranged 12.5% to 13.4%. According to unofficial report by farmers’ opinions, actual pig’s mortality rate would amount to 20%–25% and the rearing steps of weaning/nursery and growing/fattening showed mortality rate of about 20% and 5%, respectively. The fact that mortality rate is relatively higher in the rearing steps of weaning and nursery than other rearing steps would be reasoned by frequent occurrence of respiratory diseases. Thus, it is considered especially that air cleaner should be applied at step rearing young pigs to efficiently prevent pig’s mortality. As it is reported lately that pig’s respiratory diseases caused by air infection, such as acute pneumonia of the coelom, occurred in growing and fattening steps, the application studies regarding air cleaner to prevent adult pigs from air-infected respiratory diseases should also be performed in the future.
| Control room (without air cleaner) | Treatment room (with air cleaner) | |
|---|---|---|
| 60 heads | 60 heads | |
| 0 day (initiation) | 0 | 0 |
| 21st day | 6 | 3 |
| 70th day | 5 | 2 |
| 140th day | 1 | 0 |
| 180th day | 0 | 0 |
| Total | 12 (20.0%) | 5 (8.3%) |
Table 4 shows correlation degree between indoor air pollutants and pig productivity index. In indoor air pollutants, there were significant positive correlations between NH3 and PM2.5 (p < 0.05), H2S and PM2.5 (p < 0.05), TSP and PM10 (p < 0.01), TSP and PM2.5 (p < 0.01), TSP and TAF (p < 0.05), PM10 and PM2.5 (p < 0.01), and PM2.5 and TAB (p < 0.05). In pig productivity index, there was significant positive correlation only between body weight gain and feed conversion (p < 0.01). In association with indoor air pollutants and pig activity index, there were significant positive correlations between TSP and body weight gain (p < 0.05), TSP and pig activity index (p < 0.05), and total airborne bacteria and pig activity index (p < 0.05).
It is reasonable that there were significant positive correlations among types of particulate pollutants since they are derived from identical generation source. In case of PM1, however, its significant correlations respectively with TSP, PM2.5, and PM1 were not observed due to measurement limit of uncertain direct recorder utilized to this study. Thus, it is considered that data regarding PM1 are neglected as interpreting results obtained from this study. It is also inevitable that there was significant correlation between pig’s body weight gain and feed conversion as it is defined as the ratio of pig’s body weight gain and feed intake by pig. This fact has been acknowledged by many previous publications [20–22].
The finding that ammonia and hydrogen sulfide showed significant positive correlation with PM2.5 would be reasoned by that gaseous pollutants emitted from pig building were adsorbed on fine particle surface and transported under airborne condition [23] and motion patterns of fine particles below 0.01 µm in the air are generally similar to those of gaseous pollutants because they show diffusion mechanism [24].
The levels of total airborne bacteria and fungi had significant correlations with PM2.5 and TSP, respectively, which can be explained by size of airborne bacteria and fungi. In general their particle sizes are reported as 0.1–10 µm for airborne bacteria and 10–100 µm for airborne fungi, respectively [25]. Based on this fact, it is supposed that airborne bacteria and fungi are matched to PM2.5 and TSP in accordance with respective particle size.
A remarkable finding was that pig’s body weight gain had a significant positive correlation with TSP (p < 0.05). Although a statistically significant positive correlation was observed between some particulate pollutants such as TSP and pig’s body weight gain, this does not imply a causal relationship in which poor air quality improves productivity. Rather, it may reflect the fact that heavier pigs generate more particulate matter due to increased feed intake and waste output. Therefore, the observed correlation could be confounded by pig growth itself, not by the aggravation of air quality improving productivity. As supported by the experimental results (Fig. 2), the treatment room with improved air quality using an air cleaner consistently showed higher body weight gain across rearing stages, reinforcing the established understanding that better air quality contributes to improved pig growth performance [26–29].
Possible reasons for a positively significant relationship between pig activity index and TSP and between pig activity index and total airborne fungi could be supported by previous reports that the pig activity has an increasing effect on the concentration of dust and airborne microbes in pig building [18,30]. Especially, this result reflects that high pig activity would cause increase resuspension of coarse particles such as TSP and airborne fungi from feedstuff and dried manure deposited to slatted floor of pig building.
CONCLUSIONS
Regardless of pig rearing stage, mean concentrations of air pollutants emitted from pig building in control room without air cleaner were higher than those in treatment room with air cleaner except for PM1. The average concentrations of air pollutants in the treatment room were reduced by approximately 5%–10% on day 0 (farrowing), 10%–20% on day 21 (farrowing to weaning), 15%–25% on day 70 (weaning to nursery), 20%–35% on day 140 (nursery to growing), and 30%–45% on day 180 (growing to fattening), respectively, compared to those in the control room. In case of pig productivity, application of air cleaner also had a positive effect on pig’s body weight gain, feed conversion, pig activity index and mortality rate through all the pig’s rearing steps. The paired factors showing statistically significant correlation relationships were pig’s body weight gain and TSP, pig activity index and TSP, and pig activity index and total airborne fungi.


