

INTRODUCTION
Swine manure has long been used as an organic fertilizer to supply nitrogen to agricultural systems, and the recycling of nutrients in livestock manure plays a significant role in enhancing agricultural sustainability [1–4]. Because of its rich content of essential nutrients and minerals required for crop growth, swine manure has been reported to influence soil fertility positively [5–12]. However, the expansion of the livestock industry has led to an increase in the amount of manure generated, resulting in various environmental concerns. Livestock manure, which contains high concentrations of nitrogen, phosphorus, and organic matter, can cause severe contamination of soil and water systems if not properly managed [13–15]. Additionally, ammonia (NH3) emitted during the land application of swine manure can degrade air quality and contribute to environmental pollution through atmospheric deposition, causing soil acidification and eutrophication [16–18]. NH3 is of particular concern because it can be converted into ammonium aerosols in the atmosphere, forming fine particulate matter that poses a potential threat to public health and results in significant social health costs [19,20]. In response, regulatory frameworks have been adopted in many countries [21].
Another concern when applying swine manure to agricultural land is the potential phytotoxicity of ammonium nitrogen (NH4+) to crops. NH4+ toxicity in plants has been extensively studied and is known to adversely affect plant growth [22,23]. Classical and modern hypotheses regarding the mechanisms of NH4+ toxicity were summarized by Esteban et al. [24]. Although studies on the relationship between soil nitrogen forms and plant growth have shown that sensitivity to ammonium-N (NH4-N) varies among plant species, nitrate-N (NO3-N) is generally considered the preferred nitrogen form in most higher plants [25,26].
Aerobic treatment is considered the most effective method for reducing odors and preserving nitrogen in a more beneficial form when swine manure is used as an organic fertilizer. Most odorous compounds produced during swine manure decomposition, such as nitrogen, sulfur, volatile fatty acids, and aromatic compounds, are by-products of anaerobic microbial activity [27]. The odor-reducing effect of aerobic treatment is well-established, and its basic principle is to provide sufficient dissolved oxygen to aerobic bacteria to actively degrade odorous substances [28]. Additionally, aerobic treatment can convert NH4-N in swine manure into nitrate nitrogen (NO3-N), a form with low phytotoxicity, and is considered the most efficient method for such transformation [29]. Owing to these advantages, several countries, including Korea and Japan, have long preferred to apply swine manure to soil only after aerobic treatment in the form of liquid compost [30,31]. In particular, the Ministry of Environment of South Korea introduced the concept of maturity of liquid compost derived from aerobically treated swine manure to ensure environmental safety and mandated maturity testing prior to land application.
However, owing to the high variability of swine manure, it is difficult to determine the exact duration of aerobic treatment required to achieve sufficient maturity. Moreover, the real-time assessment and diagnosis of liquid compost maturity are currently unavailable, making it challenging for farms to apply swine manure in an environmentally sustainable form. A method that can accurately and easily determine the appropriate timing for land application by enabling real-time monitoring of liquid compost maturity is needed to address this issue. Therefore, this study was conducted to develop a method for the real-time diagnosis of liquid compost maturity during aerobic treatment using oxidation-reduction potential (ORP) and pH, which are widely used indicators of oxidation levels in aqueous environments.
MATERIALS AND METHODS
As shown in Fig. 1, a liquid composting system was constructed to investigate the changes in maturity during the swine manure composting process and to analyze the behavior of the ORP and pH across different maturity levels. The bioreactor was fabricated using a cylindrical acrylic vessel with a total volume of 30 L, a diameter of 400 mm, and a height of 350 mm. The system was equipped with a mixer (MS-17GY; JEIO TECH), air stones, a flow meter (RMA-14-SSV; Dwyer Instruments), and a blower (BT-6500; Chuang Xing Manufacturing, Tsuen Wan) to provide aerobic conditions. Two air stones were installed symmetrically at the bottom of the bioreactor to supply air, and the airflow was independently regulated using individual flow meters.
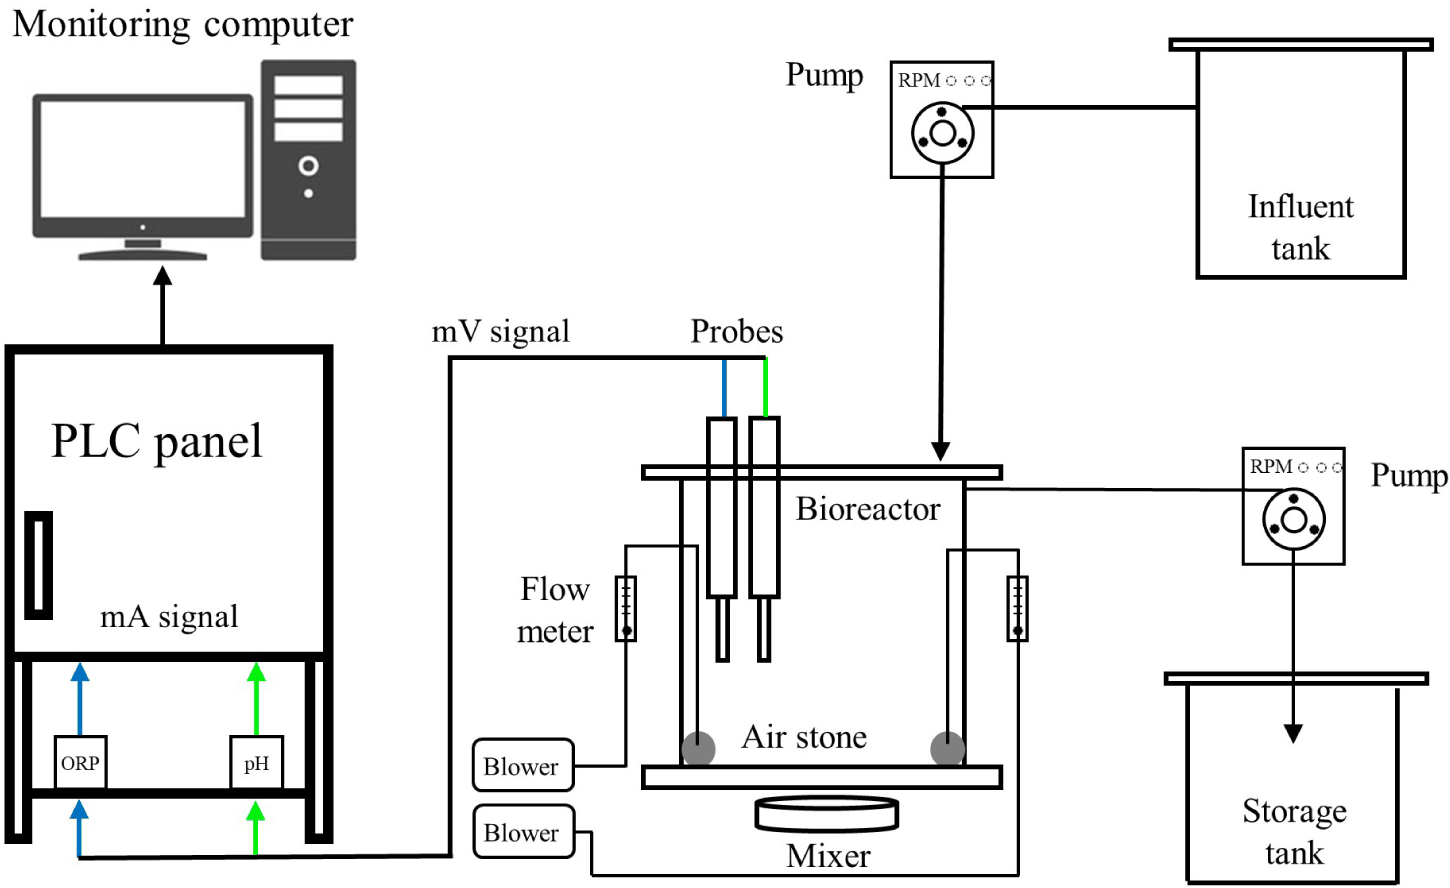
Probes to monitor the changes in ORP and pH during the liquid composting process were installed at the mid-water level of the bioreactor. The signals were transmitted to a programmable logic controller (PLC) and were subsequently recorded on a computer. The ORP and pH probes were validated by measuring standard solutions at the start of each experimental cycle. When deviations were detected, immediate recalibration was conducted. Additionally, regular accuracy checks were performed on a weekly basis to ensure the reliability of sensor measurements throughout the monitoring period.
Raw swine manure was introduced into the bioreactor via an influent pump, and the amounts of inflow and outflow were controlled by adjusting the pump operation time. An effluent port was installed in the middle of the effective water height in the reactor and connected to an effluent pump, which was used to discharge the liquid compost and collect the samples. The experiments were conducted in a controlled laboratory environment maintained at 25°C to minimize the influence of temperature fluctuations on the liquid composting process.
An experiment was conducted to reflect the typical operational procedures used in liquid composting facilities for swine manure. In such facilities, it is a common practice to retain a sufficient number of microorganisms (activated sludge) within the bioreactor while discharging only a portion of the mature liquid compost (MLC), followed by the introduction of fresh raw manure. This approach ensured efficient liquid composting. This study adopted the same operational practice: prior to the inflow of swine manure, a volume of liquid compost equivalent to the target influent volume was discharged, and raw swine manure was introduced into the reactor while retaining the remaining liquid compost. This approach allowed activated microorganisms to be retained within the bioreactor, thereby supporting stable microbial activity throughout the experiment.
The operating conditions of the bioreactors used in this study are listed in Table 1. The reactor had an effective volume of 25 L and was operated under continuous aeration at an airflow rate of 0.05 L air/L reactor volume/min following the introduction of raw manure. In Korea, the aeration rate of 0.03 m³ air/m³ reactor volume/min is generally applied for liquid composting, following “Standard Design Guide for Livestock Manure Resource Recovery Facilities”. However, due to the shallow depth (350 mm) of the experimental bioreactor used in this study, reduced oxygen transfer efficiency was anticipated. To compensate for this limitation, the aeration rate was increased by approximately 70%, resulting in a final applied rate of 0.05 m3 air/m3 reactor volume/min. Each liquid composting cycle was continued until all NH4-N introduced via the influent was oxidized. The cycle was terminated once NH4-N was fully depleted, and the next experimental cycle was initiated (any overlapping data collected after the complete oxidation of NH4-N were excluded from the analysis). The volume of raw swine manure added to each cycle was adjusted to achieve loading rates ranging from 5% (1.25 L) to 40% (10 L). As mentioned above, each experimental cycle was maintained until complete oxidation of NH₄-N was achieved and lasted approximately 4 to 19 days, depending on the level of hydraulic loading and reaction efficiency. A total of 67 samples were collected at 1–2 day intervals during the composting process to evaluate changes in maturity and composition.
The initial liquid compost and raw manure used in the experiment were collected from a swine farm in Hoengseong-gun, Gangwon-do, South Korea. Because aeration could not be performed during transportation and preparation, the collected initial liquid compost was aerated in the laboratory for one week prior to use to preserve microbial activity. Raw swine manure was collected after solid separation using a solid-liquid separator (MCL-300D; MUHAN TECHNICAL) and then frozen until use. The characteristics of the liquid compost and raw manure are listed in Table 2.
ORP (SOR 400G; Samsan Korea) and pH sensors (SPH-200G; Samsan Korea) were installed at the mid-level height in the bioreactor working volume to monitor changes in the ORP and pH during the liquid composting process. Voltage signals generated from each sensor were transmitted through the corresponding ORP (CRN-96 ORP; Samsan Korea) and pH instruments (CRN-96 pH; Samsan Korea), converted to current signals of 4–24 mA, and relayed to a PLC (XGB, LS ELECTRIC). Sensor readings were measured at one-second intervals, and the average of every 60 data points (i.e., one-minute intervals) was recorded and stored on a computer connected to the PLC.
This study primarily focused on the analysis of soluble nitrogen and organic matter based on the principle that aerobic conditions promote the oxidation of these components during liquid composting. Additional analyses of total Kjeldahl nitrogen (TKN) and solids were conducted according to standard methods. The growth of activated sludge in the bioreactor significantly affected the solid fraction, limiting the relevance of solid-based indicators in evaluating liquid compost maturity. Therefore, soluble nitrogen and organic carbon concentrations were primarily used to interpret the maturity of the liquid compost.
The collected samples were immediately centrifuged at 1,610×g for 10 min and then filtered using Whatman No. 6 filter paper. The filtrate was analyzed for soluble total organic carbon (STOC) and soluble nitrogen components. STOC was measured using a total organic carbon analyzer (Torch; Teledyne Tekmar), and NH4-N and NOX-N concentrations were analyzed using an automated water quality analyzer (QuickChem 8600; Lachat). The concentration of free NH3 in each sample was estimated based on the equilibrium ratio of NH4+ and NH3 at a given pH and temperature following the method proposed by Emerson et al. [32]. The pH value measured at the time of sampling was used, and a temperature of 20°C—the temperature at which maturity was measured—was applied.
The maturity of the liquid compost samples was evaluated using an automated liquid compost maturity analyzer (LMQ2000; KOREA SPECTRAL PRODUCTS). This device assesses compost maturity based on gas emissions (NH3 and H2S) and sample absorbance, with 97.4% agreement with seed germination test results [33].
Some indicators for mature and non-mature liquid compost (NMLC) do not satisfy the assumption of normality. Therefore, the non-parametric Mann–Whitney U test was employed to compare the distributions of ORP, pH, and concentrations of soluble nitrogen and organic matter between the two groups. Statistical analyses were performed using the SAS software. Statistical significance was set at p < 0.05.
RESULTS AND DISCUSSION
To investigate the physicochemical changes within the bioreactor during the liquid composting process, the variations in ORP, pH, and soluble nitrogen species across each experimental cycle—operated under different hydraulic loading rates—are presented in Fig. 2. Additionally, the time required to complete nitrification under each loading condition is summarized in Table 3 to analyze the effect of loading variation on NH4-N oxidation efficiency (Results from all cycles are not shown due to the repetitive nature of the trends observed). As shown in Fig. 2A, 2B, 2C, and 2D, despite the differences in hydraulic loading, all cycles exhibited a common pattern characterized by a decrease in NH4-N concentration and a corresponding increase in NOX-N, accompanied by a rise in ORP and a decline in pH as aeration progressed. The consistent pattern observed supports the utility of ORP and pH as effective real-time indicators for evaluating the maturity of liquid compost.
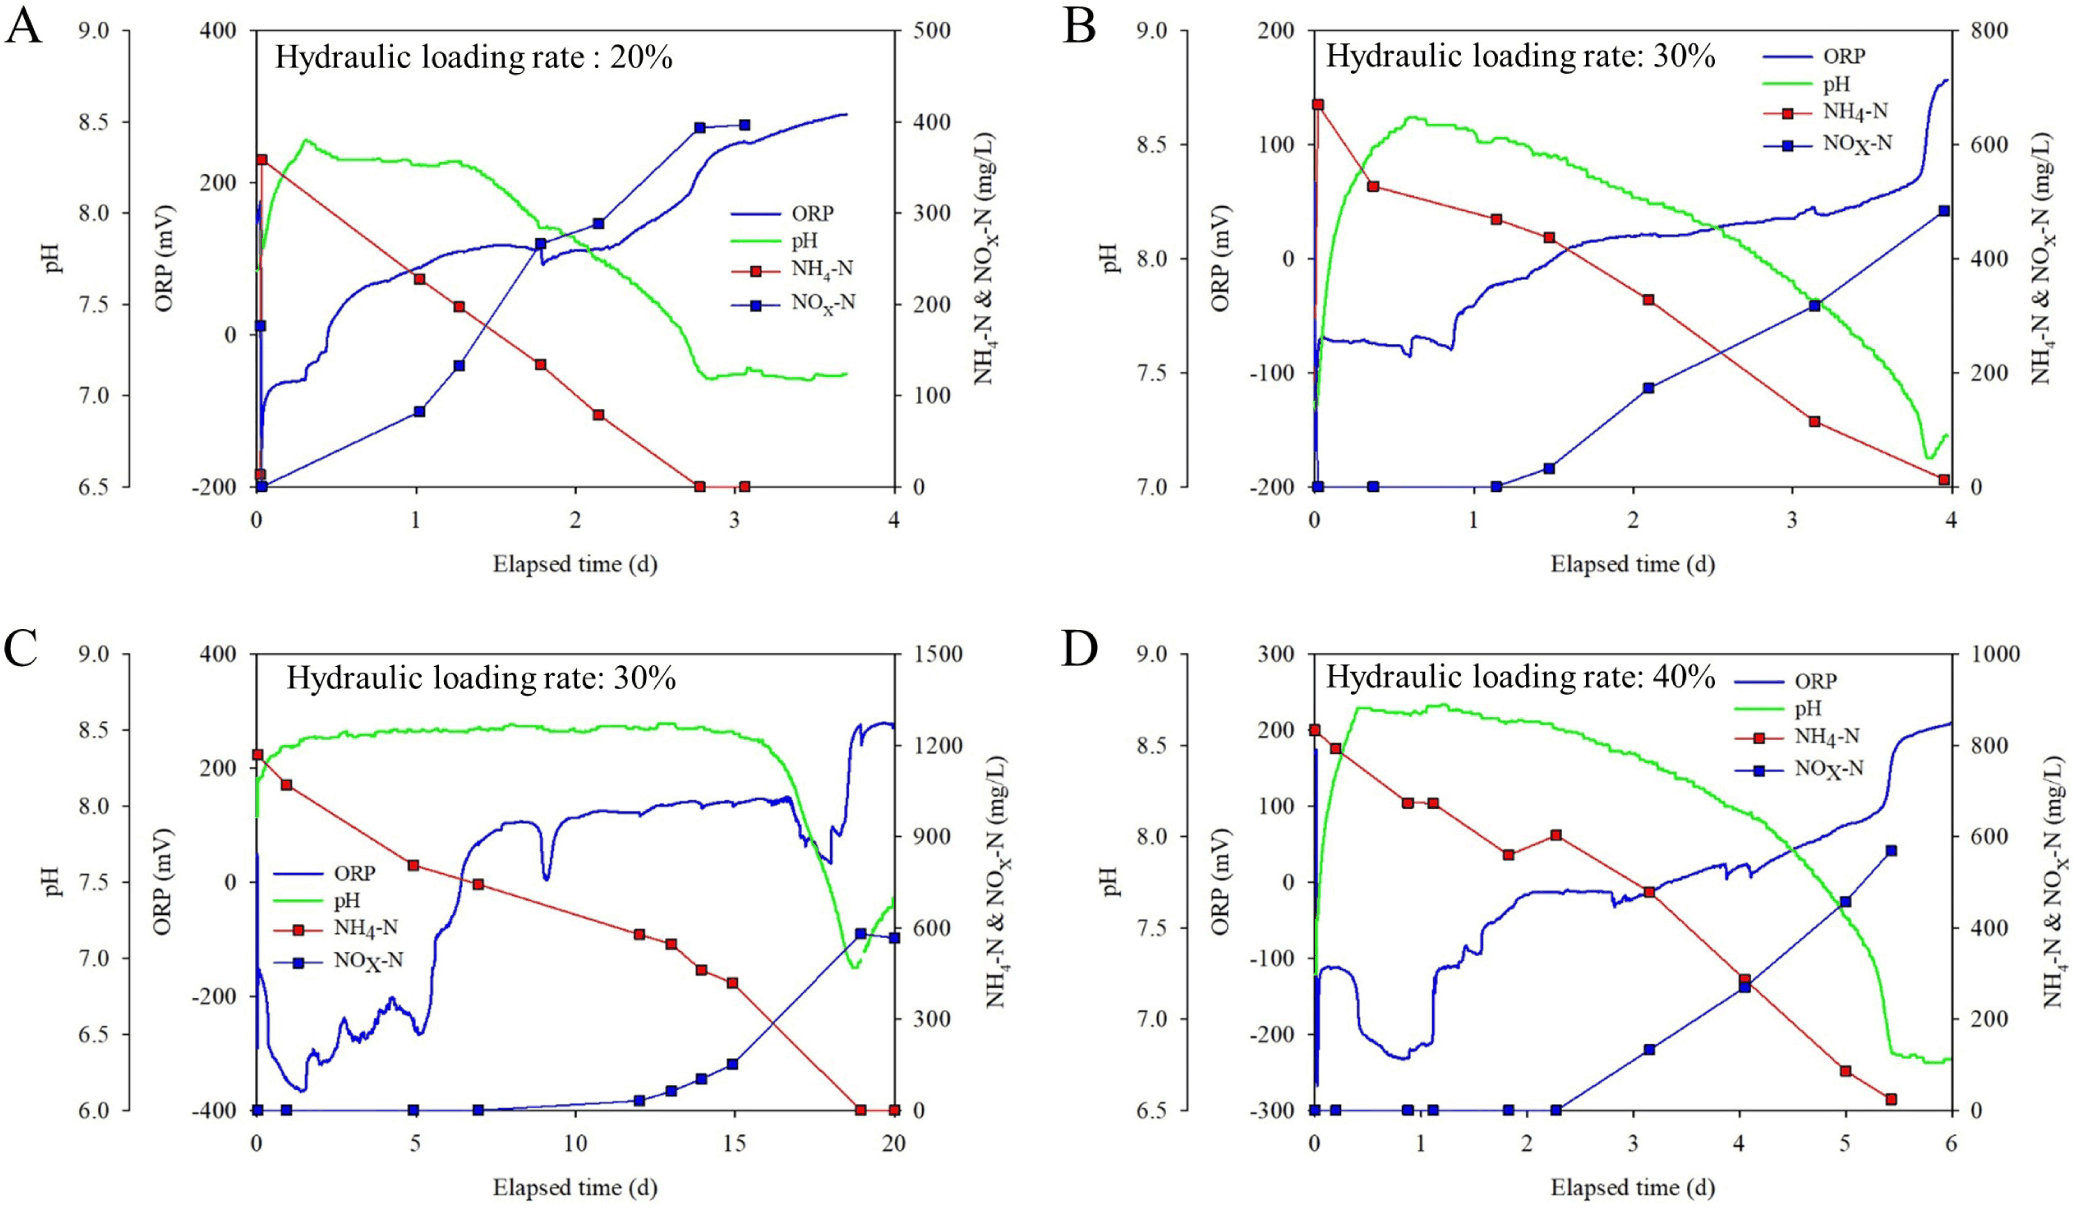
On the other hand, the time required to complete nitrification did not show a direct proportional relationship with the initial hydraulic loading conditions. For example, although cycles B and C were both operated at a 30% hydraulic loading rate, the time required for complete nitrification differed significantly, at 3.9 and 18.8 days, respectively (Fig. 2). Notably, even cycle D, which was operated at a higher 40% hydraulic loading rate, reached nitrification completion in just 5.4 days, suggesting that the result from cycle C and D deviates from the intuitive expectation that increased influent volume would result in longer nitrification periods. This discrepancy indicates that actual organic and nitrogen loading, rather than hydraulic loading alone, must be considered when interpreting the results.
Table 3 summarizes the NH4-N and STOC loading rates along with the corresponding nitrification durations for each cycle. In cycles A, B, and D, as the hydraulic loading increased from 20% to 40%, the NH₄-N and STOC loadings also increased proportionally. In contrast, cycle C, despite having a 30% hydraulic loading rate, exhibited the highest NH₄-N and STOC loadings at 913.4 mg/L and 3,749.7 mg/L, respectively, implying that the raw swine manure concentration was substantially higher than in the other cycles. As a result, cycle C required the most oxygen for the oxidation of organic matter and nitrogen, leading to the longest nitrification period among all tested conditions.
These findings strongly support the necessity of developing real-time diagnostic technologies for assessing compost maturity. Given the considerable variability in nitrogen and organic content in swine manure and the impracticality of visual or sensory evaluation in field conditions, a reliable and on-site method for maturity assessment is essential for effective management of liquid composting systems.
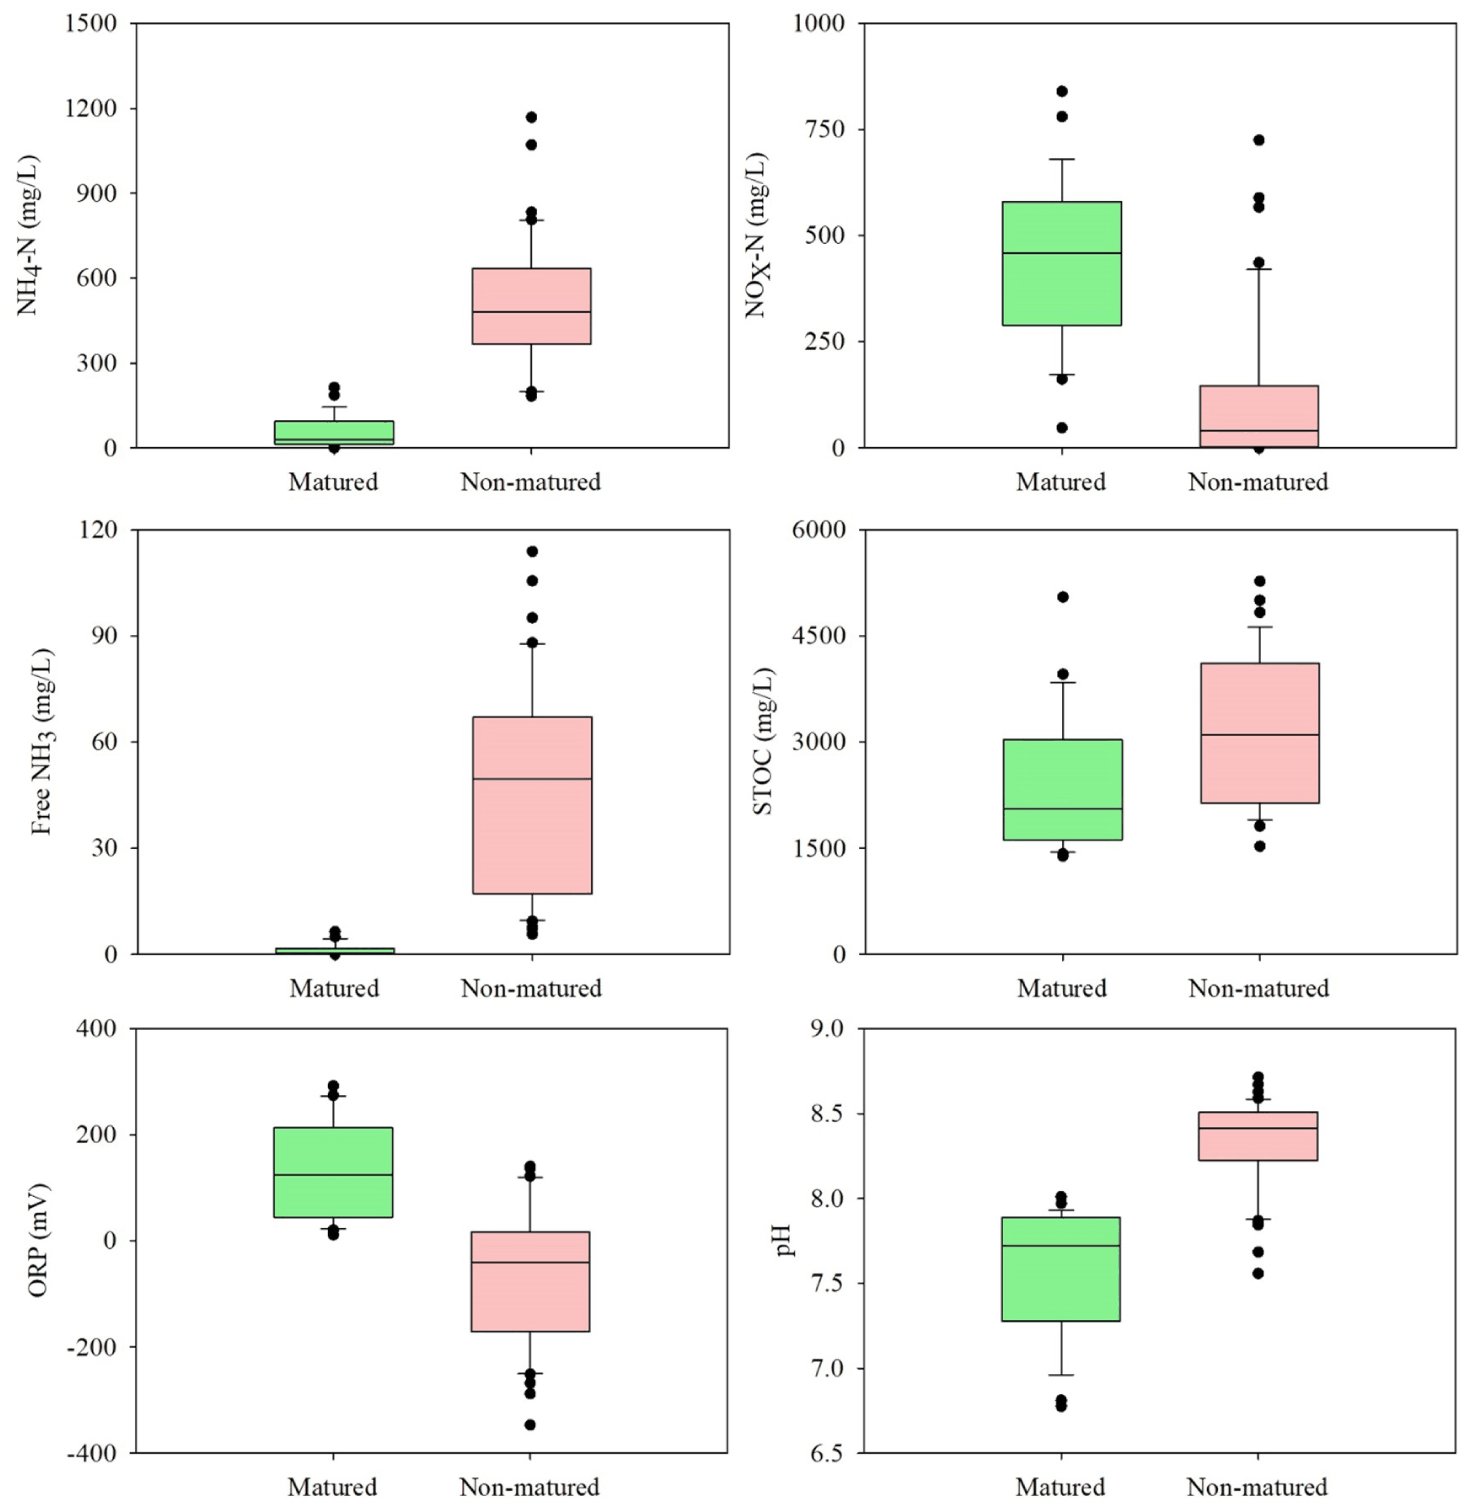
Among the 67 samples analyzed, 27 were classified as MLC, and 40 as NMLC. The differences in characteristics between the two groups are summarized in Table 4. Significant differences were observed in the concentrations of soluble nitrogen and organic carbon between the MLC and NMLC samples, with the MLC exhibiting a notably higher level of oxidation. In particular, the difference in the composition of soluble nitrogen was pronounced: the concentrations of NH4-N and NOX-N in MLC averaged 55.4 ± 57.8 mg/L and 450.3 ± 195.9 mg/L, respectively, indicating a predominance of oxidized nitrogen forms. In contrast, NMLC samples exhibited much higher concentrations of reduced nitrogen, with NH4-N and NOX-N levels of 516.5 ± 222.6 mg/L and 116.6 ± 177.7 mg/L, respectively. Soluble organic carbon was also lower in MLC (2,260.9 ± 746.6 mg/L) compared to NMLC (3,206.0 ± 1,079.7 mg/L). As a result, the MLC samples, which were characterized by more advanced oxidation of nitrogen and organic matter, exhibited higher ORP values and lower pH values than NMLC, with statistically significant differences. The ORP in MLC averaged 133.3 ± 91.4 mV, compared to –65.1 ± 127.5 mV in NMLC. Similarly, the pH of MLC was lower (7.6 ± 0.4) than that of NMLC (8.3 ± 0.3). Consequently, the potential for ammonia volatilization from MLC was markedly lower than that from NMLC. The calculated free NH3 concentrations, estimated based on measured NH4-N levels, pH, and temperature, were 1.3 ± 1.7 mg/L for MLC and 47.7 ± 29.8 mg/L for NMLC, indicating a substantially reduced risk of NH3 emissions from MLC. These results suggested that managing liquid compost maturity not only effectively mitigates NH3 volatilization but also preserves nitrogen in the more plant-beneficial NOX-N form.
Overall, compared with NMLC, MLC was characterized by lower concentrations of NH4-N and STOC, higher NOX-N levels, elevated ORP, and reduced pH. This pattern aligns with findings from previous studies comparing MLC and NMLC compositions. Jeon et al. analyzed 150 liquid compost samples collected from the Liquid Compost Supply Center and classified them by maturity [34,35]. The MLCs showed lower levels of organic matter and NH4-N, higher NOX-N concentrations, higher ORP, and lower pH than the NMLCs, which agrees with the results of the present study. However, the ORP values measured in this study—133.3 ± 91.4 mV for MLC and −65.1 ± 127.5 mV for NMLC—were notably higher than those reported by Jeon et al. This discrepancy may be due to methodological differences; the present study measured ORP in real-time within the bioreactor, whereas Jeon et al. measured ORP and pH in laboratory settings after sample collection from the Liquid Compost Supply Center.
The distribution patterns of NH4-N, NOX-N, STOC, ORP, and pH for both the MLC and NMLC are presented in Fig. 3. The most distinct differences between the two groups were found in nitrogen-related parameters. Clear distinctions in the distribution ranges and median values of the NH4-N and NOX-N concentrations were evident. Because MLCs exhibited both lower NH4-N levels and lower pH, the resulting free NH3 concentrations were significantly lower than those in NMLC. Although STOC was also lower in MLC and statistically different from NMLC, its distribution range overlapped between the groups, making it a less reliable differentiator than the nitrogen components. Importantly, the higher oxidation states of nitrogen and organic matter in the MLC were reflected in the distribution patterns of ORP and pH. These findings supported the feasibility of developing a rapid and intuitive diagnostic tool for evaluating the maturity status of liquid compost based on real-time ORP and pH monitoring.
All 67 samples were categorized into four ORP (mV) ranges (i.e., ORP ≥ 150 mV, 150 > ORP ≥ 0 mV, 0 > ORP ≥ −150 mV, and ORP < −150 mV) to evaluate the feasibility of predicting liquid compost maturity in real-time based on ORP measurements during the liquid composting process. The pH, NH4-N, NOX-N, STOC, and free NH3 values were analyzed for each range, as summarized in Table 5.
All samples within the ORP ≥ 150 mV range were classified as MLC when the samples were grouped by ORP range. In this group, the average concentrations of NH4-N and NOX-N were 13.1 mg/L and 420.5 mg/L, respectively, indicating a high level of nitrogen oxidation. Consequently, the pH was 7.36 on average, and the estimated free NH3 concentration calculated based on NH4-N levels and pH was as low as 0.1 mg/L, suggesting almost no potential for odor emissions. In contrast, all samples were determined to be NMLC in the range where ORP < 0 mV. The proportion of NH4-N in the soluble nitrogen fraction was relatively high in this group, with pH values >8. The estimated free NH3 concentration was between 53.5 and 54.5 mg/L, indicating a high potential for NH3 volatilization. Meanwhile, only 53.6% of the samples were classified as MLC in the intermediate range of 150 > ORP ≥ 0 mV, meaning that matured and non-matured samples were present in similar proportions, making it difficult to clearly distinguish maturity status based solely on ORP. This result is in agreement with early research by Charpentier et al. who reported that ORP levels vary depending on the behavior and internal reactions of dissolved oxygen, organic matter, nitrogen, and phosphorus in aqueous systems [36]. According to their findings, when ORP falls below –300 mV, reduction of organic matter and nitrogen dominates; near 0 mV, organic matter is oxidized but nitrification is limited; and above +100 mV, both organic matter and nitrogen are actively oxidized. These findings support the results of our study, which showed that in the ORP range between 0 and 150 mV, nitrification remains limited, residual NH₄-N concentrations are high, and the distinction between matured and immature samples becomes unclear.
To better understand the characteristics of liquid compost in the ambiguous range of 150 > ORP ≥ 0 mV, the physicochemical properties of both MLC and NMLC within this range were compared (Table 6). Even within this range, the MLC showed a higher proportion of NOX-N in the soluble nitrogen fraction, whereas the NMLC showed a higher proportion of NH4-N. However, average ORP values were very similar: 62.1 ± 40.7 mV for MLC and 66.0 ± 56.5 mV for NMLC. Additionally, the ORP ranges (minimum to maximum) did not differ significantly between the two groups, indicating that ORP alone could not be used to differentiate maturity in this interval. Interestingly, the pH values differed significantly. Within the 150 > ORP ≥ 0 mV range, the average pH of MLC was 7.77 ± 0.18 (ranging from 7.37 to 8.13), while NMLC showed a higher average pH of 8.32 ± 0.18 (ranging from 7.94 to 8.63).
Overall, these results suggested that monitoring the ORP during the liquid composting process allows for the prediction of maturity. Furthermore, in cases where ORP alone does not clearly distinguish between MLC and NMLC, pH monitoring can serve as an effective complementary indicator for real-time maturity diagnosis.
Similar to the ORP, the feasibility of using real-time pH monitoring to assess the maturity of liquid compost was evaluated by classifying the samples based on pH ranges, as shown in Table 7. It is well established that biological nitrification consumes alkalinity, thereby lowering pH. In this study, a decrease in pH was associated with a reduced proportion of NH4-N and a corresponding increase in NOX-N in the total soluble nitrogen content. As a result, all samples with pH ≤ 7.5 exhibited very low NH4-N concentrations, with NOX-N accounting for the majority of the soluble nitrogen, and were all classified as MLC. Conversely, in samples with 8.0 < pH ≤ 8.5, the rate of MLC dropped to just 8%, and all samples with pH > 8.5 were identified as NMLC. The concentration of free NH3, calculated based on the pH and NH4-N concentration of each sample, averaged only 0.1 mg/L in samples with pH ≤ 7.5. However, this value increased sharply to 41.34 mg/L in the 8.0 < pH ≤ 8.5 range and further to 75.1 mg/L in samples with pH > 8.5. These findings underscore the importance of producing MLC, not only for reducing atmospheric NH3 emissions from agricultural soils, but also for managing odor-related complaints.
The MLC rate was 72.7% in the intermediate range of 7.50 < pH ≤ 8.00, indicating reduced discriminatory power for accurate diagnosis. Therefore, the physicochemical characteristics of the MLC and NMLC samples within this pH range were compared (Table 8). Within this range, the composition of soluble nitrogen (NH4-N and NOX-N) differed markedly between MLC and NMLC, resulting in a corresponding difference in free NH3 concentrations. This indicates a clear compositional distinction based on maturity. The mean pH values of MLC and NMLC in this range were nearly identical, at 7.79 ± 0.12 and 7.80 ± 0.15, respectively, indicating that pH alone could not reliably predict compost maturity. In contrast, the ORP values differed significantly between MLC and NMLC, averaging 85.1 ± 64.1 mV and −162.4 ± 110.6 mV, respectively. This suggested that in pH ranges in which compost maturity is difficult to determine, incorporating ORP monitoring can enhance diagnostic reliability.
Physicochemical changes occurring during the liquid composting process resulted in notable differences in nitrogen and organic matter concentrations between MLC and NMLC. Consequently, both the mean values and distribution ranges of the ORP and pH varied between the two groups. ORP and pH demonstrated clear thresholds that could distinguish MLC from NMLC, indicating their potential as effective real-time indicators of compost maturity. However, when used independently, each indicator had limitations in clearly differentiating between MLC and NMLC within certain ranges. Integrating both indicators may improve the reliability of real-time maturity diagnostics.
The distributions of ORP and pH for MLC and NMLC were analyzed to validate this hypothesis and are presented in Fig. 4. The distribution ranges of ORP and pH differed between the MLC and NMLC. Most MLC samples were distributed within the range of ORP ≥ 0 mV and pH ≤ 8, with only one outlier exhibiting ORP 246.3 mV and pH 8.01. It is widely known that higher oxidation levels in water typically result in elevated ORP and decreased pH. However, previous studies have shown that pH may increase after complete oxidation of NH4-N due to CO2 stripping [37,38]. Based on this, the single MLC sample falling outside the proposed diagnostic range of ORP ≥ 0 mV and pH ≤ 8 likely underwent complete nitrification prior to sampling, with the elevated pH presumably resulting from the stripping of CO2. This sample had an NH4-N concentration of 0 mg/L and a NOX-N concentration of 182.1 mg/L. This suggested that when the ORP is sufficiently high, pH may not be a critical factor in maturity diagnostics. Notably, no NMLC samples were observed with ORP ≥ 150 mV.
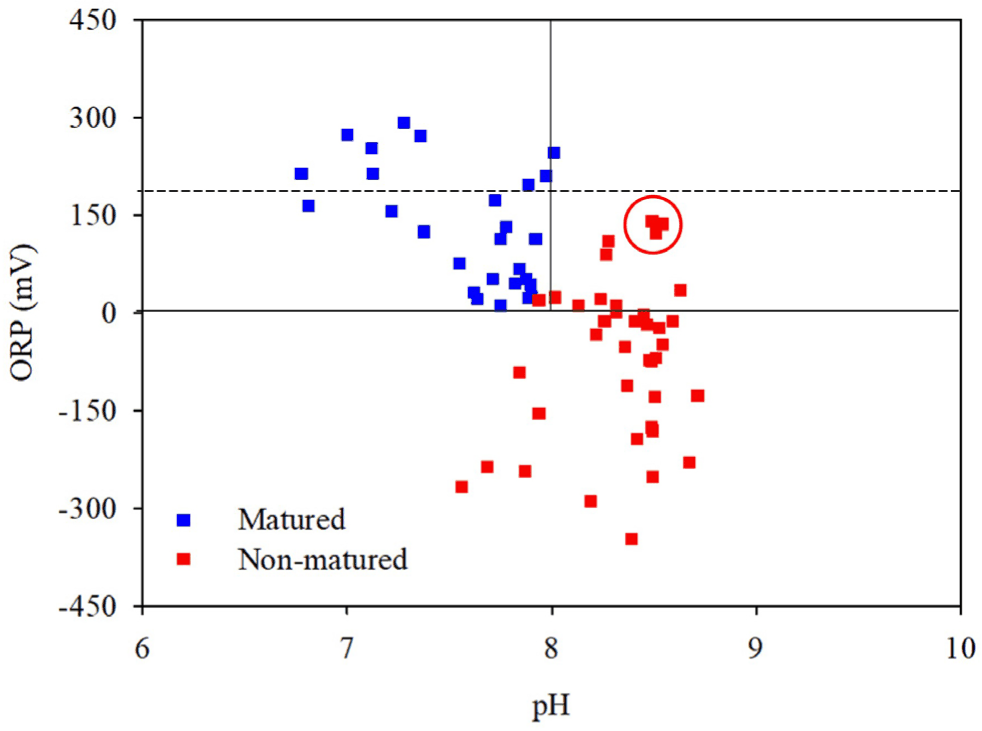
While most samples within the range of ORP ≥ 0 mV and pH ≤ 8 were classified as MLC, one sample was identified as NMLC. This sample had ORP 19.5 mV and pH 7.9, with NH4-N and NOX-N concentrations of 217.9 and 436.2 mg/L, respectively. Although NOX-N was higher, the residual NH4-N concentration was considerably greater than the MLC average (Table 4), and the pH was relatively high. Consequently, the free NH3 concentration reached 7.9 mg/L, which likely led to an immature classification. These findings imply that when diagnosing maturity based on the criteria of ORP ≥ 0 mV and pH ≤ 8 if both indicators are near their threshold values, the organic matter and nitrogen in the liquid compost may not have been fully oxidized. Therefore, samples within this range may still be immature, and caution should be exercised.
Four diagnostic criteria were developed based on these results using a combination of ORP and pH, as summarized in Table 9. The first criterion, ORP ≥ 180 mV, indicated MCL (dotted line in Fig. 4), and pH was not considered. This was based on the finding that a sufficiently high ORP alone may reliably indicate maturity. In this study, all samples with ORP ≥ 150 mV were classified as MLC. A safety margin of 20% was added to 150 mV to ensure a more conservative threshold, resulting in 180 mV being used as the final criterion. All samples in this range were classified as MLC, with NH4-N accounting for only 2.7% of the total soluble nitrogen, and the free NH3 concentration averaging only 0.14 mg/L, indicating a minimal risk of NH3 volatilization.
The second criterion, 180 > ORP ≥ 0 and pH ≤ 8, represented near-matured liquid compost. Although there was a slight risk of misclassification, the agreement rate was 95%. Within this range, NH4-N constituted 16.6% of the total soluble nitrogen, and the average free NH3 concentration was 2.19 mg/L. While oxidation levels were slightly lower than in the ORP ≥ 180 mV group, they were still significantly better than in NMLC. However, when both the ORP and pH values were close to the threshold, there was a higher chance of misclassification in this range. Operators may need to wait for the ORP to increase further or for the pH to decrease before confirming the maturity, and some level of professional judgment may be required.
If the ranges of ORP ≥ 180 mV and 180 > ORP ≥ 0 with pH ≤ 8 can be considered indicators of MLC, all other ranges should be regarded as NMLC, as they are likely to contain high levels of NH4-N and exhibit elevated pH values, increasing the risk of NH3 volatilization. Although these liquid composts are immature, real-time diagnostic results can inform operational adjustments such as increasing aeration or reducing the influent load to promote liquid compost maturation more effectively.
Field testing was conducted at a swine manure liquid composting facility in Samseong-myeon, Eumseong-gun, Korea, to evaluate the reliability of the real-time liquid compost maturity diagnostic method that combines ORP and pH. During the liquid composting process, ORP and pH were continuously monitored, and the maturity of the liquid compost was assessed. The results are shown in Fig. 5. Of the 31 samples analyzed to verify diagnostic reliability, 22 were classified as MLC and 9 as NMLC. All samples identified as matured satisfied the diagnostic criteria proposed in this study, which were defined as either ORP ≥ 180 mV or 180 > ORP ≥ 0 mV and pH ≤ 8. None of the NMLC cases was mistakenly classified as MLC. Interestingly, the pH of MLC collected from the field liquid composting facility was notably lower than those observed under laboratory conditions, averaging 6.6 ± 0.5, with the lowest value reaching 6.0. This difference may be attributed to the field composting system operating under higher organic and nitrogen loading rates, resulting in more advanced nitrification or the accumulation of NOX-N over prolonged operational periods.
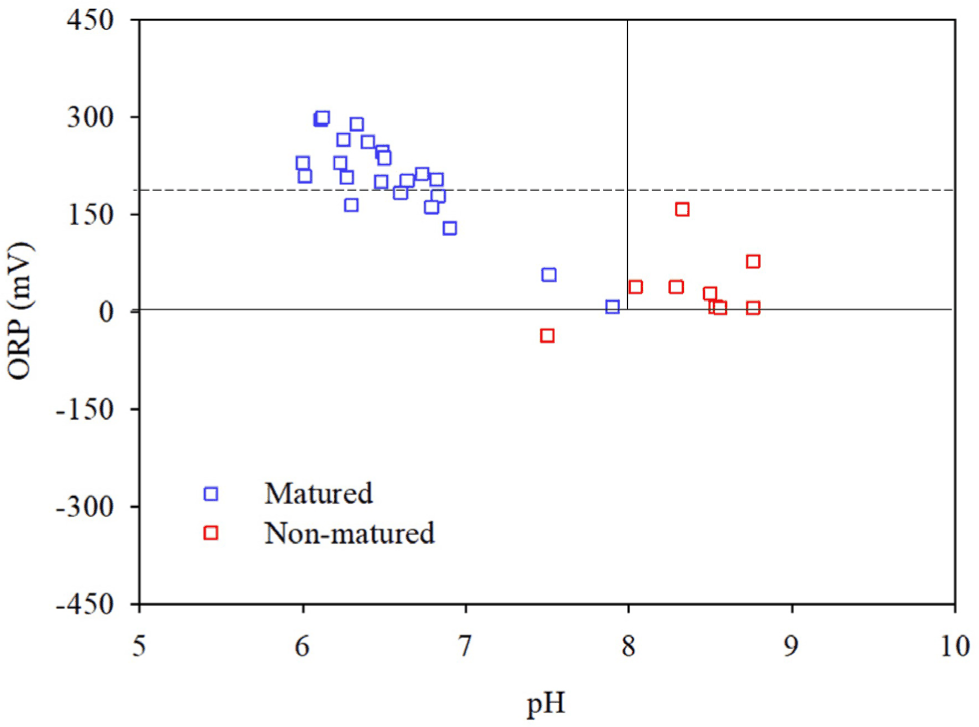
In conclusion, the diagnostic method developed through laboratory experiments demonstrated high accuracy for the real-time evaluation of liquid compost maturity under field conditions. The diagnostic accuracy was 100% for all 31 field samples tested. Therefore, the combined monitoring of ORP and pH presents a practical and effective approach for managing the liquid composting process and improving compost quality at pig farms. Further accumulation of field data and additional studies are expected to enhance the precision and applicability of this diagnostic technique.
CONCLUSION
The aim of this study was to develop a real-time diagnostic method for assessing the maturity of swine manure liquid compost using ORP and pH, two key indicators that reflect the oxidative status of organic matter and nitrogen during the liquid composting process. Through comprehensive monitoring and analysis of 67 compost samples, significant differences in nitrogen and organic matter concentrations were observed between the MLC and NMLC. These differences were consistently reflected in the ORP and pH values, thereby establishing their potential as reliable indicators of liquid compost maturity.
Liquid composts with ORP ≥ 180 mV were consistently classified as matured, while those with 180 > ORP ≥ 0 mV under pH ≤ 8 showed a maturity classification accuracy of 95%, thereby validating the effectiveness of the proposed combined diagnostic criteria. In contrast, compost outside these thresholds exhibited elevated NH4-N concentrations and free NH3 levels, indicating an increased risk of ammonia volatilization and environmental odor issues. The practical applicability of the diagnostic method was further validated on a commercial-scale swine farm, where 100% diagnostic accuracy was achieved across 31 field samples.
These findings suggested that the combined use of ORP and pH enables the intuitive and accurate real-time assessment of liquid compost maturity, thereby supporting better operational control and product quality in liquid composting systems. Further data accumulation and extended field validation are expected to enhance the precision of this diagnostic approach and provide a valuable tool for sustainable nutrient recycling in agriculture.


