INTRODUCTION
The suckling-to-weaning transition is an extremely stressful event in mammals, including pigs. During this transitional period, a pig is subjected to a number of environmental changes, including removal from the sow and littermates, the fighting and establishment of social hierarchy, transportation stress, abrupt transitions in diet, and a change of temperature and water [1]. These environmental stresses during weaning lead to immune dysfunctions in pigs, causing reduced feed intake and growth as well as decreased health [1,2]. Moreover, reduced feed intake and growth as well as decreased health during the suckling-to-weaning transition are influenced by acute physiological changes, including the secretion of digestive enzymes and structural disruption in the gastrointestinal tract [3]. Thus, it is important to address the dysfunction of the gastrointestinal tract in pigs as quickly as possible to maximize productivities, including growth.
The small intestine has three major functions: 1) the absorption of nutrients, including amino acids, fatty acids, and monosaccharides, from digested proteins, lipids, and carbohydrates [4]; 2) intestinal barrier function to prevent the passage of harmful bacteria and toxins [5]; and 3) the maintenance of lumen viscosity via the secretion or absorption of water and electrolytes [6]. Thus, intestinal dysfunction directly induces growth retardation and increased susceptibility to infections. Among the causes of intestinal dysfunction, the suckling-to-weaning transition directly affects the structural disruption of the intestine, inducing diarrhea [7]. Thus, it is essential to maintain proper intestinal function for growth and health during the suckling-to-weaning transition of pigs.
MicroRNAs (miRNAs) are small noncoding RNAs with a length of 18–26 nucleotides; they regulate gene expression by binding to the 3′untranslated region (3′UTR) of target mRNAs [8]. It is well-accepted that miRNAs play critical roles in nearly all biological processes, including cellular proliferation, differentiation, apoptosis, disease, and development [9]. Moreover, studies have reported that miRNAs regulate cellular homeostasis, including proliferation, differentiation, and apoptosis, during intestinal development [10,11].
Thus, to identify miRNAs that play critical roles on intestinal dysfunction during the suckling-to-weaning transition in pigs, we evaluated miRNA expression profiles during the suckling-to-weaning transition in pigs. In addition, we identified candidate targets for differentially expressed miRNAs and analyzed gene ontology (GO) and Kyoto Encyclopedia of Genes and Genomes (KEGG) pathways for the functional categorization of target genes.
MATERIAL AND METHODS
Crossbred ([Yorkshire × Landrace] × Duroc) pigs were housed in an environmentally controlled room with a slatted plastic floor. Nine piglets (n = 3, each group) were sedated using xylazine and ketamine and then euthanized with an overdose of pentobarbital administered via an ear vein before weaning (BW), 1 week after weaning (1W), and 2 weeks after weaning (2W). The abdominal cavity of each piglet was opened, and small intestine samples were collected. All intestine samples were frozen in liquid nitrogen and stored at −80°C. Total RNA was isolated using TRIzol reagent (Invitrogen, Carlsbad, CA, USA). RNA quality was assessed using Agilent 2100 Bioanalyzer with RNA 6000 Pico chip (Agilent Technologies, Santa Clara, CA, USA). RNA was quantified using NanoDrop 2000 spectrophotometer system (Thermo Fisher Scientific, Waltham, MA, USA).
Library was constructed using NEBNext Multiplex Small RNA Library Prep kit (New England BioLabs, Ipswich, MA, USA) as per the manufacturer’s instructions for the control and test RNAs. In brief, for library construction, 1 µg of total RNA from each sample was used to ligate the adaptors, and cDNA was then synthesized using reverse transcriptase with adaptor-specific primers. Polymerase chain reaction (PCR) was performed for library amplification, and a clean-up of the libraries was performed using QIAquick PCR Purification kit (Qiagen, Hilden, German) and AMPure XP beads (Beckmancoulter, Brea, CA, USA). The yield and size distribution of the small RNA libraries were assessed using Agilent 2100 Bioanalyzer instrument for a high-sensitivity DNA assay (Agilent Technologies). High-throughput sequences were produced using NextSeq500 system by way of single-end 75 bp sequencing (Illumina, San Diego, CA, USA).
Sequence reads were mapped using bowtie2 software tool to obtain .bam files (an alignment file format). A mature miRNA sequence was used as a reference for mapping. Read counts mapped on the mature miRNA sequence were extracted from the alignment file using bedtools (v2.25.0) and Bioconductor with R statistical programming language (version 3.2.2). The read counts were then used to determine the expression level of miRNAs. The quantile normalization method was utilized for comparison between samples.
The target genes of the selected miRNAs were predicted using miRDB database (http://www.mirdb.org/). The functional annotation tool DAVID (http://david.ncifcrf.gov/) was used for GO and KEGG pathway analysis of the predicted target genes. The data was retrieved, and a p-value of < 0.05 was considered a statistically significant difference.
RESULTS
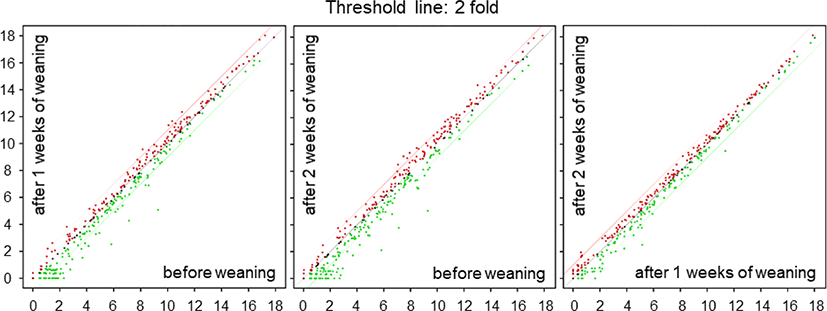
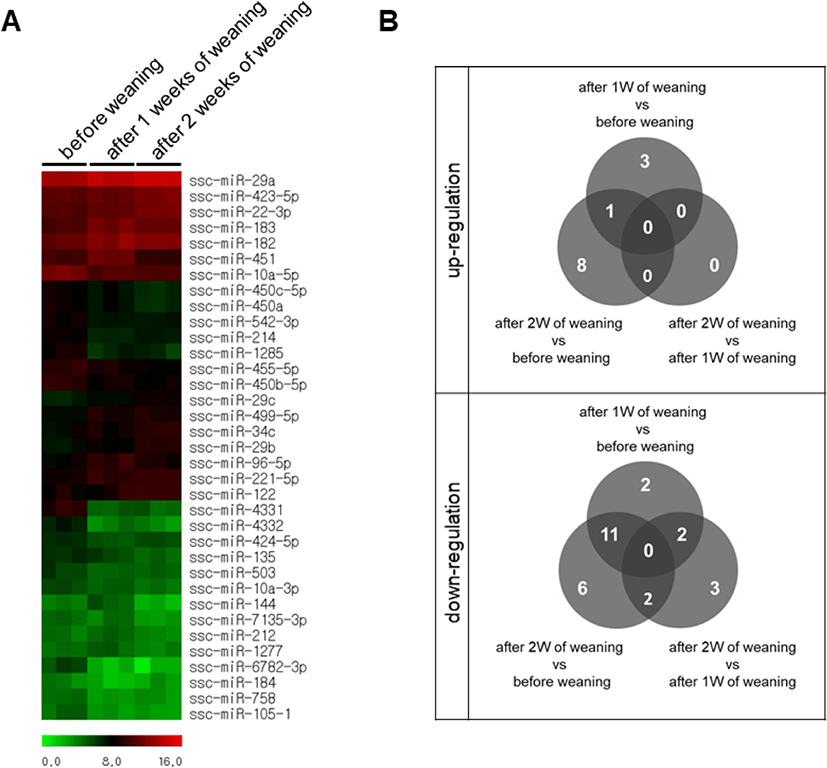
We performed a high-throughput sequencing of small RNA isolated from the small intestine tissue of piglets at BW, 1W, and 2W (Fig. 1) to identify differentially expressed miRNAs at different time-points. We found 19 differentially expressed miRNAs with varied expression levels between BW and 1W, of which 6 were upregulated and 13 were downregulated at 1W (Table 1). Likewise, 28 differentially expressed miRNAs were identified between 2W and BW, of which 9 were upregulated and 19 were downregulated (Table 2). Moreover, there were seven differentially expressed miRNAs between 2W and 1W, all of which were downregulated (Table 3). Finally, a total of 38 differentially expressed miRNAs with different expression levels were found among BW, 1W, and 2W; of these, 12 were upregulated and 26 were downregulated across the 3 time-points (Fig. 2A). Among the 12 upregulated miRNAs, 3 miRNAs (ssc-miR-96-5p, ssc-miR-183, and ssc-miR-182) were upregulated at 1W compared with BW (Fig. 2B) and 8 miRNAs (ssc-miR-29b, ssc-miR-34c, ssc-miR-29c, ssc-miR-29a, ssc-miR-122, ssc-miR-22-3p, ssc-miR-221-5p, and ssc-miR-423-5p) were upregulated at 2W compared with BW. No changed miRNAs were identified at 2W compared with 1W. In addition, among the 26 downregulated miRNAs, 2 miRNAs (ssc-miR-493-3p and ssc-miR-184) were downregulated at 1W compared with BW (Fig. 2B), 6 miRNAs (ssc-miR-450b-5p, ssc-miR-455-5p, ssc-miR-10a-3p, ssc-miR-450c-5p, ssc-miR-450a, and ssc-miR-135) were downregulated at 2W compared with BW, and 3 miRNAs (ssc-miR-1277, ssc-miR-212, and ssc-miR-224) were downregulated at 2W compared with 1W. From these results, it is clear that the suckling-to-weaning transition significantly affects miRNA expression levels in the small intestine.


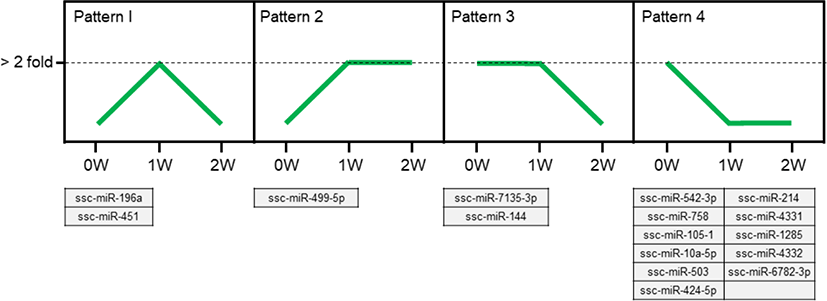
We identified 4 types of expression patterns from the 16 differentially expressed miRNAs that were commonly expressed during the weaning process (Fig. 3). Pattern 1 is represented by ssc-miR-196a and ssc-miR-451, which showed a pattern of increased expression at 1W and decreased expression at 2W. Pattern 2 is represented by ssc-miR-499-5p, with an increased expression at 1W and a stable expression at 2W. Pattern 3 is represented by ssc-miR-7135-3p and ssc-miR-144, with a stable expression at 1W and a decreased expression at 2W. Eleven miRNAs (ssc-miR-542-3p, ssc-miR-214, ssc-miR-758, ssc-miR-4331, ssc-miR-105-1, ssc-miR-1285, ssc-miR-10a-5p, ssc-miR-4332, ssc-miR-503, ssc-miR-6782-3p, and ssc-miR-424-5p) represent pattern 4, showing a decreased expression at 1W and a stable expression at 2W. We focused on ssc-miR-196a (pattern 1) for further analysis.

The predicted target genes of miR-196a-5p were identified using the miRDB database. Because a target prediction database for pig is unavailable, we analyzed the prediction targets of human and mouse miR-196a-5p that represent the same miRNA sequence as that of pig miR-196a (Table 4). We found 370 and 296 candidate targets for hsa-miR-196a-5p and mmu-miR-196a-5p, respectively (Fig. 4A and Supplementary Tables S1 and S2). A total of 133 candidate genes were common between these candidate targets of hsa-miR-196a-5p and mmu-miR-196a-5p.
| Species | miRNA name | miRNA sequences |
|---|---|---|
| Pig | ssc-miR-196a | UAGGUAGUUUCAUGUUGUUGGG |
| Human | hsa-miR-196a-5p | UAGGUAGUUUCAUGUUGUUGGG |
| Mouse | mmu-miR-196a-5p | UAGGUAGUUUCAUGUUGUUGGG |

GO enrichment analysis using the DAVID database showed that the 133 common targets comprised 19 biological processes, 4 cellular components, and 8 molecular functions (Supplementary Table S3). The GO targets were associated with the negative regulation of transcription of the RNA polymerase II promoter, anterior/posterior pattern specification, the transforming growth factor beta receptor signaling pathway, zinc ion binding, and chromatin binding. KEGG pathway analysis revealed that the differentially expressed genes were significantly enriched in miRNAs for cancer pathway, the PI3K–Akt signaling pathway, the MAPK signaling pathway, choline metabolism in cancer, the GnRH signaling pathway, Epstein–Barr virus infection, and the neurotrophin signaling pathway (Fig. 4B).
DISCUSSION
Mammals, including pigs, experience the most physiologically, environmentally, and socially stressful changes during the weaning process, and these stresses can affect susceptibility to disease as well as productivity types, including growth rate, feed intake, and feed efficiency [1,12]. From a physiological viewpoint, the most extreme changes occur in the intestine [6]. The transition from liquid to solid feed leads to structural changes in the intestinal villi because of the lack of digestive enzyme secretion, excluding those for lactose, during the weaning process at 3 or 4 weeks after birth [12,13]. The dramatic change in intestinal villi structures can cause diarrhea during the weaning process that directly affects intestinal barrier functionality, immunity, and wound healing processes [4,14,15]. Moreover, several studies have demonstrated that dramatic physiological changes induced by the weaning process affect gene expression profiles in intestinal tissues [16–19]. In the present study, we revealed that the weaning process affects miRNA expression profiles: 38 differentially expressed miRNAs had different expression levels across the 3 time-points studied (BW, 1W, and 2W). A previous report identified 136 differentially expressed miRNAs in weaning piglets at 1, 4, and 7 days after weaning from jejunal small RNA libraries [20], which is consistent with the findings of this study. Based on these findings, we suggest that the weaning process directly affects the expression profiles at the transcriptional and posttranscriptional levels.
The present study showed that intestinal development during the weaning process can affect miRNA expression profiles. miRNA, as a posttranscriptional regulator, modulates gene expression by binding to the 3′UTR of target mRNA in almost all cells, thereby affecting biological processes, development stages, and molecular functions. Moreover, studies have demonstrated that the development and biological functions of the intestine, including renewal, homeostasis, and inflammation, are regulated by miRNAs, as is the case with other tissues [21–24]. miR-34a and miR-320a strengthens intestinal barrier function by regulating tight-junction proteins in inflammatory bowel disease [25,26]. As was previously reported, miR-126 directly inhibits the expression of S1PR2, resulting in the impairment of the intestinal barrier function via the PI3K–AKT signaling pathway [27]. The present study revealed that miR-196a expression was altered during the suckling-to-weaning transition and that miR-196a directly regulates target genes related to anterior/posterior pattern specification as well as the cancer, transforming growth factor beta receptor signaling, PI3K–Akt signaling, and MAPK signaling pathways in the development of small intestines during the weaning process. Based on these results, we suggest that miR-196a regulates the morphology and proliferative activity in the development of small intestines in piglets during the suckling-to-weaning transition. However, target validation assays for miR-196a are required for the accurate verification of targets and functions.
In the present study, we collected small intestine samples at different time-points (BW, 1W, and 2W) based on the functional changes of villous atrophy and crypt elongation after weaning [3]. Weaning induces the shortening of villi and increased crypt depth for approximately 1W [28,29]. Thus, the present study classified differentially expressed miRNAs at three time-points into four categories based on expression patterns. Of these four categories, we focused on pattern 1 as a critical time-point because of its increasing expression at 1W and weakening expression at 2W. We showed that ssc-miR-196a and ssc-miR-451 represent pattern 1 in the present study among the 38 differentially expressed miRNAs. It is known that miR-451, which is a tumor marker for gastric and pancreatic cancer, promotes cell proliferation and metastasis [30,31]. Moreover, previous reports demonstrated that miR-196a promotes tumor growth and migration via signaling pathways, including the PTEN/Akt/FOXO1 pathway [32]. The present study revealed that miR-196a regulates various signaling pathways, including those of PI3K–Akt, MAPK, and GnRH. Functional studies, including those on the knockdown or overexpression of miR-196a, are required in the future.
In conclusion, the present study identified 38 differentially expressed miRNAs using the high-throughput sequencing of small RNA isolated from the small intestine tissue of piglets during the weaning process. We showed that ssc-miR-196a and ssc-miR-451 show increasing expression at 1W and weakening expression at 2W, which are critical time-points in piglet development. We expected that miR-196a regulates target genes associated with various signaling pathways, including those of PI3K–Akt, MAPK, and GnRH. Thus, the present study findings indicate that miRNAs regulate the development of small intestines during the weaning process of piglets.


