INTRODUCTION
Retaining alfalfa nutritive value along with the increase of its yield becomes the focus with the release of low lignin alfalfa varieties. Lignin content accumulates during morphological development of plant [1,2]. The detergent fiber system built by Van Soest [3] is the most prevalent criterion in forage-livestock industries, and lignin is defined as the least digestible portion of fiber of the forage sample. Cell wall digestibility altered by lignin content level stands for the nutritive value of the alfalfa [4]. Pedersen et al. [5] reviewed that the reduction of lignin content could escalate leaf/stem ratio. However, researchers also suspect the yield loss and lodging issue due to the decrease of lignin content. Studies involving reduced lignin alfalfa have shown their potential to maintain forage yield in the seeding and first production year [6,7].
Lignin content in alfalfa is proportional to non-neutral detergent fiber (NDF) fiber and acid detergent fiber (ADF) [8]. The correlation between ADF and acid detergent lignin (ADL) has been documented ranging from 78% to 86% [3,9,10]. Van Soest [3] estimated digestibility of the cell wall by a linear equation regarding ADF only. A recent study involving reduced lignin alfalfa showed that ADF, NDF and crude protein (CP) concentrations for harvesting under 40-day and 45-day intervals were similar [7].
The timing of harvests has an essential role in forage yield and quality [11]. 28-day harvesting interval has been used for alfalfa production regarding yield and quality. Delaying from 28-day to 35day results in yield increase and quality decline regarding alfalfa varieties without low lignin trait. Weir et al. [12] reported alfalfa harvested at 1/10 bloom stage provided high nutritive values regarding reasonable yield when averaging data from three production years. A study in Minnesota has shown that alfalfa at early flower has the highest leaf yield across three locations, and harvest intervals were 35-day and 40-day for the second and third cutting [13]. Forage yield and nutritive values of 30-day harvest intervals shows consistent lead than those of 40-day harvest intervals for the seeding year and the first production year [7]. Kallenbach et al. [14] suggested harvest alfalfa five times for high quality and four times for high yield in the lower Midwest.
Concentration of CP increased with shorter harvest intervals [14,15]. Sheaffer and Marten [16] reported that CP concentration and harvest interval had a negative relationship except for the final cutting due to the slower growth in the late season. However, one of the previous studies has shown that no differences in CP concentrations between alfalfa cutting at bud flower and full flower [17].
Alfalfa varieties with low lignin trait could develop a higher leaf/stem ratio or delaying plant maturity resulting in lower lignin content compared to reference varieties [7]. Results from an experiment in seeding year in California and Pennsylvania showed that Hi-Gest 360 and HarvXtra-008 were similar in neutral detergent fiber concentrations digestibility (NDFD) and relative forage quality (RFQ). However, the reduced lignin alfalfa produced less ADL compared to the low lignin alfalfa [6].
Another suggestion for cutting alfalfa is at the 50% of the bud stage, as a trade-off between quantity and quality of forage, based on using average quality data, the first three cuttings, or individual cutting. In this study, we introduce the weighted mean nutritive value regarding forage production of each cutting, and economic income (EI) index simulating the value of each cutting based on relative feed value (RFV) and then summation.
Research from Missouri suggests that seeding rate around 17 kg ha−1 have no effect on alfalfa stand [18]. Lloveras et al. [19] found that only using seeding rate of 10 kg ha −1 had little effect on alfalfa total yield of the first three years in one of three experiments, while total yield and stand densities of seeding rates with 20 kg ha−1 were similar to those of 30 kg ha−1 and 40 kg ha−1. Similar results reported by Hansen and Krueger [20] that no yield increase with 18 kg ha−1 in the second year compared with 9 kg ha−1. The fineness of stems related to forage quality could be the result of using high seeding rate [21]. Lignin, the majority polymer of cell walls, hardens and strengthens cell walls [22]. Hi-Gest 360 was reported 7%–10% lower in lignin content than non-selected commercial varieties [23]. Impact of the low seeding rate could be compensated by low lignin feature of the new varieties. However, few studies have been done on evaluating the effect of seeding rate on forage yield and quality of low lignin alfalfa variety.
Field evaluations are necessary for comprehensively understanding the performance of low lignin alfalfa under diverse treatments. The objectives of this study were to compare forage yield and nutritive value of low lignin alfalfa and two reference varieties subjecting to two harvest intervals and three seeding rates during the seeding year, the first and second production years.
MATERIALS AND METHODS
Alfalfa was seeded in 2015 and harvested in 2016 and 2017 at the Department of Agronomy Ashland Bottom Research Farm (39.13° N, 96.63° W) near Manhattan, KS. The soil type was Belvue silt loam (rarely flooded). Soil samples were taken and submitted to the Kansas State University Soil Testing Lab to check soil fertility, with soil pH 7.9, 125 mg kg-1 phosphorus, and 332 mg kg-1 potassium. Monthly mean maximum, minimum temperature, and monthly rainfall data were collected for each year (Table 1) [24].
The experimental design was a randomized complete block in a split-split plot arrangement with four replicates. The whole plots were two cutting intervals, subplots were three seeding rates, the sub-sub plots were three varieties. The field was divided into four blocks with enough alleyway. Each block was divided into two whole plots, and two harvest intervals were randomly assigned to the whole plots within each block. Each whole plot was divided into three subplots, and three seeding rates were randomly assigned to the subplots within each whole plot. Each subplot was divided into three sub-sub plots, and three varieties were randomly assigned to each sub-sub plot. Two cutting intervals were 28-day and 35-day and three seeding rates were 17 kg ha-1, 20 kg ha-1 and 23 kg ha-1. Three alfalfa varieties, Hi-Gest 360 (low lignin), Gunner (conventional) and RR Tonnica (roundup ready) were planted on April 29th, 2015. The first cutting of alfalfa under 28-day interval in each year were determined when alfalfa plant reached the height of 60 cm or at the late bud stage, and 35-day intervals were seven days later following the early cut.
The harvesting was performed 3 cm high from soil level by a flail type forage harvester. The area of each plot was 1 m × 4.5 m. Samples were collected, placed into paper bags, and put in a cooler; bags were taken out of the cooler, weighed, and placed in a dryer at 60°C for 72 hours and dried to constant weight to determine percent moisture (dry matter) and dry matter yield.
Dried alfalfa samples were ground through a 1 mm Wiley mill and analyzed for CP, ADF, and NDF concentrations. CP concentrations for subsamples were determined by measuring total N content using the micro-Kjeldahl technique outlined by Wall and Gehrke [25] and then multiplying total N percentages by 6.25. ADF and NDF concentrations for subsamples were determined using the wet chemistry methods reported by Van Soest et al. [26].
The RFV index determines digestible dry matter (DDM) of the alfalfa from ADF and estimates the dry matter intake (DMI) potential from NDF [27]. In this study, average CP, ADF, NDF, and RFV were the weighted mean and calculated as follows:
n represents harvesting times, y is the dry matter production for the ith cutting, and xi represent the nutritive values for the ith cutting. The application of the weighted mean takes consideration of the yield when combining all cuttings.
Alfalfa was valued at $1.00/point RFV, which was based on the Kansas Hay market Report (Source: Kansas Department of Agriculture, http://www.ams.usda.gov/mnreports/DC_GR310.txt). Economic incomes (dollar/ha) were equal to the relative value times forage production of each harvesting.
Data were analyzed using the GLIMMIX procedure in SAS 9.04 (SAS Institute, Cary, NC). The experimental unit is the single plot, and statistical significance was set at p < 0.05. The analysis of the seeding year (2015), first production year (2016), and the second production year (2017) was completed separately. Block was a random effect; harvest interval, seeding rate and variety were fixed effects. For 28-day interval, there were four cuts in 2015 and five cuts in 2016 and 2017; 35-day interval, there were three cuts in 2015 and four cuts in 2016 and 2017. Yield data were collected for three years, nutritive data only included 2016 and 2017. Multiple comparisons were performed on significant effects using the Bonferroni test.
RESULTS AND DISCUSSION
Mean monthly air temperature for the 2015 summertime tended to be cooler than the 2016 and 2017 summertime (June to August) (Table 1). Rainfall from April to September contributed 77%, 87% and 68% of total rainfall in 2015, 2016 and 2017, respectively. Average monthly maximum air temperature from June to Aug was 32.1°C, which was 1°C higher compared to 2015 and 2017. In 2017, daily rainfall during June, July, and August occurred less frequently compared to the previous two years.
Harvest interval affected dry matter yield across three years (Table 2). For the seeding year and first production year, five cuts made by 28-day interval produced more yield than four cuts by the 35-day interval. However, the inadequate rainfall in May 2017 affected the first cutting overturning the advantage of the five-cut system (Table 3 and 4). With limited regrowth of alfalfa before the first cutting due to unfavorable weather condition, alfalfa production for the first and second cutting was abolished by short intervals (Table 4).
The effect of variety only pronounced during the seeding year in 2015 with the higher yield of RR Tonnica compared with the yield of Hi-Gest 360. Three varieties did not show a significant difference in yield in the first and second production year (Table 3). The research comparing reduced lignin with reference varieties in Minnesota, U.S. has concluded that varieties showed little differences in forage dry matter yield in the first production year [7]. Hansen and Krueger [20] showed that yield differences among varieties were observed in the first and second years. Moreover, Kallenbach et al. [14] reported more significant effects of variety on alfalfa yield except the third year of a five-year study.
In 2016, alfalfa yield of the 28-day interval tended to be low in the first cutting, higher for the second and the third cutting, and low again for the fourth and fifth cutting. In 2017, limited rainfall during June and July attributed to relatively low alfalfa yield under 28-day interval, and the trends of the 35-day interval (4-cut) were similar in both years. Several studies have documented similar yield fluctuations at St. Paul, Minnesota and southwest Missouri [14,28]. For a shorter interval, a sharp production drop in the late cutting agrees with the results from a previous study comparing four harvest intervals of alfalfa with irrigation in California [12]. Newman and Justen [23] suggest that the first cutting of reduced lignin alfalfa might follow either when plant reaches a height of 60 cm or the same time producers harvest other conventional varieties.
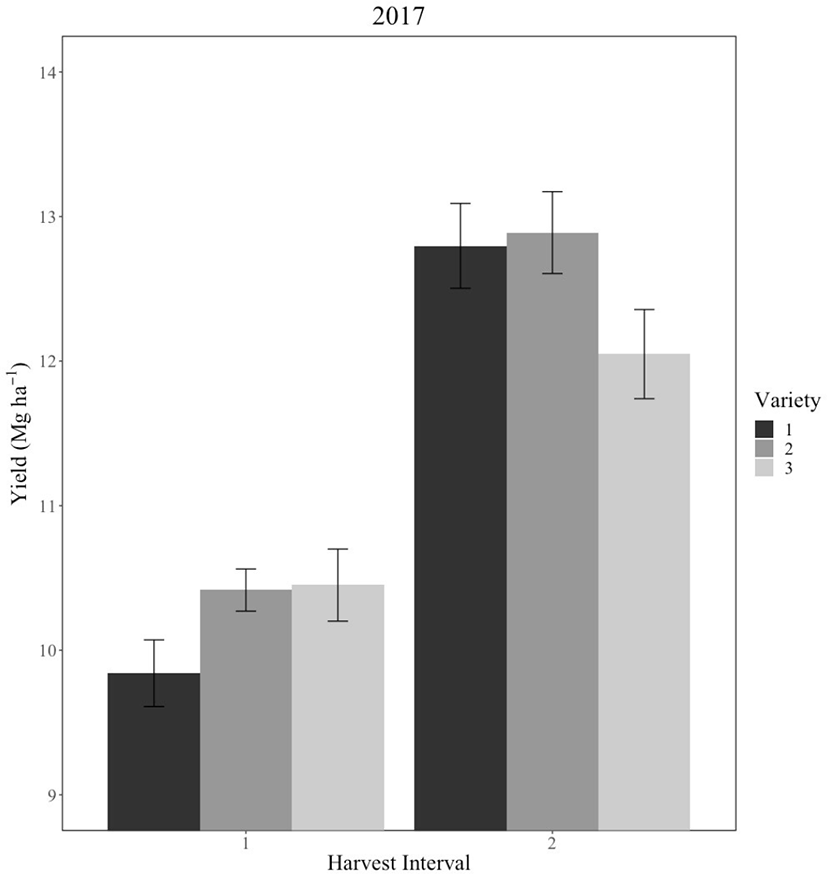
Harvest interval and variety interaction differed in alfalfa yield in 2017 (Table 2). The yield increase rate of RR Tonnica was less than the increase rate of Hi-Gest 360 and Gunner from the 28-day to 35-day (Fig. 1). The results at southwest Missouri also suggest that interactions between variety and harvest frequency were not significant for any year [20]. This indicates that harvest management strategies should be similar among different varieties if the higher yield is the goal of a producer.
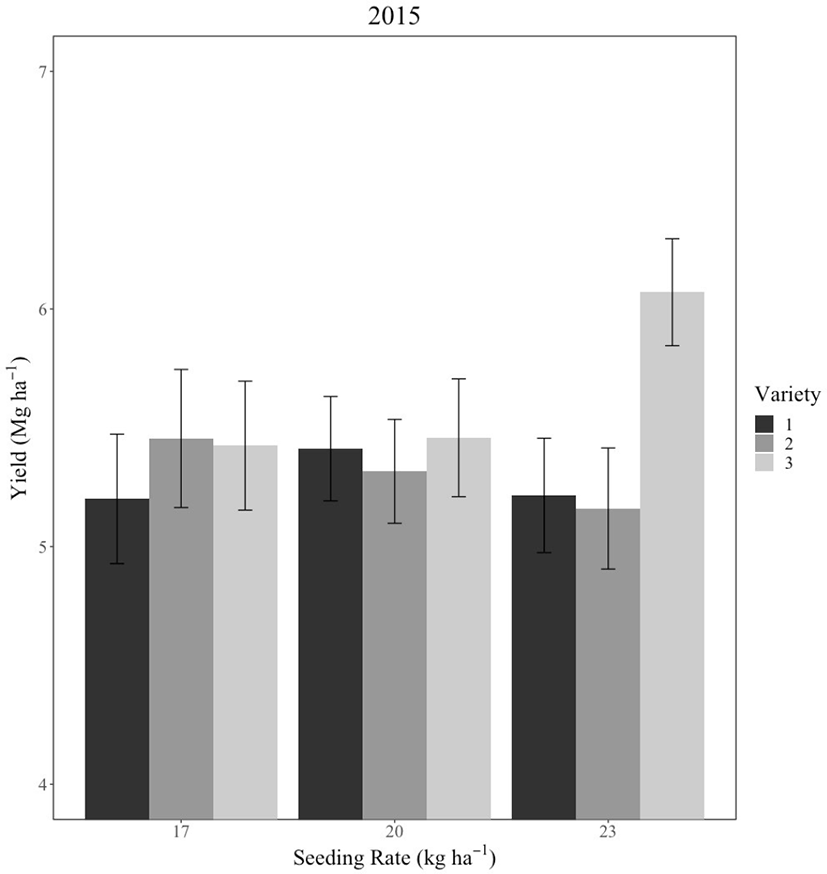
There was no harvest interval × seeding rate × variety interactions for dry matter yield in 2015, 2016 and 2017, respectively (Table 2). Two-way interactions were observed in 2015 and 2017. Combining the highest seeding rate and RR Tonnica provided the highest dry matter yield in 2015 (Fig. 2). Sund and Barrington [29] reported that dry matter yields were only observed increasing proportionally to the seeding rate (up to 32 kg ha-1) in the seeding year. Another previous study has indicated that the seeding year dry matter yield increases as the seeding rates increased up to 17 kg ha-1 with irrigation and 13.5 kg ha-1 under dryland [20]. In the seeding year, seeding rate had an effect on dry matter yield of alfalfa with irrigation or under favorable weather condition.
Short harvest interval consistently increased average CP concentration from all cuttings in both production years (Table 5). Harvest interval increasing CP concentration was found for the third cutting in 2016 and the second and fourth cutting in 2017. The effects of harvest interval were more consistent in 2017, and differences between harvest intervals tended to be great. That was due to limited rainfall before the growing season, and alfalfa plant were less mature due to the slow regrowth under the short harvest interval.
Our results are consistent with reports on the effect of harvest intervals on alfalfa CPs [15,16]. Shorter intervals between harvests decreased CP concentrations. Grev et al. [7] found that harvest intervals had a greater effect on CP concentration than the effect of varieties across four locations in Minnesota. The patterns of CP concentrations trends of alfalfa under 28-day and 35-day intervals were similar except 28-day interval in 2017 (Table 6). This agrees with findings from the previous studies [14]. CP concentration for the first cutting in 2017 under 28-day harvest interval was reduced due to the extremely low rainfall before the first cutting (Table 1). Peterson et al. [30] reported that CP level increased due to drought.
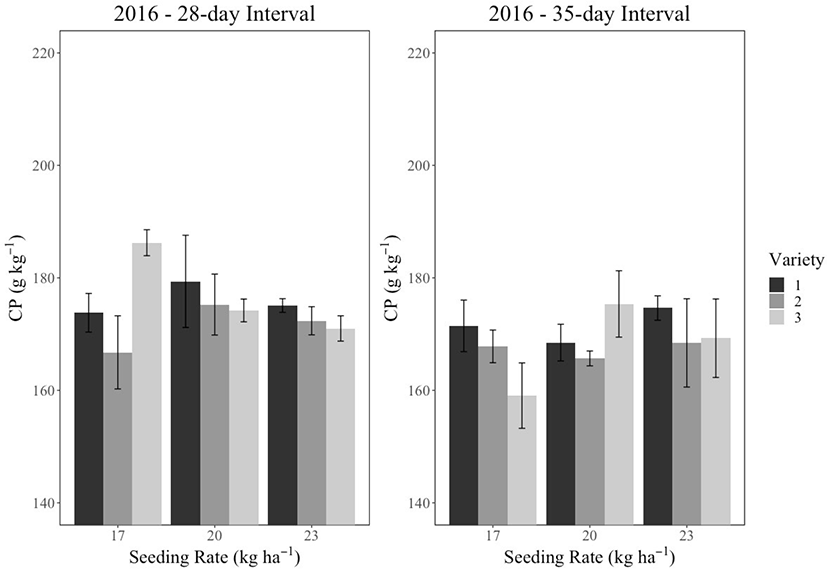
Harvest interval × seeding rate × variety interaction was observed in 2016 (Table 2). Results showed that more differences among the three varieties were observed in two harvest intervals (Fig. 3). Under 28-day interval (5-cut), RR Tonnica with the lowest seeding rate provided the highest yield and that was different from the other variety and seeding rate combinations. However, under the 35-day interval (4-cut), the effects of the lowest seeding rate on CP concentration of RR Tonnica tended to be decreased compared to the other two varieties.
In 2016, ADF concentrations fluctuated in an 80 g kg-1 range from the first cutting to the fifth cutting under 28-day interval and an 80 g kg-1 range from the first cutting to the fourth cutting under 35-day interval (Table 7). However, in 2017, both the ranges under two harvesting intervals fluctuated less. ADF concentrations of 28-day interval tended to be low in the first cutting, higher during summer time, and low again for the last cutting in 2016. These trends for ADF concentration by cutting among treatments were similar to the results by Kallenbach et al. [14]. In 2017, drought led to slightly higher ADF concentrations attributing a zig-zagged trend of ADF throughout cuttings.
Recent studies have reported that reduced lignin alfalfa varieties (HarvXtra technology) produced 4 to 20% less ADL content compared with reference varieties [7,31]. Hi-Gest 360 with conventional breeding technology contains 7% to 10% less lignin content [23]. Our results demonstrate a 4% reduction in ADF during the first and second production years.
Hall et al. [32] reported that higher forage quality of improved varieties were more pronounced during the first two cuttings. However, comparing ADF concentrations for each cutting in this study, the one-week delay did not always account for the higher ADF concentration of short interval, due to variable weather conditions. The average ADF concentration was calculated as weighted mean regarding alfalfa production by cutting, which showed consistent differences in 2016 and 2017.
No significant two-way and three-way interactions were observed in the average ADF concentration in 2016 and 2017. The 28-day interval (5-cut) increased average ADF concentration in both years compared to the 35-day interval (4-cut). Hi-Gest 360 was equivalent to or lower in average ADF concentration in the first and second production years than the other two varieties (Table 7). Seeding rates did not differ significantly for ADF concentration.
Harvest intervals showed significant differences in average NDF concentrations of each cutting in 2016 and 2017 (Table 2). Averaged over two-year data, NDF concentrations for alfalfa under 28-day interval (5-cut) were approximately 40 g kg-1 lower than those under 35-day interval (4-cut) (Table 5).
More fluctuation was observed for NDF concentration under 28-day interval in 2016 and 2017 (Table 8). A decrease of NDF concentration under 35-day interval at the fourth cutting existed in 2016 and 2017 regardless of different weather patterns of two years. Generally, NDF differences between two harvest intervals were larger at the first or second cutting than at the fourth or fifth cutting.
There was a significant difference in NDF among varieties in two production years (Table 5). Hi-Gest 360 was 12 g kg-1 lower than Gunner in 2016 and was 15 g kg-1 lower than Gunner and 19 g kg-1 lower than RR Tonnica in 2017. Variety effect was not consistent throughout the growing season. Data of each cutting in 2016 and 2017 suggest that low lignin variety tends to produce alfalfa with lower NDF, especially for the later cuttings (Table 8). Three varieties all showed the same patterns throughout all cuttings, NDF concentrations were higher in the first, second, and third cutting, and decreased for the fourth and fifth cutting. In Table 8, NDF concentrations of variety section were the average of two harvest intervals for the first to the fourth cutting. NDF concentrations for the fifth cutting only represented the 28-day interval. Previous studies have documented that NDF increases more rapidly in spring than in late summer [14,28,32].
Only the first three samples cut were used to determine alfalfa forage for a four-year study in southern Italy [17]. NDF concentrations in the second and third production years showed differences but no difference in NDF concentration on average of the two years. Our results could be an alternative way of evaluating forage quality on average of each cutting within a year. Moreover, weather variations likely contributed to the differences in NDF concentration among years, also morphological development (i.e., leaf /stem ratio, the mean stage count) of alfalfa plant could be affected by those weather changes when applying the fixed length of harvest intervals [28,32].
Differences of NDF concentrations among varieties across three locations were less pronounced during both the seeding year and first production year [7]. In a multi-location study, Undersander et al. [6] reported that there was no difference in NDF concentrations between Hi-Gest 360 and HarvXtra-008 in the seeding year.
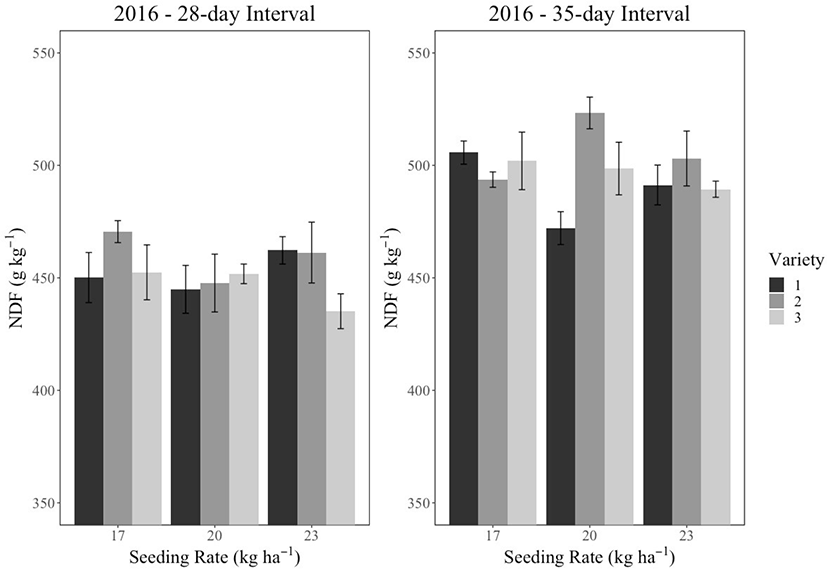
Harvest interval × seeding rate × variety interaction was significant in 2016 for NDF concentration (Table 2). Patterns for NDF fluctuation of variety and seeding rate combinations under 28-day interval was different from those under 35-day interval (Fig. 4). More differences of NDF concentrations among the three varieties were observed at low and high seeding rates under the 28-day interval. Inversely, more differences of NDF concentrations among the three varieties were observed at the medium seeding rate under 35-day interval.
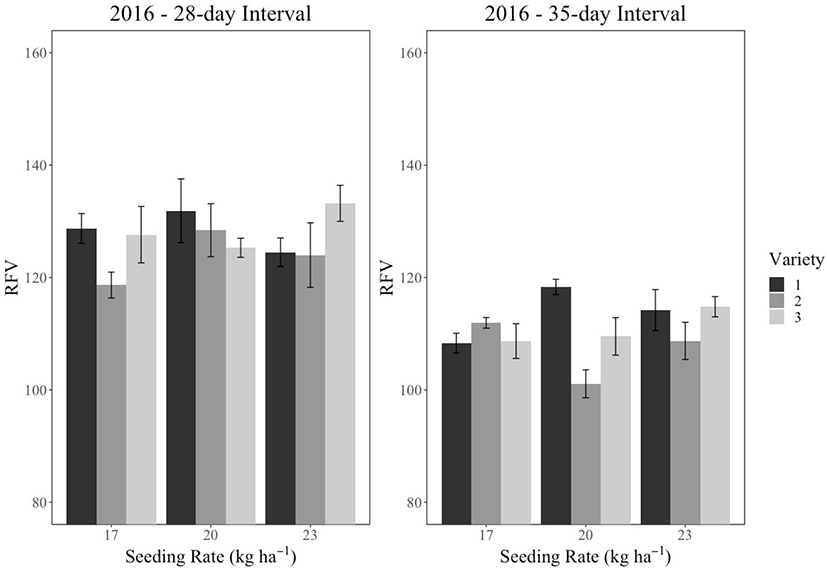
Varieties showed small differences in RFV (Table 5). Average over two production years, RFV for alfalfa harvested five times (28-day) was 16.5 higher than those were when harvesting four times (35-day) (Table 5). Our data suggest that Hi-Gest 360 produces alfalfa with higher RFV than the other two non-low lignin varieties. Producers aiming to make higher quality hay using low lignin alfalfa will have to choose the shorter harvest intervals in Kansas or places with similar weather conditions to Kansas.
The differences of RFV between two harvest intervals tended to be great during the first and second cutting (Table 9). RFV differences between two harvest intervals ranged from 2 to 37 in 2016, less differences in 2017 (8 to 31). Large differences of RFV occurred in the earlier cuttings.
In 2016, the lowest RFV happened at the seconding cutting for the 28-day interval, and at the third cutting for the 35-day interval. However, in 2017, the lowest RFV happened at the first cutting for the 28-day interval, and at the seconding cutting for the 35-day interval. Changes of RFV during a growing season suggest that weather had large effect on forage nutritive value at the second or third cutting due to summer slump.
The RFV index is a widely used in forage-livestock industries, representing both digestibility and intake potential of forage product [27,33]. However, the weighted RFV of each cutting takes consideration of the yield of each cutting and provides a more comprehensive way to review the quality of all cuttings.
RFV approximates digestible energy intake potential of forages with some variations coming from the real intake capacity from livestock and digestibility of NDF [34,35]. The major problem of RFV is underestimated the DMI of grasses [33]. This study only dealt with alfalfa varieties so the comparison of RFV should be applicable.
No significant two-way interaction terms were observed in RFV. Harvest interval × seeding rate × variety interaction was significant in 2016 for RFV (Table 2). Patterns for RFV fluctuation of variety and seeding rate combinations under 28-day interval were different from those under 35-day interval (Fig. 5). More differences of RFV concentrations among the three varieties were observed at seeding rates of 17 and 23 kg ha-1 under the 28-day interval. Inversely, more differences of RFV concentrations among the three varieties were observed at a seeding rate of 20 kg ha-1 under 35-day interval. This result was as expected due to the similar trends found in NDF (Fig. 4).
For the 28-day interval, EI approximately decreased from 448 dollars/ha for the first cutting to 212 dollars/ha for the fifth cutting in 2016. Due to weather variations in 2017, RFV reached the peak at the seconding cutting (339 dollars/ha) and hit the bottom at the fourth cutting 237 dollars/ha. However, for the 35-day interval in two years, EI tended to increase from the first cutting to second cutting, and then generally decreased throughout the rest two cuttings. Most valuable production under the 35-day interval was from the second cutting. Our data indicate that EI from each cutting of 4-cut system was higher than EI from each cutting of 5-cut system in 2017. Extra cutting of 5-cut system might not guarantee more incomes to surpass 4-cut system under different weather conditions. The below average rainfall during May, June and July in 2017 reduced production for the second, third and fourth cutting in the five-cut system (28-day) and directly decreased the contribution of EI similar to the four-cut system (35-day). However, total EI of the first and second production years justified the advantage of low lignin variety.
There were no differences among annual EI of the three varieties each year (Table 10). EI were greater for Hi-Gest 360 compared to Gunner for the fourth cutting in 2016 and were greater compared to RR Tonnica for the first cutting in 2017. Numerically, Hi-Gest 360 provided highest incomes in both 2016 and 2017. Our results suggest that harvest interval combining weather condition play a critical role in profitability of alfalfa production.
No significant interaction terms were observed for EI in 2016 and 2017. In 2016 and combining data from two years, harvest interval had a significant effect on EI. In 2017, harvest intervals, seeding rates, and varieties did not affect EI (Table 10).
CONCLUSION
The combination of variety, seeding rate, and harvest interval determined forage yield, nutritive value and EI of a certain management practice. It appears that Hi-Gest 360 (low lignin alfalfa) can provide similar yield potential and increased nutritive value compared to two reference varieties. Harvest interval had a large effect on forage quality and a greater effect on forage yield than variety selection. Under different harvesting system (5-cut, 28-day interval vs 4-cut, 35-day interval), the seeding rate and variety combination differed in CP and NDF concentrations, and RFV in 2016. The interactions of seeding rates and varieties had an effect on dry matter yield in the seeding year. In the seconding production year, under drought condition, yield differences between 28-day and 35-day interval of three varieties were not consistent. Based on two-year data, harvest interval had a large effect on nutritive value and a more significant effect on alfalfa dry matter yield than variety selection. Seeding rate did not affect alfalfa yield and nutritive value.


