
INTRODUCTION
Intramuscular fat (IMF) is an important carcass trait in beef production. Many farmers have been raising beef cattle with high-energy diets until 32 to 36 mo of age to maximize IMF deposition even though feed prices today are rising gradually. Energy restriction and feed efficiency (FE) are essential ways to minimize costs and maximize profits. Previous studies have reported that both of them could affect the composition of muscle cells and adipocytes in the longissimus dorsi muscle (LM) [1,2]. Roberts et al. [3] reported that energy restriction can decrease the subcutaneous fat thickness and improve nutrients utilization in cattle. Additionally, the number and size of intramuscular adipocyte cells are increased by suppressing muscle development in caloric restricted pigs [4]. The high content of IMF is found in low feed efficient animals rather than in high feed efficient animals since higher feed consumption of low feed efficient animals can be sufficient energy to deposit IMF [5,6]. It can be partially explained by the rate of muscle growth of inefficient animals is slower, which might help the IMF development. IMF deposition is positively affected by the reduced rate of muscle growth and weight gain [7,8]. For example, castration and vitamin A restriction increase IMF content by reducing the growth rate [9]. Moreover, nutrient restriction and FE can control the regulation of adipogenic transcription factor, such as peroxisome proliferator-activated receptor gamma (PPARγ) [10,11]. Taken together, we hypothesize that long-term energy restriction and FE would alter the profiling of muscle proteomes associated with muscle development and IMF accumulation. In this study, we investigated the global protein profiles related to caloric restriction (CR) and FE in LM of steer. Additionally, we made predictions about the roles of identified genes during myogenesis and adipogenesis of spontaneously immortalized bovine embryonic fibroblasts (BEFS).
MATERIALS AND METHODS
This feeding trial was performed at the Center for Animal Science Research, Chungnam National University, Korea. Animal use and the protocols for this experiment were reviewed and approved by the Animal Research Ethics Committee at Chungnam National University Animal Research Ethics Committee (Approval number: CNU-00347). A total of 32 Korean native steers (292 ± 6.95 kg) at 10 mon of age were randomly allotted to 16 pens (2 animals/pen) and the experiment last for 13 mon. One steer aged 15 mon in the CR group was removed by a mechanical accident.
Two trials were conducted to investigate adipogenic proteins related to long-term CR and FE in bovine LM. In the first trial (10–18 mon of age), steers were randomly distributed to 100% ad libitum (NEg = 0.63 Mcal/kg; n = 16) or CR (80% of the previous day’s feed intake of ad libitum group, n = 15) groups. In the second trial (18–23 mon of age), the energy value of 100% ad libitum diet was 1.13 Mcal/kg NEg and those in the CR group diet was 0.72 Mcal/kg NEg. At the endpoint of this experiment, animals in each group were divided into groups with high (n = 6) and low (n = 6) FE regardless of the nutritional level. Energy value in experimental diets was calculated using the NASEM (National Academies of Science, Engineering, and Medicine) [12] (Table 1). Feed was provided twice daily at 08:00 h and 17:00 h for all periods, and were given access to mineral blocks and water ad libitum. Individual daily feed intake was recorded using an automated feeding machine (TMR FEEDER; Dawoon, Incheon, Korea) and body weight (BW) was recorded monthly (Table 2).
Protein extraction and proteome analysis of LM tissues were conducted as previously described [13]. Tissue samples were collected at 23 mon of age from biopsy (Biotech Nitra, Republic of Slovakia) as follows: ad libitum group (n = 10), CR group (n = 10), low feed efficiency (LF) group (n= 6), and high feed efficiency (HF) group (n = 6). These were immediately frozen in liquid nitrogen and stored at −80°C before the experiment. The extracted protein samples were quantitatively pooled by group. Differentially expressed spots with at least a 2-fold change in intensity were used for electrospray ionization and quadrupole time-of-flight mass spectrometry analysis.
Blood parameters were performed to assess animal health and illness and to compare differences in steer classified by two different nutritional levels and FE. whole blood samples were taken via jugular venipuncture after morning meal and placed in 10 mL tubes with EDTA (Becton and Dickson, Franklin Lakes NJ, USA) for the analysis of blood cell count with the HM2 instrument (VetScan, Abaxis, Union City, CA, USA) [14].
Two bovine cell lines were used in this study, myogenic differentiation 1 (MyoD)-overexpressing (BEFS-MyoD) and PPARγ2-overexpressing BEFS cells (BEFS-PPARγ2), which are derived from immortalized BEFS. Two cell lines were grown and maintained in growth media containing Dulbecco’s modified essential medium (DMEM; Hyclone, Loga, UT, USA), 10% (v/v) fetal bovine serum (Hyclone), 1% penicillin/streptomycin (Gibco, Carlsbad, CA, USA), and 2 mM L-glutamine (Gibco). To induce the myogenesis of confluent BEFS-Myod cells, growth media was switched to myogenic induction media containing DMEM, 2% (v/v) horse serum (HyClone), 1.7 μM insulin, and 2 μM doxycycline (Calbiochem, San Diego, CA, USA). BEFS-PPARγ2 was grown on plates for 2 d post-confluence in the growth media. Adipogenesis was then induced with differentiation media (growth media containing 0.17 μM insulin, 1 μM dexamethasone, 0.5 mM isobutyl-1-methylxanthine, and 4.5 μM troglitazone for 48 h. Next, cells were maintained in the differentiation maintenance media (growth media supplemented with 0.17 μM insulin and 4.5 μM troglitazone) for 14 d by replacing the media every 2 d. Insulin, dexamethasone, isobutyl-1-methylxanthine, and troglitazone were purchased from Sigma Aldrich (St. Louis, MO, USA).
Cells were fixed onto plates with 10% formalin (Sigma Aldrich) in 1X Phosphate Buffered Saline (Biosesang, Seongnam, Korea) for 1 h, gently washed with 60% isopropanol (Merck Millipore, Darmstadt, Germany), completely dried, and stained with Oil red O staining solution (0.5% Oil-red O in isopropanol diluted 3:2 in water and mixed for 20 min at room temperature followed by filtering with a 0.22 μm filter) for 10 min at room temperature. After removing the staining solution, cells were washed four times with water and photographed using the inverted microscope (IX51, Olympus, Tokyo, Japan).
Total RNA was isolated with ice-cold Trizol Reagent (Invitrogen, Carlsbad, CA, USA). The concentration of RNA was measured using an ND-1000 spectrophotometer (NanoDrop Technologies, Wilmington, DE, USA). The A260/A280 ratios of all RNA samples were above 1.8. RNA integrity was assessed with the RNA 6000 Nano LabChip kit and Agilent 2100 Bioanalyzer (Agilent Technologies, Santa Clara, CA, USA). RNA from tissues and cell lines had a median RNA integrity number of 7.6 ± 0.3 and 9.7 ± 0.5, respectively (data not shown). First-strand cDNA was synthesized using RNA (1 μg) and iScript cDNA synthesis kit (Bio-Rad, Hercules, CA, USA) according to the manufacturer’s instructions. Real-time PCR was performed in a total reaction volume of 20 μL in 96-well plates using Chromo4™ four-color Real-time detector (MJ Research, Waltham, MA, USA). The reaction mixture contained 100 ng cDNA, 10 μL of 2X SYBR Green PCR Master Mix (Bio-Rad), and 0.6 μL of 10 μM primers (Bioneer, Daejeon, Korea) in RNA/DNA free water. Thermal cycling conditions were as follows: an initial incubation at 95°C for 3 min followed by 40 cycles of denaturation at 95°C for 10 s, annealing at 60°C for 30 s, and extension at 72°C for 30 s, after which samples were heated at 95°C for 10 s, cooled to 65°C for 5 s and then heated to 95°C at a rate of 0.5°C/s. We used the National Centre for Biotechnology Information Primer-BLAST for primer design (Table 3). Relative fold-changes were determined using the 2-ΔΔCT method [15]. All data were normalized against β-actin as a housekeeping gene.
1) Database protein names and accession numbers: NCBI (http://www.ncbi.nlm.nih.gov).
All values given in each table or figure were presented as mean ± SEM. The independent sample t- test was used for the analysis of data from growth performance comparing i) the ad libitum and CR groups and 2) HF and LF groups, and for the data from quantitativePCR analysis using muscle samples and from blood analysis. Data from in vitro experiments were compared using the Tukey test. Statistical analyses were performed using SPSS 18 software (SPSS, Chicago, IL, USA). The level of statistical significance was set at p < 0.01 or p < 0.05.
RESULTS
Growth performance (BW, daily feed intake, average daily gain, and FE) of the ad libitum group was higher than that of the CR group (Table 2). Even though the HF group consumed 20% less feed on average than steers in the LF group, the average daily gain in HF group was significantly higher than that in LF group during the whole period. As a result, there was a difference in BW (p < 0.05). Therefore, animals with HF efficiently used more nutrients than animals with LF (53.6 g/kg vs 32.8 g/kg for HF vs LF groups, respectively).
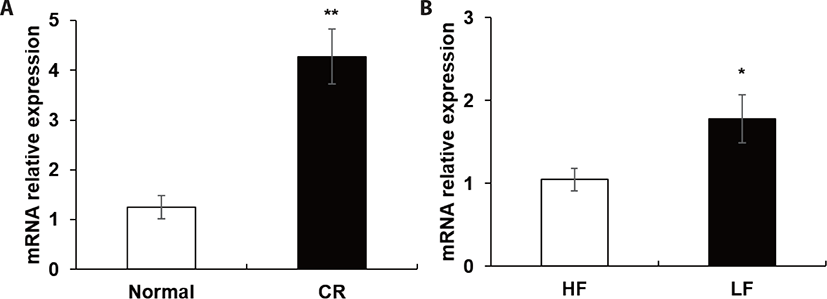
Nine spots were selected between ad libitum and CR groups (Fig. 1). Compared to the ad libitum group, in the CR group, 6 proteins had higher expression whereas 3 proteins had lower expression (Table 4). In the LF group, the expression of 7 proteins was higher, however, that of 5 proteins was lower than the HF group (Table 5). Notably, in our proteomic study, heat shock protein beta-6 (HSPB6) was commonly up-regulated in both CR and LF groups. The transcriptional levels of HSPB6 also revealed statistical significance in the LM of the CR group and the LF group (p > 0.05) (Fig. 2).
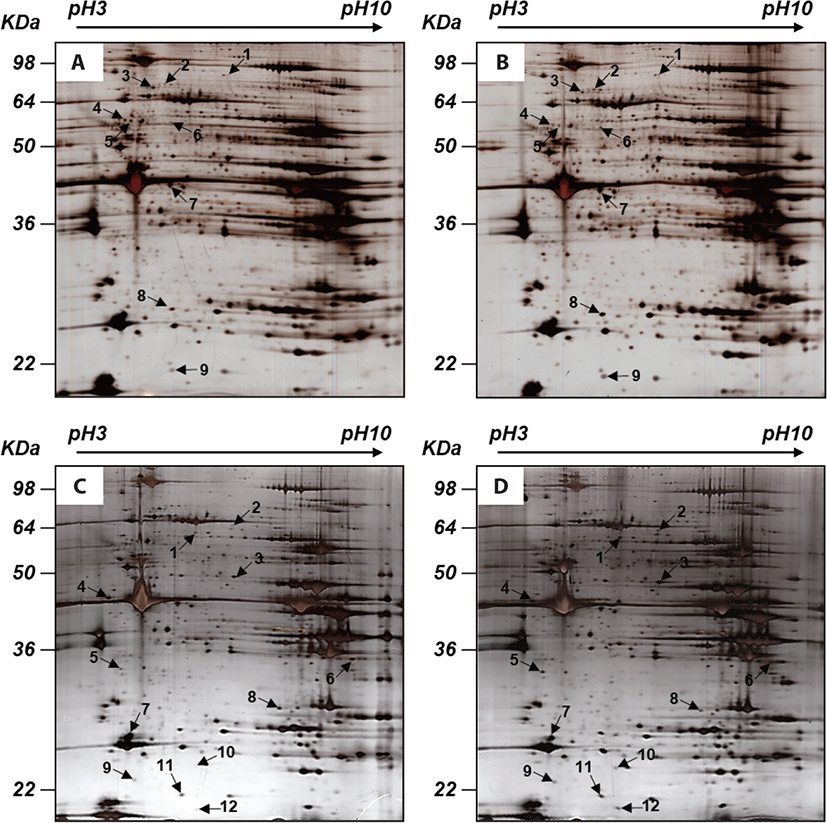
1) The spot number refers to Fig. 1.
2) Database protein names and accession numbers: UniProt (www.uniprot.org).
1) The spot number refers to Fig. 1.
2) Database protein names and accession numbers: UniProt (www.uniprot.org).
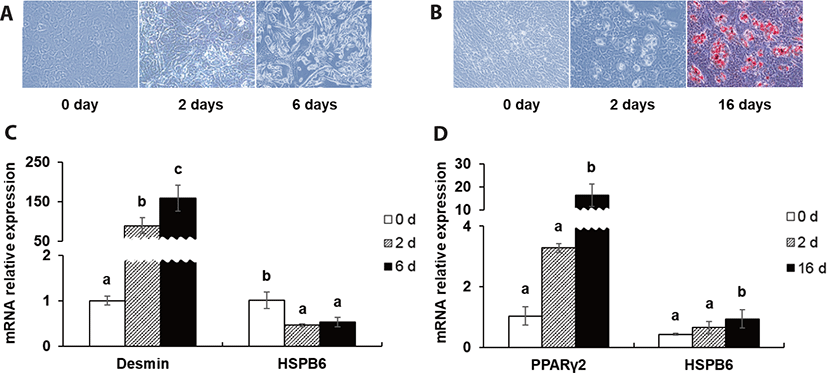
To make predictions about the roles of HSPB6 during myogenesis and adipogenesis, BEFS-MyoD and BEFS-PPARγ2 cell line system was used. Oil red O staining and mRNA expression of desmin and PPARγ2 were used as a myogenic- and adipogenic differentiation marker. The mRNA expression of HSPB6 was decreased after initial- and post- myogenic differentiation (p < 0.05), while that of HSPB6 was increased after initial- and post- adipogenic differentiation (p < 0.05) (Fig. 3).
Blood cell counts were analyzed to conduct a proteomic experiment in a situation characterized by CR and FE shown in the blood. As shown in Table 6, the CR group had a significantly higher white blood cell count than the ad libitum group (p < 0.05). The counts of hemoglobin and hematocrit were lower in HF group than LF group (p < 0.05), consistent with positive regressions between residual feed intake and these parameters [16]. These levels were within the normal range for cattle. Thus, our blood results showed that CR did not harm animal health.
DISCUSSION
In the present study, the ad libitum group with lower expression of HSPB6 at transcription and protein level has higher feed intake than the CR group. Peng et al. [17] reported that increased feed intake has been observed in HSPB6-KO mice, which showed a role of HSPB6 in regulating feed intake.
Notably, in our proteomic study, HSPB6 was commonly up-regulated in both CR and LF groups. Up-regulation of stress proteins can help cells survive nutritional restriction against oxidative stress and ultimately fortify its resistance to further oxidative stress [18,19]. In human and C. elegans studies, glucose restriction and CR promotes mitochondrial activity, causing an increase in reactive oxygen species (ROS) production [20]. In rodents, short and long-term CR increased the expression of PPARγ and CCAAT/enhancer binding proteins (C/EBP) in epididymal adipose tissue [21]. CR increased the number of intramuscular adipocytes about 40% compared to ad libitum Holstein steers during growing phase and the lipid content of LM at the end of the finishing phase, but it was not significantly different [6,22].
In porcine skeletal muscle, by protein and energy restriction gene expression related to mitochondrial function were up-regulated and accumulation of IMF was increased [4,23]. Gondret & Lebret [24] reported that lipid content in longissimus lumborum muscle and the number of clustered adipocytes were significantly increased in limit-fed pigs compared to control. The number and size of intramuscular adipocyte cells were increased by suppressing muscle development in CR pigs [4].
Interestingly, the greater abundance of HSPB6 was in LF animals compared to HF animals. Previous studies revealed that heat shock protein (HSP) is associated with FE in livestock. At protein and mRNA level of HSPB1 was upregulated in the skeletal muscle of cattle with HF [25,26], whereas gene expression of HSPB7 and protein expression of HSP60 and HSP70 were higher in skeletal muscle of broiler and pig with LF [27,28]. Moreover, increased ROS production and greater protein carbonyl levels have been associated with LF in steers [29,30]. Fan et al. [31] also reported that an elevated level of HSPB6 in mouse cardiomyocytes effectively reduced oxidative stress. HSP expression increased in the low-feed efficient phenotype in response to increased mitochondrial ROS to stabilize oxidatively damaged proteins in LF. Inefficient steers had more IMF content but HF beef heifers had 3.2% less IMF [5,32]. It can be partially explained by the rate of muscle growth of inefficient animals is slower, which might help IMF development because an IMF deposition is positively affected by the reduced rate of muscle growth and weight gain [7,8].
Both CR and LF delay the rate of muscle growth and weight gain. The growth rate affected the partitioning of fat, and high rates of weight gain result in relatively more subcutaneous fat instead of intermuscular fat [33]. The reduced rate of muscle growth and weight gain is accompanied by IMF accumulation and adipogenic differentiation [7,8,34]. An increase in intramuscular lipid content occurred with increased oxidative damage in aged human and older mice [35,36]. The production of ROS is a factor in promoting differentiation from human mesenchymal stem cells and 3T3-L1 cells to adipocyte and is increased during adipogenesis [37–40]. Considering these points, we cautiously postulate that increased HSPB6 expression in CR and LF animals may be associated with intramuscular adipogenesis and ROS generation in steer.
In the proteome study of human adipose-derived stem cells, HSPB6 and HSPB1 were induced with adipogenesis [41]. Wang et al. [42] reported that mRNA expression of HSPB1 was increased with IMF development in cattle. HSPB1 interacts with mitogen-activated protein kinase (MAPK) and phosphatidylinositol 3-kinase-protein kinase B (PIPKB)/Akt pathway induced by insulin-induced activation of the insulin like growth factor (IGF)-receptor 1, which influences adipogenic differentiation [43].
Moreover, mRNA expression of HSPB6 was decreased after myogenic differentiation in BEFS-MyoD but increased after adipogenic differentiation in BEFS-PPARγ2, which shows that HSPB6 may play a role in both bovine adipogenesis and myogenesis. HSPB6 has been considered to play roles in protein intracellular transport and the protection of structural proteins, such as desmin, actin, and titin [44,45]. During myogenic differentiation of C2C12 myoblast, the reduction in the mRNA expression of HSPB6 was observed [46], which is consistent with our results. HSPB6 interacts with other small HSPs, such as HSPB1 and HSPB5 in skeletal and smooth muscle. This interaction is thought to be a functional one, with HSPB6 regulating the function of HSPB1 [47]. HSPB1 abundance was higher also during the IMF accumulating phase [48]. In addition to our previous study, CR up-regulated HSPB1 [25]. Thus, we assume that HSPB6 can be closely interacted with HSPB1 in the LM of beef steer.
Recently, HSPB6 knockout mice increased both visceral and subcutaneous fat mass [17]. Also, the mRNA expression of HSPB6 was decreased during adipogenesis of mesenchymal stem cells derived from bone marrow from the bovine fetus [49]. These different results with ours probably indicate that many factors influence the mechanisms of HSPB6 involved in adipogenesis. Thus, further study is needed to clarify the more detailed functional role of HSPB6 on intramuscular adipogenesis related to CR and LF in a steer.
In conclusion, our study is an initial step of an ongoing larger effort to investigate key proteins associated with IMF development involved in CR and FE. At protein and transcription levels, HSPB6 was increased by CR and LF in LM. Additionally, the mRNA expression HSPB6 increased during bovine adipogenesis. Taking all of these results into consideration, increased HSPB6 may have a key role in the mechanism of IMF formation related to energy utilization in a steer. Further experiments to examine the function of HSPB6 on bovine adipogenesis are in progress in our research group.