


INTRODUCTION
Pesticides have been used as beneficial chemicals to protect cereals, fruits, and vegetables from damage by pests and to improve agricultural productivity. However, the risk of human health problems from using pesticides in foods has also risen. Pesticide toxicity includes neurotoxic effects, blood disorders, tumors, and birth defects [1,2]. Pesticides can be ingested via oral, dermal, inhalation, and ocular exposure. Unlike people who work with pesticides in agriculture or gardening, most agricultural product consumers are orally exposed to pesticides by consuming their residue in foods [3,4].
Pesticide residues refer to the measurable amounts of pesticides in foods that are used during cultivation and remain after food processing [5]. Authorized public health organizations indicate safe levels of pesticide residues in foods to minimize hazardous effects. For example, the Environment, Health, and Safety Division of the OECD provides guidance on minor uses of pesticides. In addition, there are limits to the legal maximum residue levels (MRLs) for pesticide residues in foods in Europe determined by the European Food Safety Authority [6–8]. The United States Environmental Protection Agency has also set a tolerance level for pesticide residues in and on foods to ensure the safety of food supplies for human consumption [9].
The presence of pesticide residues in livestock products has been recognized as a major hazardous element in dietary intake [10]. Meat, milk, and egg consumption has increased, which is highly related to human health [11]. Risk assessment of pesticide residues in livestock products is essential to address the potential risks to human health. Livestock products can be exposed to pesticides through various pathways, including feed, soil, water, and air [12,13]. Animal feed contains a large variety of agricultural commodities, and pesticides are used globally to cultivate agricultural commodities [14]. Therefore, pesticide residues in animal feed can be transferred to livestock products when livestock feed is contaminated with pesticides [15]. It is highly possible that pesticide residues in food originating from livestock products affect food safety and human health.
The Environment, Health, and Safety Division of the OECD Guidelines for the Testing of Chemicals on Residues in Livestock provides basic information on pesticide residue studies in livestock [16]. The MRL for pesticides in feedstuffs is set in accordance with the Good Agricultural Practices standard use for the pesticide, the residual amount in the tissues of animals fed the pesticide, and acceptable daily intake for humans [14]. The Codex Alimentarius Commission (www.fao.org) explains that pesticide residues must be at a safe level for consumers and must be as low as possible. Therefore, it is important to set MRL for food and animal feed.
Risk assessment of hazardous materials should be approached through scientific processes, including qualitative and quantitative information that can affect livestock. In addition, the relevant reference value, dose-response relationship, and animal experiments to investigate exposure assessment and estimate the risk for food safety should be considered [14].
Animals are commonly used to test hazardous materials in vivo. Livestock feeding practice is the most relevant scientific test for risk assessment of pesticide residues [14]. However, livestock are relatively large and require a larger housing environment. Livestock animals require special behavioral and social management, as well as higher purchase and maintenance costs, which could hinder the effective risk assessment of pesticide residues. On the other hand, small experimental animals are preferred in biomedical, toxicological, and basic research. For example, rodents are widely used as experimental animals that are easy to handle and cost- and time-effective because of their small size, short lifespan, short reproductive cycle, and relatively low maintenance cost [17,18]. Using small experimental animals as an alternative method to produce the necessary information for determining MRL would contribute to replacing or reducing livestock animals in risk assessment studies.
Sulfoxaflor is a commonly used sulfoximine-based pesticide [19]. Sulfoxaflor transfer from feed to livestock animals and resides in animal products has been confirmed previously [20]. Sulfoxaflor testing has been conducted to quantify the transfer of its residues to animal products, such as meat, fat, milk, eggs, and edible meat by-products [14,20]. Sulfoxaflor resides in the parent compound and produces no secondary metabolic product. In this study, we tested whether small experimental animals can be used as an alternative method to investigate pesticide residues to establish an MRL.
MATERIALS AND METHODS
All animal experiments were approved by the Institutional Animal Care and Use Committee of the National Institute of Animal Science, South Korea (approval number: NIAS-2018-317). The pigs and rats used in this study were observed according to ethical guidelines for animal protection.
Twenty-four Landrace × Yorkshire crossbred fattening pigs were used in this study. The pigs were randomly assigned to four groups, with six pigs per group, according to their initial body weight. The four groups were divided according to sulfoxaflor concentration in feed as follows: control, 0 mg/kg; T1, 3 mg/kg; T2, 9 mg/kg; T3, 30 mg/kg. Pigs were individually maintained in a separate pen (2.1 m × 1.4 m) with an automatic temperature control system (25 ± 1°C) and a ventilation system. Pigs were fed twice a day (3 kg/day) and provided ad libitum access to water. During the 4-week experimental period, the experimental feed was provided with different concentrations of sulfoxaflor. The daily feed intake of each pig was measured, and the body weight was measured at the beginning and end of the experiment. Body weight gain and feed conversion ratio (FCR) were calculated based on feed intake and measured body weight. After four weeks, the pigs were euthanized through exsanguination after anesthesia using T-16 (10 kg/1.2 mL). Blood, muscle, fat, liver, kidney, and small intestine tissues were collected, and their weights were measured. Muscle samples were collected from the loin region, and fat samples were collected from the fat in the middle of the back. Small intestine samples of approximately 10 cm were collected from a distance of 30 cm from the top of the duodenum.
Twenty-four Sprague-Dawley rats were used in this study. The rats were housed in individual conventional cages with a temperature control system (25 ± 1°C) and a ventilation system. The rats were randomly assigned to four groups, with six rats per group, according to their initial body weight. The four groups were divided according to sulfoxaflor concentration in feed as follows: control, 0 mg/kg; T1, 3 mg/kg; T2, 9 mg/kg; T3, 30 mg/kg. Rats were fed 22 g per day, and water was provided without restriction. The rat feed comprised a standard diet formulated according to AIN-93G [21]. Feed intake was measured daily for four weeks. To calculate productivity, rat body weight was measured at the beginning and end of the experiment. After four weeks of feeding, the rats were euthanized through CO2 inhalation, and blood, muscle, fat, liver, kidney, and small intestine tissues were harvested to investigate pesticide residues. The formulations of each experimental feed for pigs and rats used in this study are listed in Table 1.
Sulfoxaflor water-dispersible granules (94.5%) were purchased from Dongbang Agro (Seoul, Korea). The sulfoxaflor concentrations orally administered to pigs and rats were calculated based on the daily feed intake. The amounts of sulfoxaflor fed in the three different groups were onefold, threefold, and tenfold per kg of feed. Therefore, pigs were fed 9, 27, and 90 mg of sulfoxaflor at T1, T2, and T3, respectively, and the rats were fed 0.066, 0.198, and 0.660 mg of sulfoxaflor at T1, T2, and T3, respectively. For the analysis, sulfoxaflor was dissolved to 20 mg/L, and 1 mg/L of sulfoxaflor was used as a working solution. Sulfoxaflor was also diluted to 0.0025, 0.05, 0.01, 0.025, 0.05, 0.1, 0.25, and 0.5 mg/L.
From pigs, 2.5 g of intestine, kidney, fat, liver, muscle, and blood was collected four weeks after the start of the feeding test. Each tissue sample was incubated with 2 mL of distilled water, 2 g of NaCl, 100 µL of acetic acid, and 10 mL of acetonitrile to extract proteins. The mixture was shaken at 180 rpm for 30 min. From rats, 1 g of intestine, kidney, fat, liver, muscle, and blood was collected after feeding with sulfoxaflor for four weeks. Proteins were extracted from rat tissues using 1 mL distilled water, 1 g NaCl, 50 µL acetic acid, and 4 mL acetonitrile by shaking at 6×g for 30 min. Organic solvent phases were collected via centrifugation at 1,600×g for 5 min at −4°C. One milliliter of each supernatant was harvested and purified using 50 mg of prostate specific antigen (PSA). The supernatants were rigorously shaken for 1 min, centrifuged at 18,000×g, and filtered through a 0.22 µm for further analysis.
Non-treated tissue samples were mixed with diluted sulfoxaflor used as a matrix-matched standard to prevent matrix effects. Calibration curves were constructed using standard sulfoxaflor solutions. Analytes purified from tissue samples were loaded into the Thermo Scientific SurveyorTM Autosampler plus (Thermo Fisher Scientific, Waltham, MA, USA). Sulfoxaflor was detected using a Finnagan TSQ Quantum Discovery Max system (Thermo Fisher Scientific), and the collected data were analyzed using Finnigan Xcalibur, version 2.1.
All obtained data were statistically analyzed through ANOVA using SPSS ver. 17.0. A post hoc test was performed using the Tukey range test to confirm the differences between groups. The correlation in sulfoxaflor residues between pigs and rats was analyzed, and the regression equations were calculated. First, the regression equation for sulfoxaflor residues in each rat tissue depending on the sulfoxaflor concentration in the rat feed was determined as follows:
Then, the estimated regression equations of sulfoxaflor residues in rats to those in pigs were formulated as follows:
The y value (rat tissues) in Equation 1 was added to x (rat) in Equation 2 to calculate the estimated sulfoxaflor residues in pigs.
RESULTS
According to the initial weights, pigs were randomly divided into groups, with an average of 96.6 ± 2.3 kg (Table 2). After four weeks of feeding, the body weights of pigs in the control, T1, T2, and T3 groups were 117.0 kg, 121.0 kg, 120.9 kg, and 117.6 kg, respectively. The average daily food intake (ADFI) and average daily gain (ADG) are listed in Table 2; there were no significant differences. FCR was calculated by dividing food intake by ADG. There was also no significant difference in FCR among the groups. In addition, there was no difference in the weights of the tissues collected from each animal. At the end of the sulfoxaflor feeding test, the rat body weights were 341.8 g, 343.4 g, 339.2 g, and 330.7 g in the control, T1, T2, and T3 groups, respectively (Table 3). There were no significant differences in ADFI, ADG, and FCR. The rat tissue weights (g) were calculated based on body weight (kg), and the effect of sulfoxaflor on the tissues was investigated. The relative liver-weight-to-body-weight was highest in T3 (39.25 g/kg body weight), which was significantly different from that of the control, whereas T1 showed the lowest score (32.02 [p < 0.05]). However, there was no significant difference in the relative liver weight between the control, T1, and T2 groups. The spleen, kidney, heart, and lung weights were not different according to the sulfoxaflor oral assumption.
Sulfoxaflor residues were identified in six tissue samples from pigs and rats (Table 4). Sulfoxaflor was detected in a dose-dependent manner in both animal species. In pigs, among the six different tissues, the kidney (T1: 0.19 mg/kg, T2: 0.46 mg/kg, T3: 1.68 mg/kg) and liver (T1: 0.19 mg/kg, T2: 0.50 mg/kg, T3: 1.45 mg/kg) contained higher amounts of residual sulfoxaflor (p < 0.001). However, the small intestine (T1: 0.07 mg/kg, T2: 0.17 mg/kg, T3: 0.51 mg/kg) and fat (T1: 0.03 mg/kg, T2: 0.11 mg/kg, T3: 0.40 mg/kg) showed statistically lower sulfoxaflor residue levels than the other tissues. In rats, the liver (T1: 0.22 mg/kg, T2: 0.75 mg/kg, T3: 1.72 mg/kg) and kidney (T1: 0.09 mg/kg, T2: 0.38 mg/kg, T3: 0.95 mg/kg) tissues contained a significantly higher level of sulfoxaflor residues, similar to those in pigs (p < 0.001). In addition, significantly lower amounts of sulfoxaflor were found in the fat tissues (T1: 0.02 mg/kg, T2: 0.08 mg/kg, T3: 0.24 mg/kg).
The correlation between sulfoxaflor oral consumption and residues in tissues was analyzed. The sulfoxaflor input values in feed and the amount of sulfoxaflor in tissue were plotted, and the amount of sulfoxaflor residues linearly increased in a sulfoxaflor-dependent manner in both pigs and rats. The positive slope values of the linear functions were calculated, and linear function equations (y = ax + b) were obtained for each pig and rat tissue. In addition, the residual sulfoxaflor correlation coefficient was analyzed in pigs and rats. The coefficients for the small intestine, fat, kidney, liver, muscle, and serum samples were 0.941, 0.920, 0.960, 0.938, 0.967, and 0.931, respectively (Table 5).
| Tissues | Coefficient value | p-value |
|---|---|---|
| Small intestine | 0.941 | < 0.001 |
| Fat | 0.920 | < 0.001 |
| Kidney | 0.960 | < 0.001 |
| Liver | 0.938 | < 0.001 |
| Muscle | 0.967 | < 0.001 |
| Serum | 0.931 | < 0.001 |
| Total residue | 0.959 | < 0.001 |
To estimate the amounts of sulfoxaflor residues, equations 1 and 2 were formulated based on the sulfoxaflor oral consumption and residues in the tissues of both pigs and rats (Fig. 1). The equations were calculated for each tissue to reflect a tissue-specific residual pattern of sulfoxaflor as follows: y = 1.017 × (0.0159 × x + 0.0456) − 0.024 for the small intestine; y = 1.748 × (0.0078 × x + 0.0031) − 0.0171 for fat; y = 1.794 × (0.0306 × x + 0.0433) − 0.0685 for kidneys; y = 0.859 × (0.0529 × x + 0.1567) − 0.055 for liver; y = 2.134 × (0.0155 × x + 0.0242) − 0.0512 for muscle; y = 2.57 × (0.0138 × x + 0.0374) − 0.0995 for serum (Table 6).
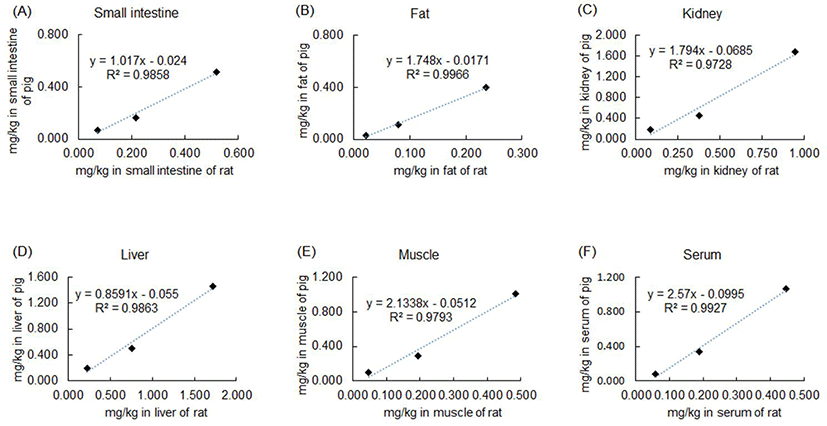
The model equations were verified by comparing the calculated sulfoxaflor residue values with the measured sulfoxaflor residue values in pig tissues (Table 7). The similarities between the calculated values and measured values in the six different tissues are listed in Table 7. The mean similarity values for all tissues were greater than 90%, and the small intestine, fat, and muscle tissues showed more than 98% similarity. Although similarity was lower in the liver (89.4%) and serum (80.6%) in the T1 group, sulfoxaflor residues in rats in the T2 (9 mg/kg) and T3 (30 mg/kg) groups were highly similar to the measured sulfoxaflor amounts in pigs. The average accuracy value of the estimated sulfoxaflor residues was 101.5 ± 1.68%.
DISCUSSION
Pesticide residues in livestock are highly associated with food safety and public health. Pesticide residues in animal products have been quantified to establish MRLs to ensure that pesticide residue levels in animal products do not affect human health. Livestock feeding tests are commonly used to quantify pesticide residues in animal products [16]. However, livestock feeding studies are relatively large, complex, and time-consuming, regardless of animal ethical issues. Thus, the need for alternative test methods has emerged [22,23]. Here, we tested small experimental animals in a preliminary experiment to minimize the number of livestock animal studies by reducing unnecessary animal experiments.
According to the OECD guidelines, feeding studies for residues in livestock are typically conducted in ruminants and poultry [16]. Data from ruminants, such as cattle, are extrapolated for pigs. However, it is possible that the metabolic pathways in ruminants are different from those in pigs. Therefore, a feeding study in monogastric animals, such as pigs, is necessary for independent experiments that can provide essential information regarding pesticide residues in vivo. Therefore, the current study was performed to develop an alternative quantitative test for pesticide residues in monogastric animals.
The OECD provides guidelines for chemical residue feeding tests in livestock, including chemical doses, experimental periods, and analysis items [16]. This study was conducted according to the OECD guidelines. To select a candidate pesticide, well-defined study information was considered based on verification of residual characteristics [20]. Sulfoxaflor transfer and retention from feed to animal products has been confirmed previously [20]. Residual sulfoxaflor has also been evaluated by the joint FAO/WHO meeting on pesticide residues of Codex, and the evaluated report includes quantitative data. In addition, sulfoxaflor does not produce a secondary metabolite and remains as its original compound in vivo. Thus, sulfoxaflor was selected as the test substance and was used in the feeding experiments in this study.
The possibility of using animal models to quantify pesticide residues in pigs was investigated using Sprague-Dawley rats. Although pigs and rats are both monogastric animals, there may be differences in metabolism due to differences in body weight and relative organ size. Therefore, this study aimed to evaluate the possibility of extrapolation as an alternative experiment, even though pigs and rats may have different metabolic pathways. Because pesticide residues in livestock products are evaluated for human consumption, we commenced the experiment by considering the body weight that could reach the slaughter stage at the end of the experiment. As pig growth in this study was still in the fattening stage, the rats were chosen considering age and growing stage. The OECD suggests three different dose levels: 1X, 3X, and 10X, and 1X is determined based on the MRL in feeds [16]. Oral consumption of sulfoxaflor had no effect on body weight, food intake, or FCR in pigs and rats, including tissue weight. This implies that sulfoxaflor could not induce difference in animal productivity due to oral intake. The amount of sulfoxaflor residues in tissues was different. Sulfoxaflor residues in the liver were higher than those in other tissues. The liver detoxifies toxic chemical insults that are efficiently eliminated from the body through the urine [24]. Because of the detoxifying function of the liver, sulfoxaflor can be detected in higher amounts in this organ. In contrast, sulfoxaflor was found in lower amounts in the fat tissues, which could be caused by its water solubility.
The significant relationship between sulfoxaflor residues in pigs and rats is crucial for establishing reliable modeling equations. The coefficient of determination was obtained by calculating sulfoxaflor residues in pigs and rats after oral consumption. The R2 values varied among tissues, and the coefficient values were higher than 0.92 in all tissues. These results are strong enough to support a significant relationship between pigs and rats based on sulfoxaflor residues found in six different tissues (p < 0.001). The expected equations were established through regression analysis, and modeling validity was evaluated by verifying the calculated vs. measured sulfoxaflor residue values in pig tissues. The measured and calculated values of the sulfoxaflor residues were highly similar. This similarity was consistent in each tissue and at different sulfoxaflor concentrations. The results supported the possibility that modeling could be an alternative tool to quantify pesticide residues originating from feed.
Studying pesticide residues in livestock products is required for safety, so that the possible pesticide residues in animal products can be monitored, investigated, and regulated. Owing to the increased concern regarding the necessity of animal use in experiments, alternative methods are required to replace animal experiments [22,23]. Overall, this study demonstrates the applicability of animal modeling for the quantitative evaluation of pesticide residues found in animal products. Since the implementation of the Animal Welfare Guideline 86/609/EC in 1986, European Union institutions have declared a policy to support the development and use of alternative methods, i.e. “any method that can be used to replace, reduce or refine the use of animal experiments in biomedical research, testing or education”. The “alternatives” concept is attributed to Russell and Burch, who defined three types of alternatives, the replacement, reduction, or refinement of animal tests, the so-called 3R principles [25]. The findings of this study suggest that small experimental animals could be used to test pesticide residues in animal products, especially in the meat of monogastric animals, as a preliminary experiment. Moreover, this study contributes to reducing the number of livestock animal studies, even though livestock cannot be fully replaced in quantifying pesticide residues.