
INTRODUCTION
With the rapid technological advancement and adoption of next-generation sequencing, genotype imputation and Bayesian statistical fine-mapping approaches, it has become feasible to conduct post genome-wide association fine-mapping analysis of quantitative trait loci (QTLs), to identify some of the genetic variants causatively associated with complex quantitative traits, such as blood cortisol levels. The genome-wide association studies (GWAS) and fine-mapping complement each other in genetic research. While GWAS is an excellent approach to identify broad genomic regions associated with complex economic traits using a sparse density of DNA markers and conventional p-values to declare statistically significant associations, fine-mapping narrows these regions to specific potential causal variants. Fine-mapping employs sophisticated statistical methods that account for linkage disequilibrium (LD) structure, utilizes denser genotyping of DNA markers, and can compute the posterior probability of causality for each variant in the genomic regions of interest. As an essential post-GWAS analysis, fine-mapping identifies putative causal variants, provides biological insights, facilitates functional studies, and improves effect estimation. By offering higher resolution and more precise identification of causal variants, fine-mapping translates GWAS discoveries into biological insights [1–3].
Although GWAS were originally developed for population studies, family-based association studies, including outbred crosses, such as F2 intercrosses, have also become popular due to the implementation of mixed linear models (MLM) in GWAS [4–6]. Genetic selection for robustness- and health-related traits is becoming an important component of swine breeding operations because the current pig production system must cope with environmental stress factors derived from the intensification of housing environments and temperature increase due to climate changes [7]. Alterations in robustness and health can cause neuro-physiological changes, including changes in blood cortisol levels. Cortisol secretion is mainly affected by the hypothalamic-pituitary-adrenal (HPA) axis, which are the key organs of biological stress response [8,9]. Hypothalamic corticotropin-releasing hormone stimulates the release of adrenocorticotropic hormone (ACTH) from the pituitary gland, which in turn triggers cortisol production in the adrenal cortex. The sensitivity of the adrenal glands to ACTH is crucial for the regulation of cortisol secretion. Cortisol bioavailability is critically modulated by corticosteroid-binding globulin (CBG). Through its high specific affinity for cortisol, CBG plays a vital role in regulating serum cortisol levels and their access to target cells. The majority of cortisol in the bloodstream is transported bound to CBG, while only a small fraction of the total serum cortisol remains unbound and biologically active [10,11].
Cortisol, a crucial hormone for facilitating adaptive stress responses, ensures the body’s energy supply in dynamic environmental conditions. This hormone influences multiple physiological processes, including appetite regulation, glucose metabolism, and fatty acid metabolism. Additionally, cortisol suppresses inflammation, modulates immune function, and mobilizes energy resources. It also affects energy storage. However, to be beneficial, cortisol levels must be maintained within an optimal concentration range [12]. In pigs, cortisol levels correlate with various economically important traits. Higher cortisol is associated with reduced growth and feed efficiency, and influences body weight, carcass characteristics, immune function, leanness, and meat quality [13,14]. The association between cortisol levels and various economically important traits has been well documented across species. For instance, studies in chickens and sheep have linked cortisol release to growth-related traits [15,16].
The secretion of cortisol regulated by the HPA axis is individually variable to stress responsiveness and is influenced by genetic determinants − heritability estimates of cortisol levels range between medium to high which makes it amenable to selection in breeding programs [17,18]. Hence, it is important to identify the genetic factors underlying blood cortisol levels and develop DNA markers to improve of the robustness and health of pigs, which are tightly linked to their welfare and productivity. Despite the importance of cortisol, only a limited number of GWAS and RNA seq analysis have been conducted to identify candidate genes that affect blood cortisol levels [19]. For example, previous GWA studies have identified SERPINA6 and SERPINA1 genes, which encode CBG, implicated in the regulation of blood cortisol levels in humans and pigs [20–22]; Crawford et al. reported strong evidence that genetic variants in the SERPINA6/SERPINA1 locus primarily affect SERPINA6 gene expression in the liver, which likely influences cortisol levels and its delivery to other tissues [21]. In goats, an RNA-seq experiment aimed at identifying genes and pathways associated with increased cortisol levels due to transportation stress revealed significant enrichment of genes involved in inflammation and apoptosis pathways [23].
Here, we present the results of GWAS and post-GWAS fine-mapping analyses in which we aimed to identify positional candidate genes and genetic variants affecting serum cortisol concentrations that are involved in the mechanisms of stress response in pigs. Our findings could provide insights into stress response mechanisms and targets for improving pig welfare and productivity through genomic information enabled accurate genetic evaluation.
MATERIALS AND METHODS
We generated an F2 resource population by crossing Duroc and Korean Native Pig (KNP) pigs from Jeju Island [13–24]. There are two types of indigenous pigs in Korea: those living on the main peninsula of Korea and those living on Jeju Island. The Jeju Island indigenous pigs are particularly interesting as they have unique genetic properties that are very distinct from those of pigs raised on the Korean Peninsula since they have been largely isolated on Jeju Island for more than 1,000 years [25,26]. Hereafter, the Jeju native pig will be referred to as KNP. The coat color of KNP is black, and similarly to most indigenous breeds, their growth performance is stunted in comparison to modern commercial pig breeds. They possess however excellent meat quality attributes, such as a solid fat structure, a darker red meat color, and high levels of marbling [27–29]. In this study, nine purebred Duroc pigs were mated with five purebred KNP pigs to produce 36 F1 animals. Subsequently, the F1 animals were intercrossed to produce 345 F2 animals. From the F2 progeny comprised 31 full-sib families, high-quality serum cortisol level data from 243 F2 animals (133 males and 110 females) were obtained as phenotypic data, and the corresponding genotypic data were included for this study. All animals were raised at the experimental farm of the National Institute of Animal Science, Rural Development Administration, Jeju, Republic of Korea. They were fed ad libitum, and the males were not castrated. All experimental procedures were performed in accordance with national and institutional guidelines and were approved by the Ethical Committee of the National Institute of Animal Science (No. 2020-446).
Blood samples (10 mL) were collected at 140 days of age from the jugular veins of the 243 F2 offspring. This specific age was chosen based on the ease of blood collection, taking into account the body size of pigs at this stage of development. The 140 days of age provided a balance between the pigs being sufficiently mature for straightforward blood sampling and not being too large to handle safely and efficiently. To minimize sampling variance, the blood sampling was conducted in the morning as soon as the research farm staffs were present at the farm. Serum cortisol levels were measured using a commercially available enzyme-linked immunosorbent assay kit (Endocrine Technologies, Newark, CA, USA). Descriptive statistics are presented in Table 1. The cortisol phenotype showed significant deviation from normality and was transformed using a natural logarithm to remove skewness.
| Phenotype | Total | N | *N1) | Mean | Sthev | Min | Max | h 2 |
|---|---|---|---|---|---|---|---|---|
| Cortisol (ng/mL) | 243 | 234 | 9 | 21.18 | 12.46 | 2.30 | 63.90 | 0.32 |
Genomic DNA was isolated from the blood samples using a standard sucrose-proteinase K method. Genotyping was conducted using the Porcine SNP 60K BeadChip technology (Illumina, San Diego, CA, USA), which contained 61,565 SNPs across the whole genome. The SNPs were filtered for a minor allele frequency < 1%, genotype call rate < 95%, and p-value of χ2-test for Hardy–Weinberg equilibrium ≤ 0.000001. Additionally, Mendelian inconsistencies in the F2 pedigree were assessed using the SNP marker information. The quality control procedures were performed using the PLINK v 1.90 [30]. In total, 39,463 SNP markers were retained and used for further analysis.
To scale up the information obtained from the Porcine SNP 60K BeadChip data of the study population to whole-genome sequence (WGS) level, genotype imputation was performed. As a reference panel for imputation, we collected WGS data from 56 pigs, including 7 Duroc, 19 KNP, and 30 Duroc × KNP F2 (DK F2) individuals. Among them, some of the Duroc (7) and KNP (5) pigs were the parental animals of the F2 resource population. The 30 DK F2 pigs were sampled from the F2 progeny of the resource population. Whole-genome sequencing was performed using the Illumina HiSeq platform (Illumina). DNA libraries were prepared according to the manufacturer’s instructions and sequenced using the paired-end 150 bp sequencing protocol. The sequencing coverage for these individuals was approximately 30×. In addition, whole-genome resequencing data from 14 KNPs were obtained from the NCBI Sequence Read Archive (SRA). These sequencing data were accessed under the BioProject accession number PRJNA254936. These data were also included in the subsequent procedures for preparing the reference sequence dataset for genotype imputation.
The raw sequencing data were processed and analyzed using a standard bioinformatics pipeline. Briefly, the quality of raw sequencing reads was assessed using FastQC (http://www.bioinformatics.babraham.ac.uk/projects/fastqc). The cleaned reads were then mapped to the Sus scrofa reference genome (Sscrofa11.1) using Burrows-Wheeler Aligner (BWA) with default parameters [31]. Duplicate reads were marked and removed using Picard MarkDuplicates (http://broadinstitute.github.io/picard). Variant calling was performed using Genome Analysis Toolkit (GATK), following the best practices for variant discovery [32]. The resulting variants were filtered based on quality scores, depth of coverage, and other standard parameters using GATK VariantFiltration to retain high-confidence genetic variants, ultimately leading to the acquisition of a total of 23,308,271 DNA markers.
Because of the substantial difference in genome coverage between the 60 K SNP data and WGS data, a two-step imputation strategy was employed to obtain WGS markers from the 60K SNP data. Initially, a subset of SNPs was extracted at regular intervals (window size of approximately 28 variants) from the WGS data obtained from the reference samples, resulting in 824,938 genetic variants. Subsequently, 1-step imputation was performed for the test sample, consisting of nine Duroc, five KNP, and 243 DK F2 pigs. This 1-step imputation yielded a total of 578,493 DNA markers. Using these marker data from the test sample, a 2-step imputation was conducted to obtain the WGS data, resulting in a total of 15,542,014 genetic variants. Haplotyping at the whole-genome level for both the reference and test samples was performed using Beagle version 2.4.1 [33]. Beagle was strictly used for haplotype construction. Genotype imputation was then performed using Minimac4 based on chromosome-wise constructed haplotype information (https://github.com/statgen/Minimac4). An imputation accuracy was evaluated using the correlation coefficient (r2), with a filtering criterion set at an r2 value of 0.6 or higher. The imputed genetic variants were further filtered for a minor allele frequency < 1% and P-value of χ2-test for Hardy-Weinberg equilibrium ≤ 0.000001. In total, 13,720,525 DNA markers were retained and used for further analyses.
Estimation of heritability and genome-wide association studies of serum cortisol levels
The efficient mixed-model association (EMMA) option of the rMVP package was used to estimate the heritability of the serum cortisol levels recorded in this study [34], and the following linear mixed model was used for the analysis:
where y is the vector of the log transformed serum cortisol levels; b is the vector of fixed effects, including the intercept, the effect of sex, the effect of slaughtering batch (with nine levels), and body weight at 140 days of age; u is the vector of random additive effects following a normal distribution u~N(0, Gσa2), in which G is the genomic relationship matrix constructed using 13,720,525 DNA markers and σa2 is the additive genetic variance; e is the vector of random residual effects following a normal distribution e~N(0, Iσe2), in which I is the identity matrix and σe2 is the residual variance; X and Z are the incidence matrices for b and u, respectively.
A GWAS adjusted for the familial relatedness within the F2 intercross was performed using the MLM option of the rMVP program [34]. The following linear MLM was used to assess the association between SNP markers and the serum cortisol levels:
where, y is the vector of the serum cortisol levels; b is the vector of fixed effects including sex, the effect of slaughtering batch (with nine levels), and body weight at 140 days of age; a is the SNP marker effects; u is the vector of random additive effects with a distribution u ~N(0, Gσa2), where G is the genomic relationship matrix that was constructed using the 39,463 SNP markers; σa2 is the additive genetic variance; e is a vector of random residuals following a distribution e ~N(0, Iσe2), in which I is the identity matrix and σe2 is the residual variance. Z1 is the incidence vector for a. X and Z2 are the incidence matrices for b and u. The percentage of phenotypic variance explained by a marker (%VarSNP) was computed as follows [35]:
where p is the minor-allele frequency of the SNP marker; α is the additive genetic effect of the DNA marker; σp2 is the phenotypic variance for each meat quality-related trait. The p, α and σp2 were estimated using the rMVP program. The q-value adjusted genome-wide suggestive (q-value < 0.10) and significant (q-value < 0.05) thresholds were used to address the multiple testing issues [36].
Initial fine-mapping of QTL identified by the GWAS was performed by exploiting linkage and linkage disequilibrium (LALD) using a haplotype-based approach: 1) We used CRI-MAP version 2.503, developed by Evans and Maddox (http://www.animalgenome.org/bioinfo/tools/share/crimap), to establish a genetic linkage map of SSC7 using 899 SNP markers. These makers were selected from the Porcine SNP 60K BeadChip genotype data. 2) The founder haplotypes were then reconstructed using the DualPHASE program [37] which combines LALD information through a Hidden Markov Model setting. 3) The haplotypes then were incorporated into the following linear mixed-effect model including fixed effects (sex, slaughtering batch, and body weight at 140 days of age), random effects (i.e., the effects of the founder haplotypes and the additive polygenic effect), and random residual terms to perform high-resolution QTL mapping using QxPAK version 5.05 [38]. A 1.0-LOD drop support interval was employed to estimate the confidence interval (CI) at the location of QTL location [39].
To refine the critical region identified by the LALD analyses, a further fine-mapping approach based on the FINEMAP program was conducted [40]. The FINEMAP program uses a shotgun stochastic search algorithm that incorporates summary statistics (i.e., Z-score) from GWAS and the LD correlation structure calculated from the SNP markers in the region of interest to calculate the posterior probability of each SNP marker being a candidate causal variant. A threshold of 5% for the posterior probability was applied to select markers associated with candidate causal variants from the FINEMAP analyses [41]. A regional association plot with LD information was drawn using IntAssoPlot (https://github.com/whweve/IntAssoPlot).
A list of genes annotated within the QTL region was extracted from the NCBI database release 85 based on Sus scrofa 11.1 assembly (NCBI accession ID: NC_010454.4). A list of genes in each QTL region was obtained from the NCBI database. A comparative analysis with previously reported QTL locations for the trait was conducted using the Animal QTLdb [19]. The candidate causal variants identified using the FINEMAP program were annotated using the ENSEMBL pig genome database (https://asia.ensembl.org/).
RESULTS AND DISCUSSION
Descriptive summary statistics and estimated heritability of the serum cortisol trait in the DK F2 pigs are presented in Table 1. The mean value and range of serum cortisol levels were 21.18 ng/mL and 61.6 ng/mL (2.30–63.90 ng/mL) in the F2 population. The estimate of heritability for the cortisol traits was 0.32, indicating that a considerable contribution of genetic effects to the phenotypic variation in the trait of interests is considerable. A total of 23,129,957 genetic variants were imputed using Beagle and Minimac4. The average imputation accuracy (r²) for the entire set of genetic variants was 0.67. A total of 7,587,919 variants had an imputation accuracy below the threshold of 0.6 (r²). After filtering out these low-accuracy variants, the final average imputation accuracy (r²) increased to 0.968 (Table 2). After an additional QC filtering step with PLINK for MAF and Hardy-Weinberg equilibrium deviations, a total of 13,720,525 DNA markers remained for subsequent analyses.
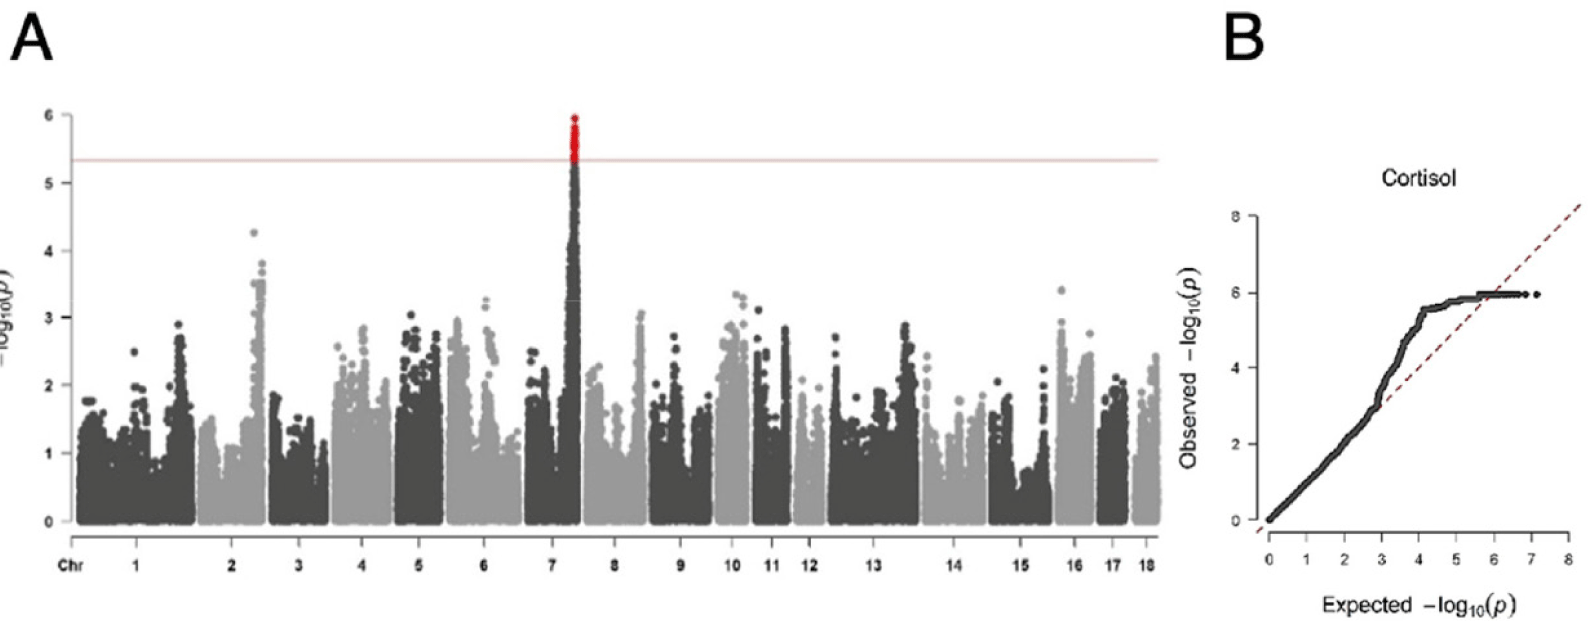
To investigate the genetic structure underlying the cortisol trait in pigs, we used an F2 intercross between the Duroc and KNP pigs. Using this F2 intercross population, we detected a single genome-wide significant QTL (q-value<0.05), comprising 34 DNA markers with extremely tight LD among these markers. The QTL spans a ~2.46 Mb region between 7:114031215 and rs326739326 (7:116497417), for serum cortisol levels on SSC7 (Fig. 1). However, a single most significant DNA marker associated with the phenotype of interest was not detected (Table 3). This significant QTL accounted for 12.65% of the phenotypic variance of the serum cortisol levels in the pig population (Table 3).
| SSC | Nsnp1) | Interval (Mb) | Centered SNP | Effect | SE | %var | p-value | q-value |
|---|---|---|---|---|---|---|---|---|
| 7 | 34 | 115575190-115584273 | 7:115580597 | 0.3216 | 0.0643 | 12.65 | 1.13E-06 | 0.0398 |
We performed integrated LALD mapping to reduce the CI of the QTL using the 899 markers (from the Porcine SNP 60K BeadChip genotype data) located across the SSC7. The 1-LOD drop method was used to estimate the CI of the QTL in SSC7 (Fig. 2A). The CI was reduced to 2.39 Mb (7:114,409,266–116,803,751). This region overlaps with a previously reported QTL region that influences pig blood cortisol levels [42–46]. The 2.39 Mb region in SSC7 encompassed 24 annotated genes with 14,337 DNA markers in the Sus scrofa 11.1 genome and imputed genotype dataset (Figs. 2B and 2C).
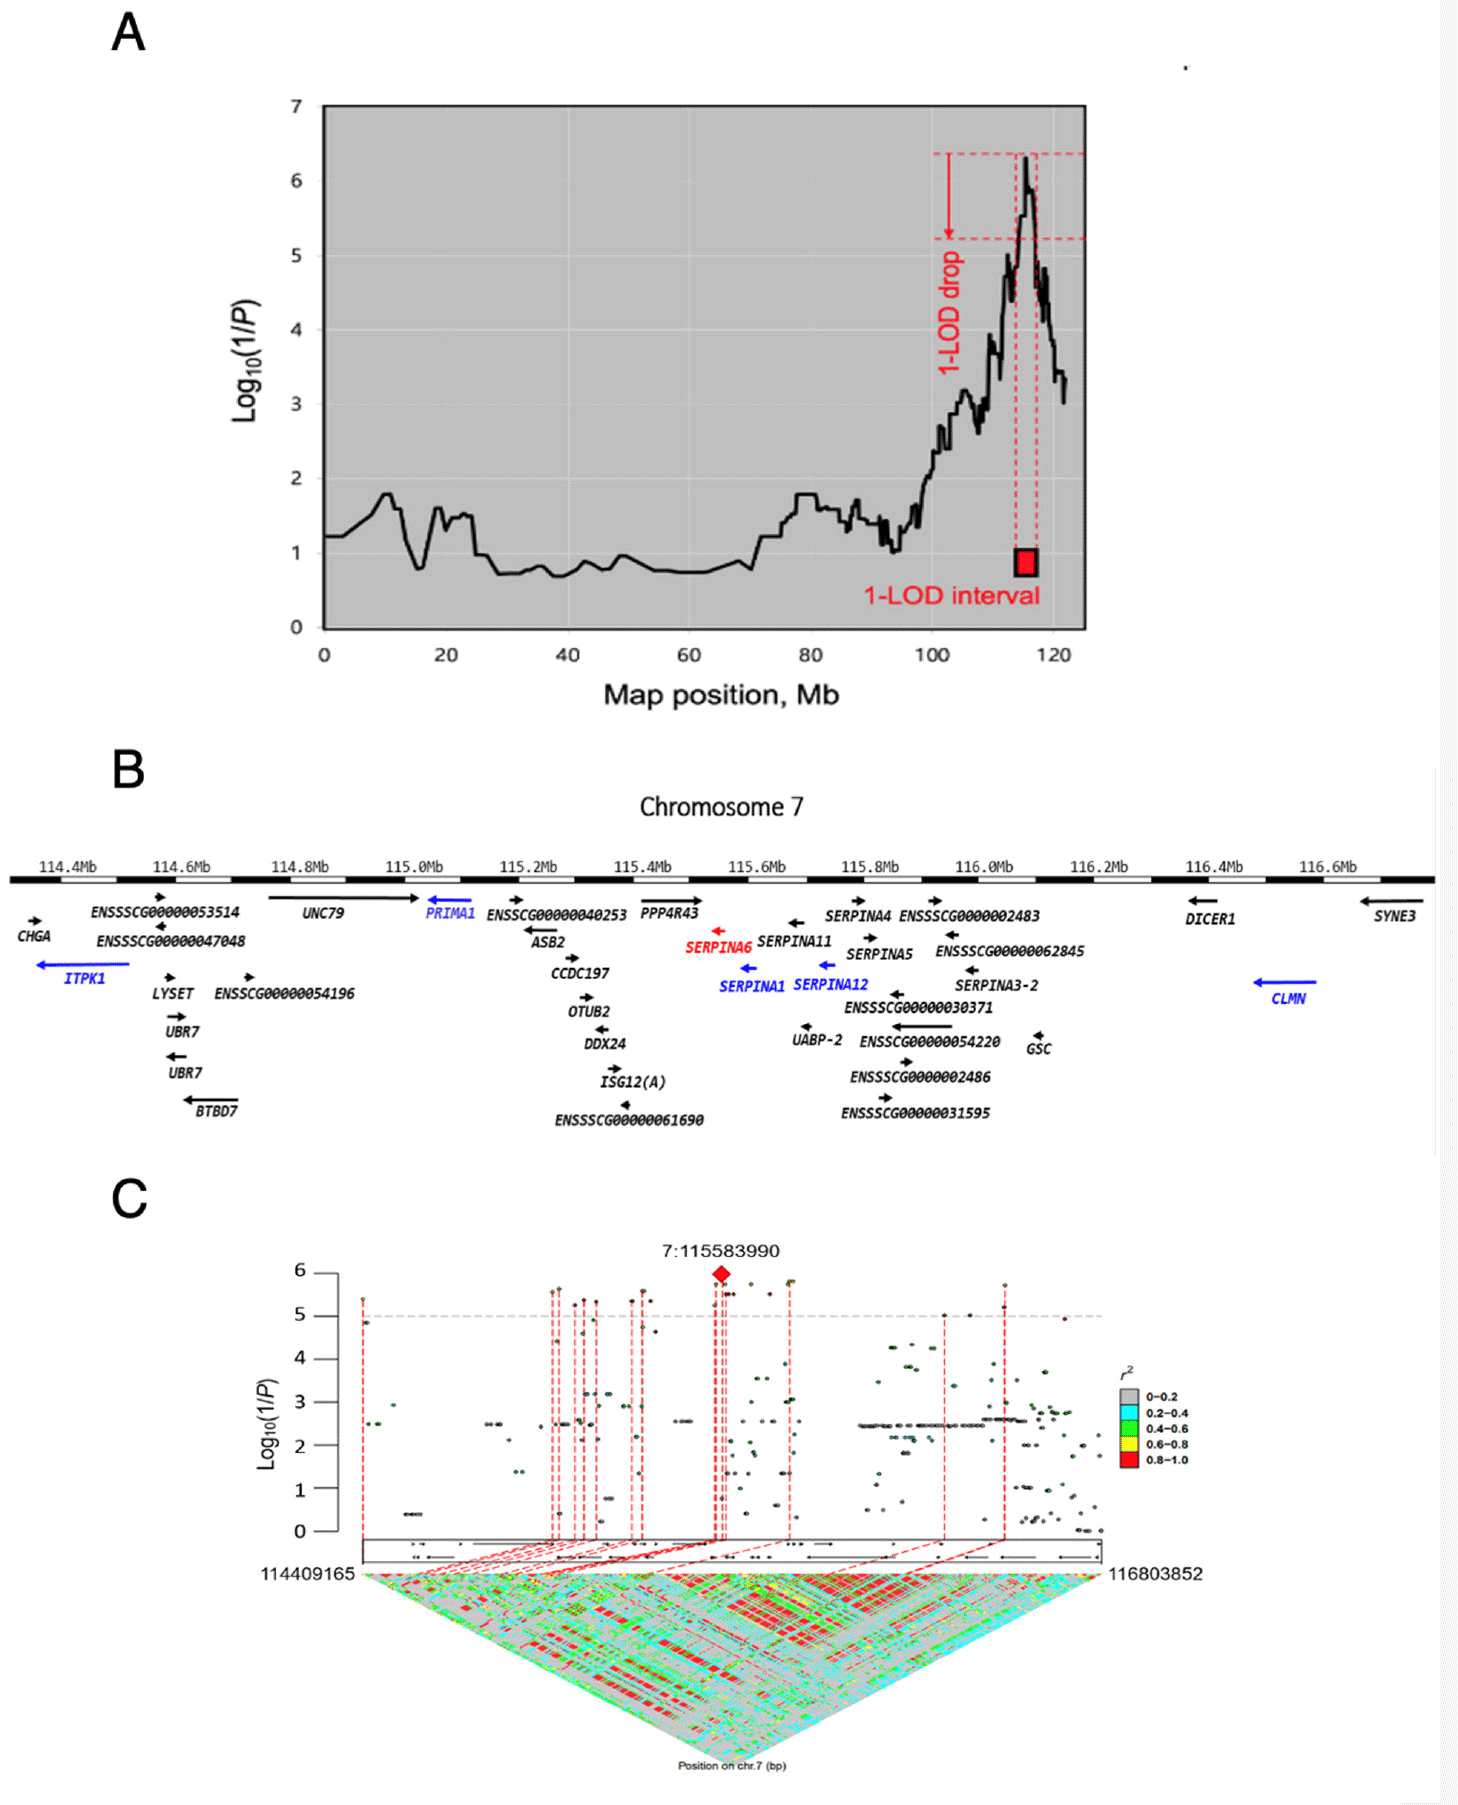
To further refine the critical region harbouring causative genes, we conducted fine-mapping of the 2.39 Mb region identified by the LALD analysis using the FINEMAP program. To enhance the fine-mapping accuracy for identifying putative causal genes, we first selected DNA markers located within the 24 positional candidate genes in the critical region based on the GWAS results. For each positional candidate gene, we retained only the DNA marker with the lowest p-value. Subsequently, we manually chose 297 DNA markers evenly distributed across the 2.39 Mb region. We then pruned these DNA markers using the LD pruning option in the PLINK program, resulting in 17 DNA markers evenly distributed throughout the 2.39 Mb critical region. Hence, a total of 41 DNA markers were included in the Bayesian fine-mapping analysis. No single DNA marker showed a substantial posterior probability (greater than 0.5) in the critical region (Table 4). DNA markers demonstrated low to medium levels of posterior probability, ranging from 0.066 to 0.116. This was most likely due to the modest sample size (N = 243) of the F2 cohort. Nevertheless, our Bayesian fine-mapping approach allowed us to prioritize potential causal genes. While we acknowledge the limitations of our study, including the moderate sample size and the inability to pinpoint specific causal variants, the fine-mapping approach has enabled us to create a prioritized list of potential causal candidate genes. This list provides valuable direction for subsequent studies, demonstrating the usefulness of fine-mapping even in situations where definitive causal variant identification is not achieved. For example, the most significant QTL region, explained by 34 variants in Table 3, spans only 9,083 bp. This narrow region contains just two genes: SERPINA6 and SERPINA1. Based solely on the p-values obtained from the conventional GWAS, it would be challenging to determine which of these genes should be prioritized for further investigation. However, as shown in Table 4, the posterior probabilities derived from our fine-mapping analysis allow us to distinguish between SERPINA6 and SERPINA1, providing a basis for prioritization. Recently, Uemoto et al. reported results of GWAS and LALD analysis on Landrace pigs [22]. While our study shares similarities with their study, employing both GWAS and LALD approaches, major differences underscore the novelty of our work. We used whole-genome imputed sequence variants instead of a conventional 60K SNP chip, providing comprehensive genomic coverage including rare and novel variants. In addition, we applied Bayesian fine-mapping to prioritize potential causal candidate genes, rather than presenting a conventional list of positional candidates. This approach allowed for more precise localization and prioritization of potential causal genes and variants.
In this critical region, SERPINA6, a gene encoding CBG, has been proposed as a putative causal gene accounting for this QTL effect [34]. A p.Arg307Gly (c.919T>C) substitution in SERPINA6 was previously shown to increase CBG capacity and decrease CBG affinity for cortisol in vitro [47,48]. These findings suggest that SERPINA6 is a positional and functional candidate gene for the QTL associated with blood cortisol levels in pigs. However, the fine-mapping results based on posterior probability ranked the top five genes as SERPINA1, ITPK1, CLMN, SERPINA12, and PRIMA1 genes, all with higher posterior probability than SERPINA6 (Table 4). In this study, we could not evaluate the p.Arg307Gly (c.919T>C) substitution in SERPINA6 because the corresponding variant at position 7:115541678 was not present among the 14,337 DNA markers initially considered for the fine-mapping.
SERPINA1, which encodes alpha-1 antitrypsin, inhibits neutrophil elastase and regulates cortisol secretion by influencing CBG cleavage and subsequent reconfiguration of the reactive center loop [49]. Heterozygosity of SERPINA1 mutations leads to alpha-1 antitrypsin deficiency and CBG cleavage, thereby increasing the free cortisol fraction [50]. Intracellular inositol triphosphate (IP3) is involved in various signal transduction pathways that affect cellular metabolisms [51]. Increased IP3 levels can trigger cortisol secretion by the adrenal zona fasciculate cells [52]. IP3 is produced by PIP2 hydrolysis, and ITPK1 synthesizes IP4, IP5, and IP6. Hence, ITPK1 polymorphisms could potentially affect inositol metabolism, which may be associated with cortisol secretion via the inositol pathways. CLMN, which encodes a calponin-like transmembrane domain protein, regulates cell cycle exit and neurite outgrowth in murine neuroblastoma cells. Genetic variants of CLMN may influence synaptic function and organization, resulting in the HPA axis [53,54]. SERPINA12, also known as VASPIN, is an adipokine belonging to the serpin protein family. Cortisol plays an important role in adipose tissue by influencing adipokine expression, insulin sensitivity, and fatty acid metabolism [55]. PRIMA1 encodes Proline-Rich Membrane Anchor 1 protein, which is required for anchoring of acetylcholinesterase to neuronal synapses. Acetylcholin, a product of acetylcholinesterase, is released in response to stress, and activates the HPA axis, which is linked to cortisol production [56]. However, there is still a paucity of direct genetic evidence on the effects of CLMN and PRIMA1 on blood cortisol levels.
CONCLUSION
The intensification of housing environments and the impact of climate change on current production systems have negatively impacted the breeding and growth of pigs. The cortisol level is an important indicator of stress resistance and robustness in pigs. This hormone levels in pigs could indicate environmental stress, potentially intensified by climate change. Rising temperatures and erratic weather patterns increase heat stress, alter food and water availability, and expose livestock to new pathogens, elevating cortisol and affecting animal health and productivity. Studying cortisol levels in pig populations like the KNP and its crossbreeds can provide insights into their adaptation to changing environments [57]. To elucidate the molecular genetic basis of breeding robustness, we identified QTLs affecting basal serum cortisol levels using imputed whole-genome sequencing data-based GWAS, LALD analysis, and Bayesian fine-mapping approaches. This study identified novel positional candidate genes (SERPINA1, ITPK1, CLMN, SERPINA12, and PRIMA1) in addition to the previously known SERPINA6. Our results provide a basic understanding for the development of genetic markers to improve the robustness of pigs.