Journal of Animal Science and Technology
Korean Society of Animal Sciences and Technology
RESEARCH ARTICLE

Treatment of dual-flow continuous culture fermenters with an organic essential oil product minimally influenced prokaryotic microbiome

Tansol Park1https://orcid.org/0000-0002-4480-4524, Grace Praisler2https://orcid.org/0009-0009-4256-5783, Benjamin A. Wenner2,*https://orcid.org/0000-0002-2333-1297
1Department of Animal Science and Technology, Chung-Ang University, Anseong 17546, Korea
2Department of Animal Sciences, The Ohio State University, Columbus, OH 43210, USA
*Corresponding author: Benjamin A. Wenner, Department of Animal Sciences, The Ohio State University, Columbus, OH 43210, USA, E-mail: wenner.20@osu.edu

© Copyright 2025 Korean Society of Animal Science and Technology. This is an Open-Access article distributed under the terms of the Creative Commons Attribution Non-Commercial License (http://creativecommons.org/licenses/by-nc/4.0/) which permits unrestricted non-commercial use, distribution, and reproduction in any medium, provided the original work is properly cited.

Received: Mar 27, 2024; Revised: Jun 01, 2024; Accepted: Jun 28, 2024

Published Online: Sep 30, 2025

Abstract

Previous research reported an essential oil (EO) product decreasing methane (CH4) production by dual-flow continuous culture (DFCC); this product could assist organic dairy producers in decreasing emissions. Our objective was to assess the effect of this EO product on the microbial populations within DFCC. Here, we hypothesized that the EO either decreased protozoal population or induced shifts in the bacterial relative abundance to decrease CH4 production. Metagenomic DNA was extracted from previous effluent samples taken from a DFCC system (n = 2) across four experimental periods, after which samples were sequenced the 16S rRNA gene and microbial taxonomy was assigned using the SILVA v138 database. The treatments included a control (CON) diet (60:40 concentrate:orchardgrass pellet mix, 17.1% crude protein, 33.0% neutral detergent fiber, 20.1% acid detergent fiber, and 27.1% starch) fed twice daily for a total of 80 g/d dry matter, or the same CON diet with the addition of EO at 3 mg/d. Protozoa were also quantified in both fermenter contents and unpooled daily effluent samples. The statistical model included fixed effects of treatment and fermenter, and random effect of period, using either MaAsLin2 or the adonis2 function in the vegan package of R for microbial features, or SAS mixed model for protozoal counts. The results were deemed significant at Q < 0.05 and p < 0.05 for the MaAsLin2 and adonis2/SAS analyses, respectively. For the protozoal populations, the treatments had no significant effect (p > 0.10) on the total counts, differentiated groups, or cell outflow. The addition of EO increased the relative abundance of Methanobrevibacter and decreased that of uncultured Methanomethylophilaceae (Q < 0.05). In contrast, EO addition had no significant effect on archaeal α- or β-diversity (p > 0.05). Despite not having a significant effect on the β-diversity of archaeal and bacterial communities, EO decreased (p < 0.05) α-diversity indices in prokaryotic communities. Moreover, EO decreased (Q < 0.01) the relative abundance of Clostridia UCG-014, Rikenellaceae RC9 gut group, and Christenellaceae R7 group, and increased (Q < 0.01) others including Treponema, Succinivibrionaceae UCG-002, and Ruminococcus. Offsetting shifts in the relative abundance of fiber-degrading bacteria and detailed methanogen communities deserves further investigation including predicted metabolic pathways impacted by population shifts induced by this EO combination.

Keywords: Dual-flow continuous culture; Essential oils; Methane; Rumen microbiome

INTRODUCTION

Methane (CH4) emissions from dairy cattle pose a significant environmental challenge, notably contributing to the global greenhouse gas footprint of agricultural activities. Therefore, effectively mitigating CH4 in dairy production is crucial to meet global environmental targets, such as those outlined in the Global Methane Pledge [1]. In this context, dietary interventions have recently garnered increasing attention as a promising approach to reduce enteric CH4 emissions from ruminants.

Among these interventions, the use of essential oil-based additives, such as Agolin® Ruminant (AR, Agolin SA), has gained attention for its potential to modify rumen fermentation and decrease CH4 output. Agolin® Ruminant is an essential oil (EO) product containing a blend of coriander seed oil, eugenol, geranyl acetate, and geraniol [2] geared towards reducing CH4 emissions in cattle and some agencies have issued carbon credits to producers utilizing the product. This product is also available in an organic certified carrier for use in organic farms. The EOs in this product presumably disrupt the phospholipid membrane of archaea, leading to a decrease in CH4 production and an increase in the cow’s nutrient utilization efficiency [3]. Previous studies have employed both in vitro and in vivo experiments, revealing the additive’s capacity to alter rumen fermentation patterns and reduce CH4 production [2,4]. For example, studies have highlighted the efficacy of EO in lowering CH4 emissions in dairy cattle [5], coinciding with improvements in milk production and components in response to EO supplementation [6]. However, the effects of EO on the rumen microbiome and their association with CH4 mitigation remain largely unexplored.

One of the main concerns regarding the administration of AR (as well as other EO-based products) is whether it also disrupts the rumen fibrolytics when fed to cattle, as very few studies have characterized the changes in the microbiome in response to Agolin® Ruminant [7]. In a recent study, AR fed in dual-flow continuous culture (DFCC) decreased CH4 production by 10% in less than two weeks of adaptation [8] but did not decrease fiber digestibility nor did it significantly alter volatile fatty acid production, prompting researchers to investigate which rumen microbes might be impacted by AR to both explain the mechanisms underlying decreased CH4 emission and gauge potential drawbacks.

To address this gap, our study employed samples from the previous DFCC study coupled with advanced microbiome analysis to investigate the effects of EO on rumen microbial populations and CH4 emissions in dairy cattle. This approach allows for a controlled simulation of the rumen environment, providing detailed insights into the microbial dynamics within the rumen and their relation to CH4 production [9].

This study aimed to determine the microbial factors associated with CH4 inhibition by EO using a DFCC system. We hypothesized that EO either decreased the protozoal population or induced shifts in the archaeal or bacterial abundance to decrease CH4 production. This study contributes to the evolving field of enteric CH4 mitigation in dairy cattle, offering valuable insights for the development of sustainable and effective dietary strategies in the dairy industry.

MATERIALS AND METHODS

DFCC treatments

The DFCC system utilized for this study implements updated approaches previously characterized [9]. Effluent samples used for DNA extraction and protozoal enumeration came from a previous study [6] evaluating the efficacy of several organic-certified CH4 inhibitors. Briefly, DFCC (n = 4) were inoculated from two Jersey cows housed at the Waterman Dairy Farm (The Ohio State University, Columbus, OH) under care according to the Institutional Animal Care and Use Committee protocol #2013A00000073. These cows were fed a lactating diet common to the herd at the time [10] including 39% corn silage, 9.9% wet brewer’s grains, 7.7% soybean meal, 4.6% bypass soy, 0.9% bypass fat, 0.9% molasses, and 3.4% vitamin mineral premix (without monensin or other feed additives). A Latin square treatment arrangement was applied to evaluate four treatments which are detailed previously. Of these, only two were considered for the current study due to a lack of efficacy previously reported for the other two treatments. The control (CON) diet was fed twice daily a total of 80 g/d dry matter (DM) diet (60:40 concentrate:orchardgrass pellet mix, 17.1% crude protein [CP], 33.0% neutral detergent fiber [NDF], 0.1% acid detergent fiber [ADF], and 27.1% starch; Table 1) and one fed CON diet with 3 mg/d dose of supplemental organically-certified EO (Agolin® Naturu, Agolin SA). Fermenter effluent samples (d8-11) were subsampled and stored at −80°C for metagenomic DNA extraction. Additionally, fermenter samples (d5) and effluent samples (d8-11) were fixed in formalin and stored for enumeration based on the procedure outlined in Dehority, 1984 [11]. The outflow of cells in effluent was contrasted to the fermenter contents populations to estimate generation time for protozoa, and protozoa were divided into the following types: Charonina (based on previous reports of high enrichment in DFCC [12]), Isotrichidae, Diplodinium, and other entodinia – either small (< 100 µm in length) or large (> 100 µm in length).

Table 1. Control diet (CON) fed to dual-flow continuous cultures at 80 g/day, twice daily, (60:40 concentrate:orchardgrass pellet mix), with or without 3 mg/d EO1)
Nutrient Diet composition
Dry matter (g/d) 80.0
Crude protein 17.1%
Starch 27.1%
Water soluble carbohydrates 8.4%
Neutral detergent fiber 33.0%
Acid detergent fiber 20.1%
Fat 2.2%
Ash 9.2%

CON, 80 g/d of control diet; EO, CON diet + 3 mg/d blended essential oil product.

Download Excel Table
Metagenomic DNA extraction and metataxonomic analysis of the rumen bacteriome and archaeome

Metagenomic DNA from the effluent samples was extracted using the repeated bead beating plus column method [13] and purified with Qiagen mini-stool kits from Thermo Fisher Scientific. The researchers conducting the extractions were blinded to treatment during the DNA extraction and subsequent taxonomy classification. The quality and quantity of DNA were assessed using a NanoDrop ND-2000 spectrophotometer (Thermo Scientific, NanoDrop Technologies) and further evaluated through 1% agarose gel electrophoresis. Amplicon libraries, targeting the V4 hypervariable region of the 16S rRNA gene were generated using the 515F and 806R universal primer pair [14] and each library was uniquely barcoded for multiplexing at The Ohio State University’s Molecular and Cellular Imaging Center (Wooster, OH). The libraries were then pooled and sequenced using an Illumina MiSeq sequencer (2 × 300 bp paired-end sequencing). Quality control measures, including denoising, merging, and chimera removal, were performed using QIIME2 version 2022.2 [15], following an approach similar to that described previously [16].

In this analysis, the final number of quality amplicon sequencing variants (ASVs) was 3,662,173 (3,653,369 bacterial ASVs and 8,804 archaeal ASVs) and they were classified taxonomically based on a 99% similarity . This classification was conducted using the weighted Silva 16S pre-trained classifier (NR 138 version; [1719]) to enhance classification accuracy. Only phyla, families, and genera with a relative ASV abundance ≥ –0.5% in at least one treatment were included in the analysis. ASV BIOM tables for archaea and bacteria were separated prior to downstream analysis. Alpha diversity indices such as richness, Chao1, Shannon’s index, Pielou’s evenness, Good’s coverage, and Faith’s phylogenetic diversity were derived from the average rarefied ASV table (repeated 100 times, referenced in [20]). The microbial metabolic functions were predicted using PICRUSt2 [21] utilizing 16S ASVs. Kyoto Encyclopedia of Genes and Genomes (KEGG) pathways were reconstructed from these predictions, representing microbial metabolic functions based on KEGG ortholog profiles derived from PICRUSt2.

Statistical analysis

Statistical assessment of the microbial relative abundance data was carried out using MaAsLin2 [22] to examine the impact of EO. This analysis involved centered log-ratio normalization and a linear model without data transformation. The statistical model encompassed the fixed effects of both the treatment and fermenter, along with the random effect of the period. The mixed model was implemented using either MaAsLin2 or SAS 9.4 (SAS Institute), particularly for analyzing effluent protozoal counts. Alpha diversity metrics and effluent protozoal counts were examined using the SAS mixed model. A significance threshold of Q < 0.05 (Benjamini-Hochberg FDR-corrected P-values) was set for MaAsLin2 analyses, and a p < 0.05 was used for SAS analyses. Bray-Curtis and Jaccard distance matrices were compared to evaluate the overall microbial community differences resulting from EO. This was done using the adonis2 function within the ‘vegan’ package (version 2.5–7) of R [23]. The same statistical models were applied to conduct these comparisons. Additionally, PCA results were graphically represented through plots created using the ‘ggfortify’ package in R (version 3.5.3) [24].

RESULTS

Protozoal populations were primarily entodiniomorphids (74%, Table 2) – mostly shorter in length than 100 µm – while another 16% of the protozoal population was Charonina spp. Both protozoal populations within fermenters and daily flow of protozoa in effluent were unchanged by treatment, as was generation time (p > 0.10). In the control treatment, no members of Isotrichidae were detected in effluent samples despite being identified in fermenter populations.

Table 2. Counts of protozoal populations, calculated daily effluent flow, and generation time for dual-flow continuous culture fermenters fed either a control diet or a control diet with 3 mg/d supplemental EO
CON1) EO SEM p-value2)
Fermenter populations [cells (× 103)/mL] 24.5 21.1 5.12 0.17
 Small entodinia 18.2 16.0 3.84 0.18
 Large entodinia 0.200 0.200 0.108 0.80
Diplodinium 1.40 1.60 0.568 0.76
 Isotrichid 0.800 0.700 0.367 0.58
Charonina 3.90 2.60 1.40 0.13
Daily flow [cells (× 107)/d] 36 33.9 0.360 0.55
 Small entodinia 30.4 31.0 2.78 0.83
 Large entodinia 0.00736 0.00723 0.00806 0.99
Diplodinium 0.244 0.331 0.0994 0.33
 Isotrichid - 0.00737 0.00534 0.27
Charonina 0.098 0.148 0.0419 0.41
 Generation time3) (h) 42.9 30.8 14.6 0.51

CON, 80 g/d of control diet; EO, CON diet + 3 mg/d blended essential oil product.

p-values reported for the main effect of EO versus CON.

Generation time = total pool size of cells (i.e., fermenter counts × fermenter volume / effluent flow of cells/d × 24 h.

Download Excel Table

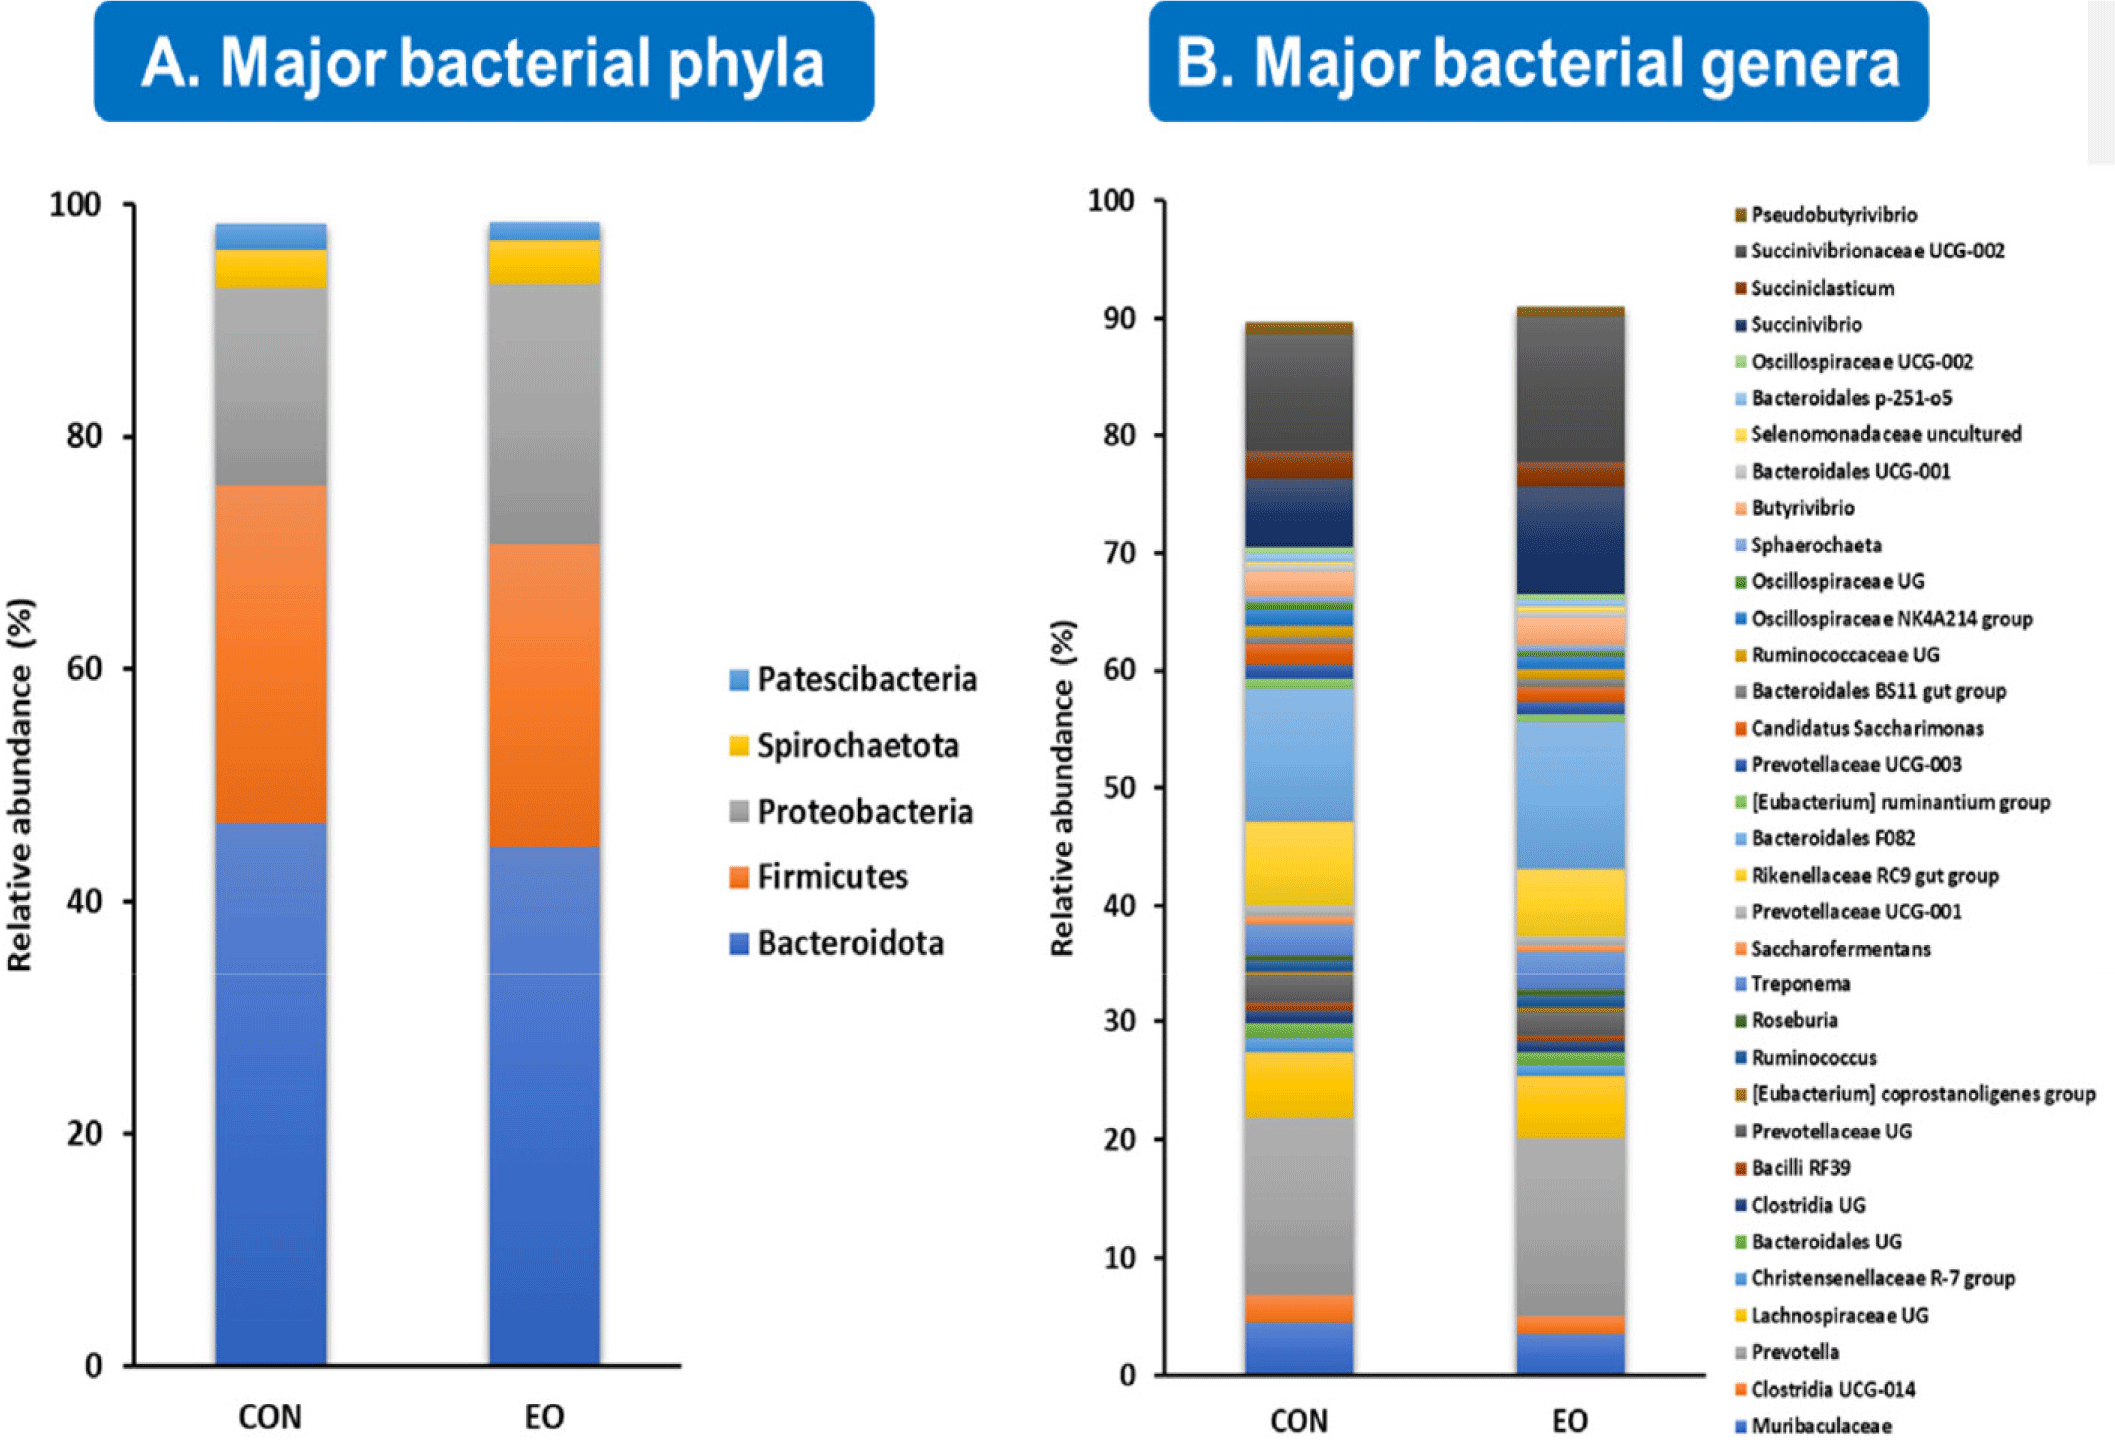
Fig. 1 provides a comprehensive overview of the primary bacterial communities identified in the effluent samples at the phylum level. Our analyses revealed five major phyla – each representing more than 0.5% of the average relative abundance in either the control or treatment groups – accounting for 98.4% of the relative abundance of the detected ASVs. These phyla include Bacteroidota (45.6%), Firmicutes (27.6%), Proteobacteria (19.7%), Spirochaetota (3.5%), and Patescibacteria (1.9%) (Fig. 1A). At the genus level, 34 major bacterial genera accounted for 90.3% of the total bacterial population, as shown in Fig. 1B.
jast-67-5-1018-g1
Fig. 1. Relative abundance of the major bacterial phyla (A) and genera (B) (only phyla and genera with a relative abundance of ≥ 0.5% in at least one treatment are shown).
Download Original Figure

In terms of archaeal communities, all ASVs were classified into two families: Methanobacteriaceae (97.2%) and Methanomethylophilaceae (2.8%), with only three genera detected (Methanobrevibacter, Methanosphaera, and uncultured genus within the Methanomethylophilaceae family). Notably, all major bacterial and archaeal taxa were identified in both the control and EO treated groups.

This study also investigated the impact of EO on the diversity of the prokaryotic microbiome, revealing a significant reduction in all alpha-diversity indices – including species richness, evenness, phylogenetic diversity, and comprehensive indices (Shannon’s index and Simpson’s index) – across both the bacteriota and archaeota (Table 3). Despite these changes, the overall composition of the prokaryotic microbiome, as assessed by Bray-Curtis and Jaccard distance matrices, remained unaffected by EO treatment (p > 0.1; Fig. 2).
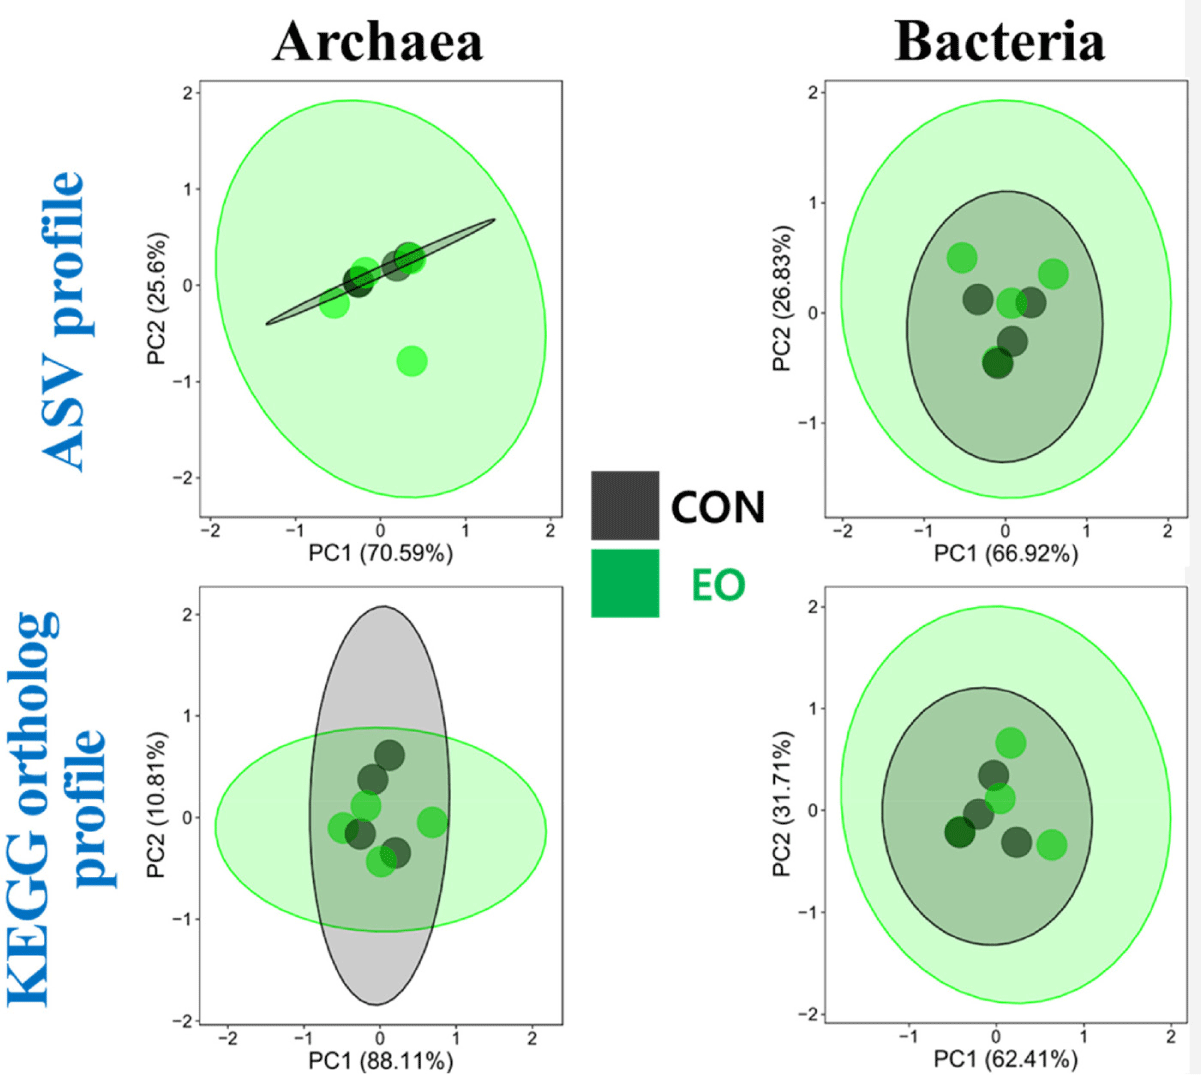
Table 3. Changes in the alpha-diversity indices of bacteriota and archaeota in response to EO treatment1)
Group Observed ASVs Chao1 estimates Pielou’s evenness Faith’s phylogenetic diversity Shannon’s index Simpson’s index
Archaea
 CON2) 3.75 3.75 0.788 0.437 1.505 0.572
 EO 3.25 3.25 0.619 0.374 1.226 0.471
 SEM 0.979 0.979 0.217 0.083 0.504 0.184
p-value 0.0008 0.0008 < 0.0001 0.0005 0.0006 < 0.0001
Bacteria
 CON 1,109 1,157 0.773 52.005 7.815 0.972
 EO 1,066 1,125 0.728 51.179 7.317 0.953
 SEM 104.479 120.563 0.033 2.801 0.408 0.016
p-value 0.0013 0.0023 < 0.0001 < 0.0001 0.0003 < 0.0001

Good’s coverage was at least over 99.4% for all samples.

CON, control diet; EO, essential oil fed at 3 mg/d.

ASV, amplicon sequencing variant.

Download Excel Table
jast-67-5-1018-g2
Fig. 2. Principle component analysis plots of the archaeal and bacterial microbiome. The grey dots and ellipse represent the CON group fed 80 g/d dry matter of a control diet and the green dots and ellipse represent the EO group fed the CON diet supplemented with 3 mg/d essential oil. The overall archaeal and bacterial microbiome was not affected by EO (p > 0.10). ASV, amplicon sequencing variant; EO, essential oil; KEGG, Kyoto Encyclopedia of Genes and Genomes.
Download Original Figure

Comparative analysis between the control and EO-treated groups at the phylum level revealed differential abundances in Proteobacteria, Spirochaetota, and Patescibacteria (Table 4). At the genus level, eight bacterial genera (Clostridia UCG-014, Christensenellaceae R-7 group, unclassified genus within Bacteroidales, Bacilli RF39, Prevotellaceae UCG-001, Rikenellaceae RC9 gut group, and Candidatus Saccharimonas) exhibited a positive association with the control group, whereas four genera (Ruminococcus, Treponema, Butyrivibrio, and Succinivibrionaceae UCG-002) were more closely associated with the EO treatment (Table 4). Moreover, among the archaeal genera, Methanobrevibacter and an uncultured Methanomethylophilaceae genus exhibited positive and negative associations with EO treatment, respectively (Fig. 3).
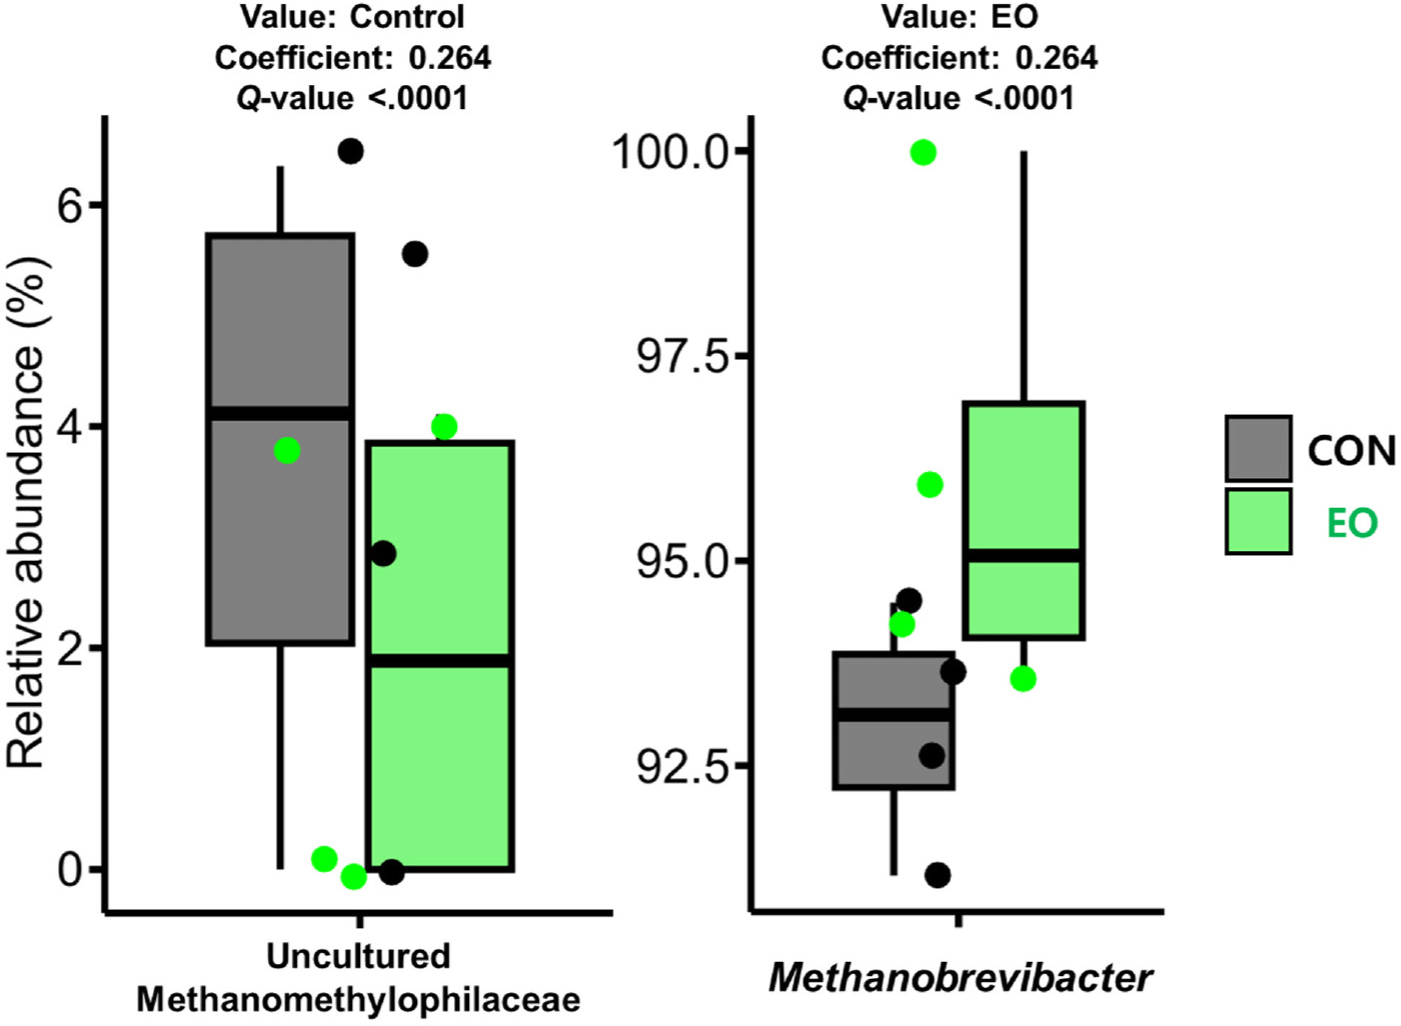
Table 4. Maaslin21) analysis of the bacterial phyla, families, and genera associated with EO treatment
Associated categorical feature Coefficient Relative abundance (%) SEM p-value Q-value
CON2) EO
Bacterial phylum
 Patescibacteria CON 0.200 2.197 1.554 0.388 < 0.0001 < 0.0001
 Proteobacteria EO 0.241 17.027 22.415 2.891 < 0.0001 < 0.0001
 Spirochaetota EO 0.085 3.324 3.770 0.435 < 0.0001 < 0.0001
Bacterial genus
 Clostridia UCG-014 CON 0.225 2.347 1.525 0.249 < 0.0001 < 0.0001
 Christensenellaceae R-7 group CON 0.106 1.240 0.921 0.125 < 0.0001 < 0.0001
 Bacteroidales UG CON 0.033 1.266 1.115 0.094 < 0.0001 < 0.0001
 RF39 CON 0.089 0.668 0.470 0.059 < 0.0001 < 0.0001
 Prevotellaceae UCG-001 CON 0.022 0.970 0.847 0.080 < 0.0001 0.001
 Rikenellaceae RC9 gut group CON 0.155 7.098 5.683 0.689 < 0.0001 < 0.0001
 Candidatus Saccharimonas CON 0.144 1.823 1.316 0.310 < 0.0001 < 0.0001
Pseudobutyrivibrio CON 0.071 1.023 0.812 0.119 < 0.0001 < 0.0001
Treponema EO 0.191 2.602 3.263 0.416 < 0.0001 < 0.0001
 Ruminococcaceae UG EO 0.032 0.902 0.884 0.082 < 0.0001 < 0.0001
Butyrivibrio EO 0.097 2.140 2.326 0.128 < 0.0001 < 0.0001
 Succinivibrionaceae UCG-002 EO 0.155 10.019 12.383 2.405 < 0.0001 < 0.0001

Only the major bacterial phyla and genera, representing at least ≥ 0.5% of the average relative abundance of at least one of the treatment groups that were significantly different (Q ≤ 0.05) are shown.

CON, control diet; EO, essential oil fed at 3 mg/d.

UCG, uncultured genus-level group; UG, unclassified genus (highest classified taxon level was presented).

Download Excel Table
jast-67-5-1018-g3
Fig. 3. Differentially abundance of archaeal genera in response to EO treatment. EO, essential oil.
Download Original Figure

An examination of the major KEGG pathways predicted from the bacterial communities revealed differential abundances in 26 pathways between the control and treatment groups as shown in Table 5. Similarly, for the archaeal microbiome, differential abundances were observed in seven and eight major KEGG pathways between the control and EO treatment groups (Table 6).

Table 5. Maaslin21) analysis of the bacterial KEGG pathways associated with EO treatment
KEGG pathways Associated categorical feature Coefficient Relative abundance (%) SEM p-value Q-value KEGG pathway description KEGG objects
CON2) EO
ko00030 CON 0.005 1.147 1.138 0.008 < 0.0001 < 0.0001 Pentose phosphate pathway Carbohydrate metabolism
ko00190 CON 0.009 0.614 0.601 0.006 < 0.0001 < 0.0001 Oxidative phosphorylation Energy metabolism
ko00260 CON 0.007 1.265 1.252 0.008 < 0.0001 < 0.0001 Glycine, serine and threonine metabolism Amino acid metabolism
ko00550 CON 0.001 2.206 2.205 0.010 < 0.0001 0.003 Peptidoglycan biosynthesis Glycan biosynthesis and metabolism
ko00630 CON 0.011 0.965 0.945 0.008 < 0.0001 < 0.0001 Glyoxylate and dicarboxylate metabolism Carbohydrate metabolism
ko00650 CON 0.010 0.767 0.750 0.005 < 0.0001 < 0.0001 Butanoate metabolism Carbohydrate metabolism
ko00720 CON 0.009 1.176 1.159 0.008 < 0.0001 < 0.0001 Carbon fixation pathways in prokaryotes Energy metabolism
ko00730 CON 0.013 1.804 1.771 0.017 < 0.0001 < 0.0001 Thiamine metabolism Metabolism of cofactors and vitamins
ko00770 CON 0.005 1.936 1.924 0.008 < 0.0001 < 0.0001 Pantothenate and CoA biosynthesis Metabolism of cofactors and vitamins
ko00970 CON 0.001 2.332 2.329 0.012 < 0.0001 0.002 Aminoacyl-tRNA biosynthesis Translation
ko01110 CON 0.001 0.618 0.617 0.002 < 0.0001 < 0.0001 Biosynthesis of secondary metabolites
ko01200 CON 0.006 1.035 1.023 0.005 < 0.0001 < 0.0001 Carbon metabolism
ko03420 CON 0.005 1.106 1.096 0.011 < 0.0001 < 0.0001 Nucleotide excision repair Replication and repair
ko00061 EO 0.011 2.069 2.107 0.017 < 0.0001 < 0.0001 Fatty acid biosynthesis Lipid metabolism
ko00130 EO 0.023 0.611 0.652 0.030 < 0.0001 < 0.0001 Ubiquinone and other terpenoid-quinone biosynthesis Metabolism of cofactors and vitamins
ko00540 EO 0.041 1.207 1.303 0.045 < 0.0001 < 0.0001 Lipopolysaccharide biosynthesis Glycan biosynthesis and metabolism
ko00740 EO 0.006 0.746 0.759 0.011 < 0.0001 < 0.0001 Riboflavin metabolism Metabolism of cofactors and vitamins
ko00780 EO 0.023 2.325 2.406 0.040 < 0.0001 0.016 Biotin metabolism Metabolism of cofactors and vitamins
ko00790 EO 0.012 0.869 0.894 0.016 < 0.0001 < 0.0001 Folate biosynthesis Metabolism of cofactors and vitamins
ko02026 EO 0.028 0.721 0.771 0.024 < 0.0001 < 0.0001 Biofilm formation - Escherichia coli Cellular community - prokaryotes
ko03010 EO 0.001 2.408 2.413 0.012 < 0.0001 0.014 Ribosome Translation
ko03070 EO 0.010 1.208 1.234 0.020 < 0.0001 < 0.0001 Bacterial secretion system Membrane transport
ko04122 EO 0.023 1.057 1.110 0.044 < 0.0001 < 0.0001 Sulfur relay system Folding, sorting and degradation

Only the major KEGG pathways, representing at least ≥ 0.5% of the average relative abundance of at least one of the treatment groups that were significantly different (Q ≤ 0.05) are shown.

CON, control diet; EO, essential oil fed at 3 mg/d.

Download Excel Table
Table 6. Essential oil (EO) treatment associated archaeal KEGG pathways analyzed by Maaslin21)
KEGG pathways Associated categorical feature Coefficient Relative abundance (%) SEM3 p-value Q-value KEGG pathway description KEGG objects
CON2) EO
ko00190 CON 0.012 0.962 0.939 0.016 < 0.0001 < 0.0001 Oxidative phosphorylation Energy metabolism
ko00330 CON 0.009 0.965 0.949 0.011 < 0.0001 < 0.0001 Arginine and proline metabolism Amino acid metabolism
ko00900 CON 0.002 3.557 3.550 0.027 < 0.0001 < 0.0001 Terpenoid backbone biosynthesis Metabolism of terpenoids and polyketides
ko03030 CON 0.001 4.885 4.882 0.037 < 0.0001 0.004 DNA replication Replication and repair
ko03050 CON 0.002 1.211 1.209 0.009 < 0.0001 < 0.0001 Proteasome Folding, sorting and degradation
ko04112 CON 0.013 1.319 1.291 0.015 < 0.0001 < 0.0001 Cell cycle - Caulobacter Cell growth and death
ko00121 EO 0.013 2.408 2.455 0.022 < 0.0001 < 0.0001 Secondary bile acid biosynthesis Lipid metabolism
ko00450 EO 0.003 2.924 2.939 0.017 < 0.0001 0.001 Selenocompound metabolism Metabolism of other amino acids
ko00550 EO 0.011 3.239 3.291 0.027 < 0.0001 < 0.0001 Peptidoglycan biosynthesis Glycan biosynthesis and metabolism
ko00790 EO 0.002 3.728 3.743 0.032 < 0.0001 0.001 Folate biosynthesis Metabolism of cofactors and vitamins
ko02010 EO 0.006 0.891 0.905 0.017 < 0.0001 < 0.0001 ABC transporters Membrane transport
ko03420 EO 0.002 3.613 3.629 0.042 < 0.0001 0.004 Nucleotide excision repair Replication and repair
ko03430 EO 0.007 3.247 3.282 0.016 < 0.0001 < 0.0001 Mismatch repair Replication and repair
ko04122 EO 0.002 6.180 6.198 0.032 < 0.0001 0.001 Sulfur relay system Folding, sorting and degradation

Only the major KEGG pathways, representing at least ≥ 0.5% of the average relative abundance of at least one of the treatment groups that were significantly different (Q ≤ 0.05) are shown.

CON, control diet; EO, essential oil fed at 3 mg/d.

Download Excel Table

DISCUSSION

Prior research indicated that EO did not significantly alter fermentation characteristics, such as VFA profiles, various nutrient digestibility estimates, and ammonia concentration in effluent samples from this DFCC experiment but there was a 10% decrease in CH4 for this study [25], aligning with the findings of a meta-analysis of the effects of AR treatment [2]. Our findings also demonstrated that EO had no impact on protozoal populations, including the specific genera identified in the present study. This is particularly noteworthy, as protozoal inhibition has been suggested as a potential mechanism for EO-induced CH4 mitigation by targeting hydrogen producers and the protozoa-associated methanogen community [2630]. However, previous studies on various EOs have not consistently demonstrated this effect [31], highlighting the need for further research to elucidate the potential mechanisms through which EOs influence CH4 production under different ruminal conditions. Further, DFCC systems modified for protozoal retention tend to harbor fewer protozoa – a drawback which has been documented in previous work [12] and the specific effect of EO on protozoa is recommended for further investigation in other in vitro models.

In the current study, analyses using Bray-Curtis and Jaccard matrices revealed that the overall archaeal and bacterial microbiome remained unaffected by EO treatment, aligning with results from previous studies on EO treatments both in vitro and in vivo [3234]. Despite minor microbial shifts, the overall microbiome exhibited relative stability.

EO treatment decreased the alpha diversity of the archaeota and bacteriota, which was consistent with findings from an in vivo study on lactating dairy cows [7]. This reduction in prokaryotic diversity could be linked to more efficient feed utilization and decreased CH4 emissions [35]. Previous EO treatments have been reported to inhibit methanogens and decrease CH4 production [31,3638], suggesting that the observed lower methanogenic diversity and abundance of methylotrophic methanogen might result from the direct inhibitory effects of EOs. However, further research, particularly involving AR treatment, is needed to validate these suggestions.

Carbohydrate-fermenting Clostridia such as Clostridia UCG-014 and Christensenellaceae R-7 group, which accounted for a significant portion of ruminal hydrogenase transcripts in a previous study [39], play a key role in hydrogen production. Therefore, reducing the abundance of these primary hydrogen producers could decrease CH4 production. The differential distribution of two butyrivibrios might affect fermentation characteristics, especially butyrate production, due to their similar phenotypic characteristics but distinct phylogenetic classification [40]. Propionate-producing bacteria such as Succinivibrionaceae UCG-002, commonly found in the CH4-inhibited conditions in the rumen of dairy cattle [41,42], were prevalent in the EO treatment, supporting previous observations of numerically increased propionate levels with EO treatment [25]. The abundance of Spirochaetes, specifically Treponema spp., was significantly higher in the EO treatment, and also exhibited greater abundance in EO-treated lactating dairy cows [7]. However, the metabolic versatility of Treponema spp. makes it difficult to pinpoint the exact reason for their increased abundance in response to EO treatment [43].

The inhibition of CH4 production could stimulate anabolic processes requiring metabolic hydrogen, such as fatty acid synthesis [44]. Although we did not observe significant changes in metabolic hydrogen concentrations previously for this study [24], shifts in microbial pathways related to these fermentation end-products are anticipated following EO treatment.

Among the KEGG pathways related to CH4 metabolism (ko00680), the control group exhibited significant differences in the relative abundance of pathways involved in the pentose phosphate pathway, glycine, serine and threonine metabolism, glyoxylate and dicarboxylate metabolism, and carbon fixation pathways in prokaryotes, whereas EO treatment stimulated pathways related to the metabolism of cofactors and vitamins including riboflavin metabolism and folate biosynthesis.

Acetogens require folate to produce acetate and ATP by reducing two molecules of carbon dioxide through the Wood-Ljungdahl pathway [45,46]. Therefore, although we did not detect significant changes in acetogen growth, our findings suggest that there was a shift in their growth patterns, especially under conditions that inhibited CH4 production. The stimulation of riboflavin metabolism, associated with the biosynthesis of coenzyme F420 [47], could potentially counteract EO-mediated methanogenesis inhibition. However, this function and other vitamin B complex metabolic functions were also more prevalent in the rumen microbiome of cows exhibiting high milk yield and milk protein content [48]. Additionally, archaeal metabolic pathways enriched in response to EO administration, such as the biosynthesis of secondary bile acids and ABC transporters, were found to be negatively correlated with CH4 emissions [49], suggesting that they play a key role in modulating the microenvironment and facilitating host-microbiome interactions [5052].

Collectively, our findings suggest that the lack of substantial effects of EO on fermentation and digestion parameters measured parallel to the current study [24] might be due to the absence of a direct inhibitory effect of EO on methanogens. Offsetting shifts in the relative abundance of fiber-degrading bacteria and detailed methanogen communities deserve further investigation including predicted metabolic pathways impacted by population changes. It appears that EO moderates CH4 production primarily by modulating the ruminal prokaryotic microbiome.

Competing interests

No potential conflict of interest relevant to this article was reported.

Funding sources

This research was supported by the Chung-Ang University Research Grants in 2024 and by a donation to The Ohio State University from Agolin SA in 2023.

Acknowledgements

The authors would like to thank Sripoorna Somasundaram for her assistance in the lab.

Availability of data and material

Upon reasonable request, the datasets of this study can be available from the corresponding author.

Authors’ contributions

Conceptualization: Wenner BA.

Data curation: Park T, Wenner BA.

Formal analysis: Park T, Wenner BA.

Methodology: Praisler G, Wenner BA.

Software: Park T.

Validation: Park T, Wenner B.

Investigation: Praisler G.

Writing - original draft: Park T.

Writing - review & editing: Park T, Praisler G, Wenner BA.

Ethics approval and consent to participate

All experimental procedures were reviewed and approved by the Institutional Animal Care and Use Committee protocol #2013A00000073.

REFERENCES

1.

European Commission. Launch by United States, the European Union, and partners of the Global Methane Pledge to keep 1.5C within reach [Internet]. 2021.cited 2024 Mar 9https://ec.europa.eu/commission/presscorner/detail/en/statement_21_5766.

2.

Belanche A, Newbold CJ, Morgavi DP, Bach A, Zweifel B, Yáñez-Ruiz DR. A meta-analysis describing the effects of the essential oils blend agolin ruminant on performance, rumen fermentation and methane emissions in dairy cows. Animals. 2020; 10:620

3.

Calsamiglia S, Busquet M, Cardozo PW, Castillejos L, Ferret A. Invited review: essential oils as modifiers of rumen microbial fermentation. J Dairy Sci. 2007; 90:2580-95

4.

Becker F, Spengler K, Reinicke F, Heider-van Diepen C. Impact of essential oils on methane emissions, milk yield, and feed efficiency and resulting influence on the carbon footprint of dairy production systems. Environ Sci Pollut Res. 2023; 30:48824-36

5.

Elcoso G, Zweifel B, Bach A. Effects of a blend of essential oils on milk yield and feed efficiency of lactating dairy cows. Appl Anim Sci. 2019; 35:304-11

6.

Hart KJ, Jones HG, Waddams KE, Worgan HJ, Zweifel B, Newbold CJ. An essential oil blend decreases methane emissions and increases milk yield in dairy cows. Open J Anim Sci. 2019; 9:259

7.

Bach A, Elcoso G, Escartín M, Spengler K, Jouve A. Modulation of milking performance, methane emissions, and rumen microbiome on dairy cows by dietary supplementation of a blend of essential oils. Animal. 2023; 17:100825

8.

Park T, Praisler G, Wenner BA. Treatment of continuous culture fermenters with an organic essential oil product minimally influenced bacterial relative abundance.In ADSA Annual Meeting June 25–28. 2023 Ottawa, Ontario.

9.

Wenner BA, Kesselring E, Antal L, Henthorne T, Carpenter AJ. Dual-flow continuous culture fermentor system updated to decrease variance of estimates of digestibility of neutral detergent fiber. Appl Anim Sci. 2021; 37:445-50

10.

Mitchell KE, Kienzle SL, Lee C, Socha MT, Kleinschmit DH, Firkins JL. Supplementing branched-chain volatile fatty acids in dual-flow cultures varying in dietary forage and corn oil concentrations. II: Biohydrogenation and incorporation into bacterial lipids. J Dairy Sci. 2023; 106:7548-65

11.

Dehority BA. Evaluation of subsampling and fixation procedures used for counting rumen protozoa. Appl Environ Microbiol. 1984; 48:182-5

12.

Wenner BA, Wagner BK, St-Pierre NR, Yu ZT, Firkins JL. Inhibition of methanogenesis by nitrate, with or without defaunation, in continuous culture. J Dairy Sci. 2020; 103:7124-40

13.

Yu Z, Morrison M. Improved extraction of PCR-quality community DNA from digesta and fecal samples. Biotechniques. 2004; 36:808-12

14.

Caporaso JG, Lauber CL, Walters WA, Berg-Lyons D, Lozupone CA, Turnbaugh PJ, et al. Global patterns of 16S rRNA diversity at a depth of millions of sequences per sample. Proc Natl Acad Sci USA. 2011; 108:4516-22

15.

Bolyen E, Rideout JR, Dillon MR, Bokulich NA, Abnet CC, Al-Ghalith GA, et al. Reproducible, interactive, scalable and extensible microbiome data science using QIIME 2. Nat Biotechnol. 2019; 37:852-7

16.

Wenner BA, Park T, Mitchell K, Kvidera SK, Griswold KE, Horst EA, et al. Effect of zinc source (zinc sulfate or zinc hydroxychloride) on relative abundance of fecal Treponema spp. in lactating dairy cows. JDS Commun. 2022; 3:334-8

17.

Quast C, Pruesse E, Yilmaz P, Gerken J, Schweer T, Yarza P, et al. The SILVA ribosomal RNA gene database project: improved data processing and web-based tools. Nucleic Acids Res. 2013; 41:D590-6

18.

Bokulich NA, Kaehler BD, Rideout JR, Dillon M, Bolyen E, Knight R, et al. Optimizing taxonomic classification of marker-gene amplicon sequences with QIIME 2’s q2-feature-classifier plugin. Microbiome. 2018; 6:90

19.

Kaehler BD, Bokulich NA, McDonald D, Knight R, Caporaso JG, Huttley GA. Species abundance information improves sequence taxonomy classification accuracy. Nat Commun. 2019; 10:4643

20.

Xia Y. q2-repeat-rarefy: QIIME2 plugin for generating the average rarefied table for library size normalization using repeated rarefaction [Internet]. GitHub repository 2021.cited 2024 Mar 9https://github.com/yxia0125/q2-repeat-rarefy.

21.

Douglas GM, Maffei VJ, Zaneveld JR, Yurgel SN, Brown JR, Taylor CM, et al. PICRUSt2 for prediction of metagenome functions. Nat Biotechnol. 2020; 38:685-8

22.

Mallick H, Rahnavard A, McIver LJ, Ma S, Zhang Y, Nguyen LH, et al. Multivariable association discovery in population-scale meta-omics studies. PLOS Comput Biol. 2021; 17e1009442

23.

Dixon P. VEGAN, a package of R functions for community ecology. J Veg Sci. 2003; 14:927-30

24.

Tang Y, Horikoshi M, Li W. ggfortify: unified interface to visualize statistical results of popular R packages. R J. 2016; 8:474-85

25.

Wenner BA, Mitchell KE, Praisler G, Kienzle S, Velez JS, Yoder PS. Evaluating methane mitigation by organic-certified feed additives within continuous culture. J Dairy Sci. 2022; 105:174-5

26.

Torres RNS, Moura DC, Ghedini CP, Ezequiel JMB, Almeida MTC. Meta-analysis of the effects of essential oils on ruminal fermentation and performance of sheep. Small Rumin Res. 2020; 189:106148

27.

Yarlett N, Coleman GS, Williams AG, Lloyd D. Hydrogenosomes in known species of rumen entodiniomorphid protozoa. FEMS Microbiol Lett. 1984; 21:15-9

28.

Lloyd D, Hillman K, Yarlett N, Williams AG. Hydrogen production by rumen holotrich protozoa: effects of oxygen and implications for metabolic control by in situ conditions. J Protozool. 1989; 36:205-13

29.

Tymensen LD, McAllister TA. Community structure analysis of methanogens associated with rumen protozoa reveals bias in universal archaeal primers. Appl Environ Microbiol. 2012; 78:4051-6

30.

Tymensen LD, Beauchemin KA, McAllister TA. Structures of free-living and protozoa-associated methanogen communities in the bovine rumen differ according to comparative analysis of 16S rRNA and mcrA genes. Microbiology. 2012; 158:1808-17

31.

Cobellis G, Trabalza-Marinucci M, Yu Z. Critical evaluation of essential oils as rumen modifiers in ruminant nutrition: a review. Sci Total Environ. 2016; 545:556-68

32.

Schären M, Drong C, Kiri K, Riede S, Gardener M, Meyer U, et al. Differential effects of monensin and a blend of essential oils on rumen microbiota composition of transition dairy cows. J Dairy Sci. 2017; 100:2765-83

33.

Choi Y, Lee SJ, Kim HS, Eom JS, Jo SU, Guan LL, et al. Oral administration of Pinus koraiensis cone essential oil reduces rumen methane emission by altering the rumen microbial composition and functions in Korean native goat (Capra hircus coreanae). Front Vet Sci. 2023; 10:1168237

34.

Ranilla MJ, Andrés S, Gini C, Biscarini F, Saro C, Martín A, et al. Effects of Thymbra capitata essential oil on in vitro fermentation end-products and ruminal bacterial communities. Sci Rep. 2023; 13:4153

35.

Shabat SKB, Sasson G, Doron-Faigenboim A, Durman T, Yaacoby S, Miller MEB, et al. Specific microbiome-dependent mechanisms underlie the energy harvest efficiency of ruminants. ISME J. 2016; 10:2958-72

36.

Patra AK, Yu Z. Effects of essential oils on methane production and fermentation by, and abundance and diversity of, rumen microbial populations. Appl Environ Microbiol. 2012; 78:4271-80

37.

Nowak B, Moniuszko-Szajwaj B, Skorupka M, Puchalska J, Kozłowska M, Bocianowski J, et al. Effect of Paulownia leaves extract levels on in vitro ruminal fermentation, microbial population, methane production, and fatty acid biohydrogenation. Molecules. 2022; 27:4288

38.

Yanza YR, Szumacher-Strabel M, Lechniak D, Ślusarczyk S, Kolodziejski P, Patra AK, et al. Dietary Coleus amboinicus Lour. decreases ruminal methanogenesis and biohydrogenation, and improves meat quality and fatty acid composition in longissimus thoracis muscle of lambs. J Anim Sci Biotechnol. 2022; 13:5

39.

Shi W, Moon CD, Leahy SC, Kang D, Froula J, Kittelmann S, et al. Methane yield phenotypes linked to differential gene expression in the sheep rumen microbiome. Genome Res. 2014; 24:1517-25

40.

Van Gylswyk NO, Hippe H, Rainey FA. Pseudobutyrivibrio ruminis gen. nov., sp. nov., a butyrate-producing bacterium from the rumen that closely resembles Butyrivibrio fibrisolvens in phenotype. Int J Syst Bacteriol. 1996; 46:559-63

41.

Danielsson R, Dicksved J, Sun L, Gonda H, Müller B, Schnürer A, et al. Methane production in dairy cows correlates with rumen methanogenic and bacterial community structure. Front Microbiol. 2017; 8:226

42.

Ramayo-Caldas Y, Zingaretti L, Popova M, Estellé J, Bernard A, Pons N, et al. Identification of rumen microbial biomarkers linked to methane emission in Holstein dairy cows. J Anim Breed Genet. 2020; 137:49-59

43.

Krieg NR, Staley JT, Brown DR, Hedlund BP, Paster BJ, Ward NL. Bergey’s manual of systematic bacteriology. 2nd. Vol. 4,. The Bacteroidetes, Spirochaetes, Tenericutes (Mollicutes), Acidobacteria, Fibrobacteres, Fusobacteria, Dictyoglomi, Gemmatimonadetes, Lentisphaerae, Verrucomicrobia, Chlamydiae, and Planctomycetes. New York: Springer. 2011

44.

Ungerfeld EM. Metabolic hydrogen flows in rumen fermentation: principles and possibilities of interventions. Front Microbiol. 2020; 11:589

45.

Dumitru R, Palencia H, Schroeder SD, DeMontigny BA, Takacs JM, Rasche ME, et al. Targeting methanopterin biosynthesis to inhibit methanogenesis. Appl Environ Microbiol. 2003; 69:7236-41

46.

Ragsdale SW, Pierce E. Acetogenesis and the Wood–Ljungdahl pathway of CO2 fixation. Biochim Biophys Acta Proteins Proteomics. 2008; 1784:1873-98

47.

Grinter R, Greening C. Cofactor F420: an expanded view of its distribution, biosynthesis and roles in bacteria and archaea. FEMS Microbiol Rev. 2021; 45:fuab021

48.

Xue MY, Sun HZ, Wu XH, Liu JX, Guan LL. Multi-omics reveals that the rumen microbiome and its metabolome together with the host metabolome contribute to individualized dairy cow performance. Microbiome. 2020; 8:64

49.

Martínez-Álvaro M, Auffret MD, Duthie CA, Dewhurst RJ, Cleveland MA, Watson M, et al. Bovine host genome acts on rumen microbiome function linked to methane emissions. Commun Biol. 2022; 5:350

50.

Immig I. The effect of porcine bile acids on methane production by rumen contents in vitro. Arch Tierernahr. 1998; 51:21-6

51.

Wahlström A, Sayin SI, Marschall HU, Bäckhed F. Intestinal crosstalk between bile acids and microbiota and its impact on host metabolism. Cell Metab. 2016; 24:41-50

52.

Evans PN, Boyd JA, Leu AO, Woodcroft BJ, Parks DH, Hugenholtz P, et al. An evolving view of methane metabolism in the Archaea. Nat Rev Microbiol. 2019; 17:219-32