

INTRODUCTION
Pigs can give birth approximately 2.5 times per year [1], and in Korea, it takes around 6 months for piglets to grow into mature pigs and reach market weight [2]. Various environmental factors are investigated to achieve this target weight for piglet shipment and to shorten the shipment period [3,4]. Temperature is identified as a factor influencing pig weight gain, carcass characteristics, and meat quality [5], and in regions experiencing four seasons, seasonal temperature variations impact the rate of pig weight gain [6].
Korea, positioned between 33 and 43 degrees north latitude, experiences both continental and oceanic climates. This geographical setting, coupled with the climatic conditions, contributes to significant temperature differences across the four seasons. Consequently, pigs raised in Korea inevitably face seasonal variations in production levels. Additionally, temperatures at the conclusion of the fattening period before market shipment are believed to influence pig production, although research in this area remains limited.
Pork is the most consumed meat in Europe and Asia and ranks second worldwide after poultry [7]. Methods for butchering and sizing pork vary significantly by country, with distinct preferences for different cuts prevailing in each region. Pork sausages have emerged as a typical meat consumption pattern in Europe [8,9]. Sausages, primarily made from the ham [10], are particularly favored, reflecting high consumption levels of these parts in Europe. Conversely, Korea shows a marked preference for lean cuts, especially pork belly and shoulder blade. Remarkably, pork belly constitutes 59% of the per capita meat consumption in Korea [11] and remains the most favored cut among Korean consumers [12]. This variation in cut preference drives disparities in demand and pricing. Korea is approximately fourfold [13]. Consequently, accurate measurement and forecasting of pork part production are becoming critical in the pork industry.
The adoption of non-destructive livestock carcass analyzers is widespread in major livestock-producing nations as they enable real-time measurement of carcass production at slaughterhouses [14]. Key non-destructive carcass analyzers include technologies utilizing ultrasound and camera imagery [15,16]. These devices are pivotal in meat quality assurance and have become essential tools for ensuring the safety of consumable meat [17]. The accuracy of these measurements in assessing pork part production is confirmed by a more than 95% concordance rate with the actual weight of pork parts [18,19].
This study examines the influence of seasonal temperature fluctuations on pork production by monitoring the monthly carcass weight and prime cuts production of market-bound Landrace × Yorkshire × Duroc pigs using non-destructive carcass analyzer, evaluating nearly 700,000 pigs produced over the course of a year. It also explores how seasonal temperatures affect prime cuts. The findings provide valuable data for predicting monthly variations in pork production and preparing for market demands.
MATERIALS AND METHODS
All pigs used in this study were Landrace × Yorkshire × Duroc (LYD) pigs slaughtered at the Bukyeong Livestock Market in Gimhae, Gyeongsangnam-do, Korea from January 2023 to December 2023 by the Livestock Products Sanitation Management Act (In Korea, revised in 2024). Carcass grading was determined based on the primary grading criteria for pig carcasses (Ministry of Agriculture, Food and Rural Affairs Notification No. 2023-102) using the measured carcass weight and backfat thickness. A total of 699,727 pigs, including gilts (n = 353,258) and barrows (n = 346,469), graded as 1+, 1, or 2 (excluding non-graded carcasses), were used. To analyze carcass characteristics and the yield of primal cuts, the non-destructive carcass analyzer automated carcass analysis system was used to measure the weights of the shoulder blade, shoulder picnic, loin, belly, and ham. Because the tenderloin and ribs have relatively small weights and high measurement errors, these two primal cuts were excluded from the analysis. Carcass weight and backfat thickness were also measured. The collected data were used to determine the mean of each cut, derive correlations, and perform regression analyses.
All primal cut weights were measured with the non-destructive carcass analyzer VCS2000. The VCS2000 system (E+V Technology GmbH) consists of a monochrome camera, two color cameras, an illumination unit, a background unit, a carcass guide, a carcass holder, a control box, vision software, a computer, and spare parts. During the slaughtering process, the pig carcasses were split into halves. The rear part of the carcass was imaged using a monochrome camera, while two color cameras captured the upper and lower surfaces of the front part of the split carcass. The images were then processed and analyzed on a computer.
One-way ANOVA was performed on the carcass weight, back fat thickness, shoulder blade, shoulder picnic, loin, belly, and ham weights measured by non-destructive carcass analyzer to confirm the significance. In addition, a post-hoc analysis was conducted using the Tukey HSD test, and it was accepted at a significance level of 0.05 or less. The Pearson correlation coefficient represented the relationship between the carcass characteristics (carcass weight, back fat thickness) and the five selected cuts (shoulder blade, shoulder picnic, loin, belly, and ham), and the Spearman correlation coefficient represented the relationship between temperature and cuts. Regression analysis was performed using carcass weight as the dependent variable and the weight of each cut as the independent variable, and single and multiple regression analyses were performed. The goodness of fit for the regression analysis was expressed as the coefficient of determination (R2).
All statistical analyses were performed using SPSS software, version 28.0 (SPSS Statistics), and the Scikit-learn library for Python (version 3.11.4, Python Software Foundation). ‘Pandas version 2.1.1’ and ‘Numpy version 1.26.0’ were used for data processing and analysis, respectively. To calculate the Pearson correlation coefficient and Spearman correlation coefficient, the built-in function of Python and ‘scipy version 1.11.2’ were used.
RESULTS AND DISCUSSION
A total of 699,727 LYD pigs were assessed for carcass weight and backfat thickness according to the Republic of Korea’s carcass grading standards. The carcass weight of LYD pigs averaged 87 kg, with a backfat thickness of approximately 22.3 mm (Table 1). This corresponds to the highest carcass grade in Korea, 1+ (Livestock Products Sanitary Control Act, 2023 revision). For 620 manually graded LYD pigs, the carcass weight was 86.96 kg, and the backfat thickness was 22.17 mm [20], indicating results similar to those of this study.
| Carcass weight (kg) | Backfat thickness (mm)2) |
|---|---|
| 86.84 ± 6.81 | 22.26 ± 4.22 |
In Korea, a study analyzing the carcass weight of 33,622 LYD pigs using the non-destructive carcass analyzer (VCS2000) [21] and another evaluating the carcass characteristics of 200 Duroc pigs and 420 LYD pigs [20] both demonstrated trends consistent with the findings of the present study. LYD pork carcass production was quantified by weighing the shoulder blade, shoulder picnic, loin, belly, and ham using non-destructive carcass analyzer (Table 2). The production yield for each component ranked in the order of ham, belly, shoulder picnic, loin, and shoulder blade, revealing significant differences among cuts (p < 0.05, Table 2). A study investigating the production yield of 316 LYD pigs with a non-destructive carcass analyzer reported the following weight sequence: ham, belly, shoulder, loin, shoulder blade, back rib, jowl, false lean, and diaphragm, consistent with the findings of this study [22]. Another study that examined the production yield of 36,994 pigs from five different breeds also confirmed a similar ranking of ham, belly, shoulder, and loin, corroborating our findings [23].
| Shoulder blade (kg) | Shoulder picnic (kg) | Loin (kg) | Belly (kg) | Ham (kg) |
|---|---|---|---|---|
| 5.85 ± 0.50e | 11.31 ± 1.04c | 9.86 ± 0.94d | 16.73 ± 1.79b | 19.07 ± 1.70a |
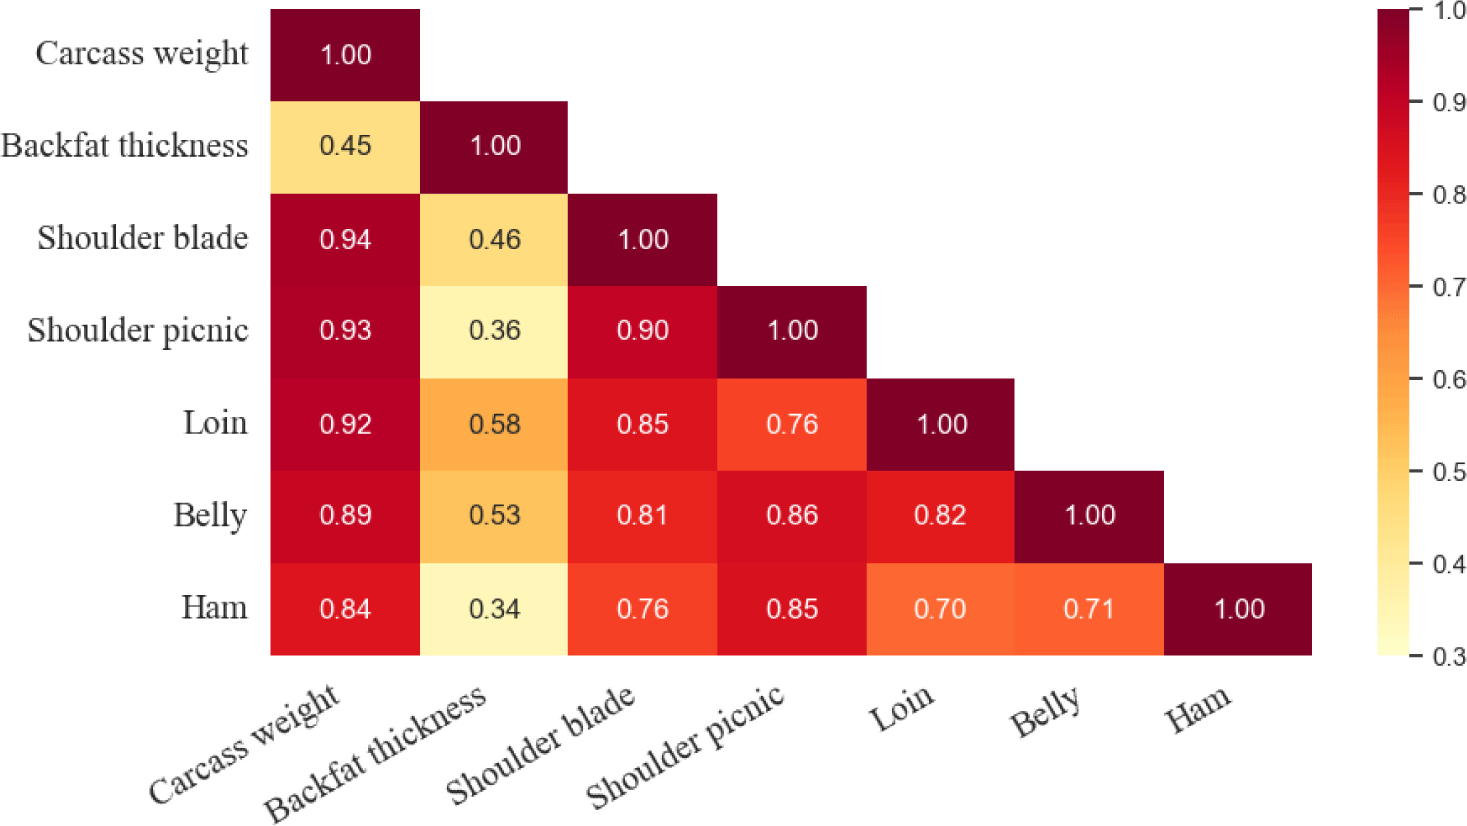
Pearson correlation coefficients were calculated to measure the correlations among carcass weight, backfat thickness, and the five different primal cuts, and were visualized via a heatmap (Fig. 1). A Pearson correlation coefficient close to 0 indicates no linear relationship, while values near –1 or 1 signify a strong linear relationship [24]. The order of the strongest correlations between carcass weight and each primal cut was shoulder blade, shoulder picnic, loin, belly, and ham, reflecting increasingly linear relationships. Moreover, in LYD pigs, the correlation between carcass weight and each primal cut exceeded 0.7, denoting a strong positive correlation [25]. Backfat thickness exhibited relatively low positive correlations with the five primal cuts (Fig. 1). For native Korean black pigs, some primal cuts showed negative correlations with backfat thickness [26], yet carcass yield and backfat thickness had a moderate positive correlation [26,27]. In Polish pigs, an increase in backfat thickness resulted in a decrease in ham content and an increase in loin content [28]. Thus, factors such as breed, slaughter weight, and age at slaughter appear to impact the content of each cut more significantly than does backfat thickness [29]. The fat content of the various primal cuts in LYD pigs followed a decreasing trend in the order of belly, shoulder blade, shoulder picnic, ham, and loin [30]. This trend suggests that a reduction in fat content leads to a lowered correlation with backfat thickness. Nonetheless, despite having the lowest fat content, loin exhibited the highest correlation with backfat thickness (Fig. 1), which might be due to a reduction in the loin area as backfat thickness increases [29].
To investigate the relationship between carcass weight and the production yield of each primal cut, both simple and multiple regression analyses were carried out (Tables 3 and 4). In the simple linear regression (SLR) analysis, carcass weight served as the dependent variable, with the production yield of five primal cuts as independent variables. The highest coefficient of determination (R²) was observed for the shoulder blade (0.88), followed by shoulder picnic, loin, belly, and ham (p < 0.05, Table 3). This finding is congruent with that of the Pearson correlation analysis (Fig. 1). The coefficient of determination quantifies the model’s goodness-of-fit [31]. Using non-destructive carcass analyzer, coefficients of determination for each primal cut were all above 0.7, exhibiting an increase over results from a previous study [19], a discrepancy attributed to differences in sample size.
The intercept (β0) decreased sequentially in the primal cuts of belly, ham, loin, shoulder picnic, and shoulder blade, whereas the regression coefficient (β1) decreased in the sequence of shoulder blade, loin, shoulder picnic, belly, and ham. The intercept (β0) represents the portion of the dependent variable that is unaffected by the independent variables in the model, and the regression coefficient (β1) represents the slope of the linear relationship for each primal cut. In this study’s simple linear regression model, β1 indicates the impact of carcass weight on the yield of each primal cut. Primal cuts with a high β1 exhibit greater increases in yield during extended rearing periods, while those with a low β1 show comparatively smaller increases in yield despite longer rearing periods. Accordingly, tailoring the rearing period based on the regression coefficient for each primal cut could optimize the production of specific primal cuts in LYD pigs raised in Korea.
Multiple linear regression (MLR) analysis was conducted using carcass weight as the dependent variable and the production yields of five primal cuts as independent variables (p < 0.05, Table 4). The coefficient of determination for MLR was 0.98, exceeding that of SLR. This value typifies MLR, which models scenarios where multiple independent variables simultaneously impact the dependent variable. In a comparative study utilizing non-destructive carcass analyzer to calculate the MLR for porcine primal cuts, coefficients of determination ranged from 0.77 to 0.82 [32], which were lower than those recorded in our study. This discrepancy is attributed to variations in sample sizes. The regression equation formulated in this research facilitates the prediction of each primal cut’s yield from the carcass weight, with a high coefficient of determination suggesting a high degree of predictive accuracy.
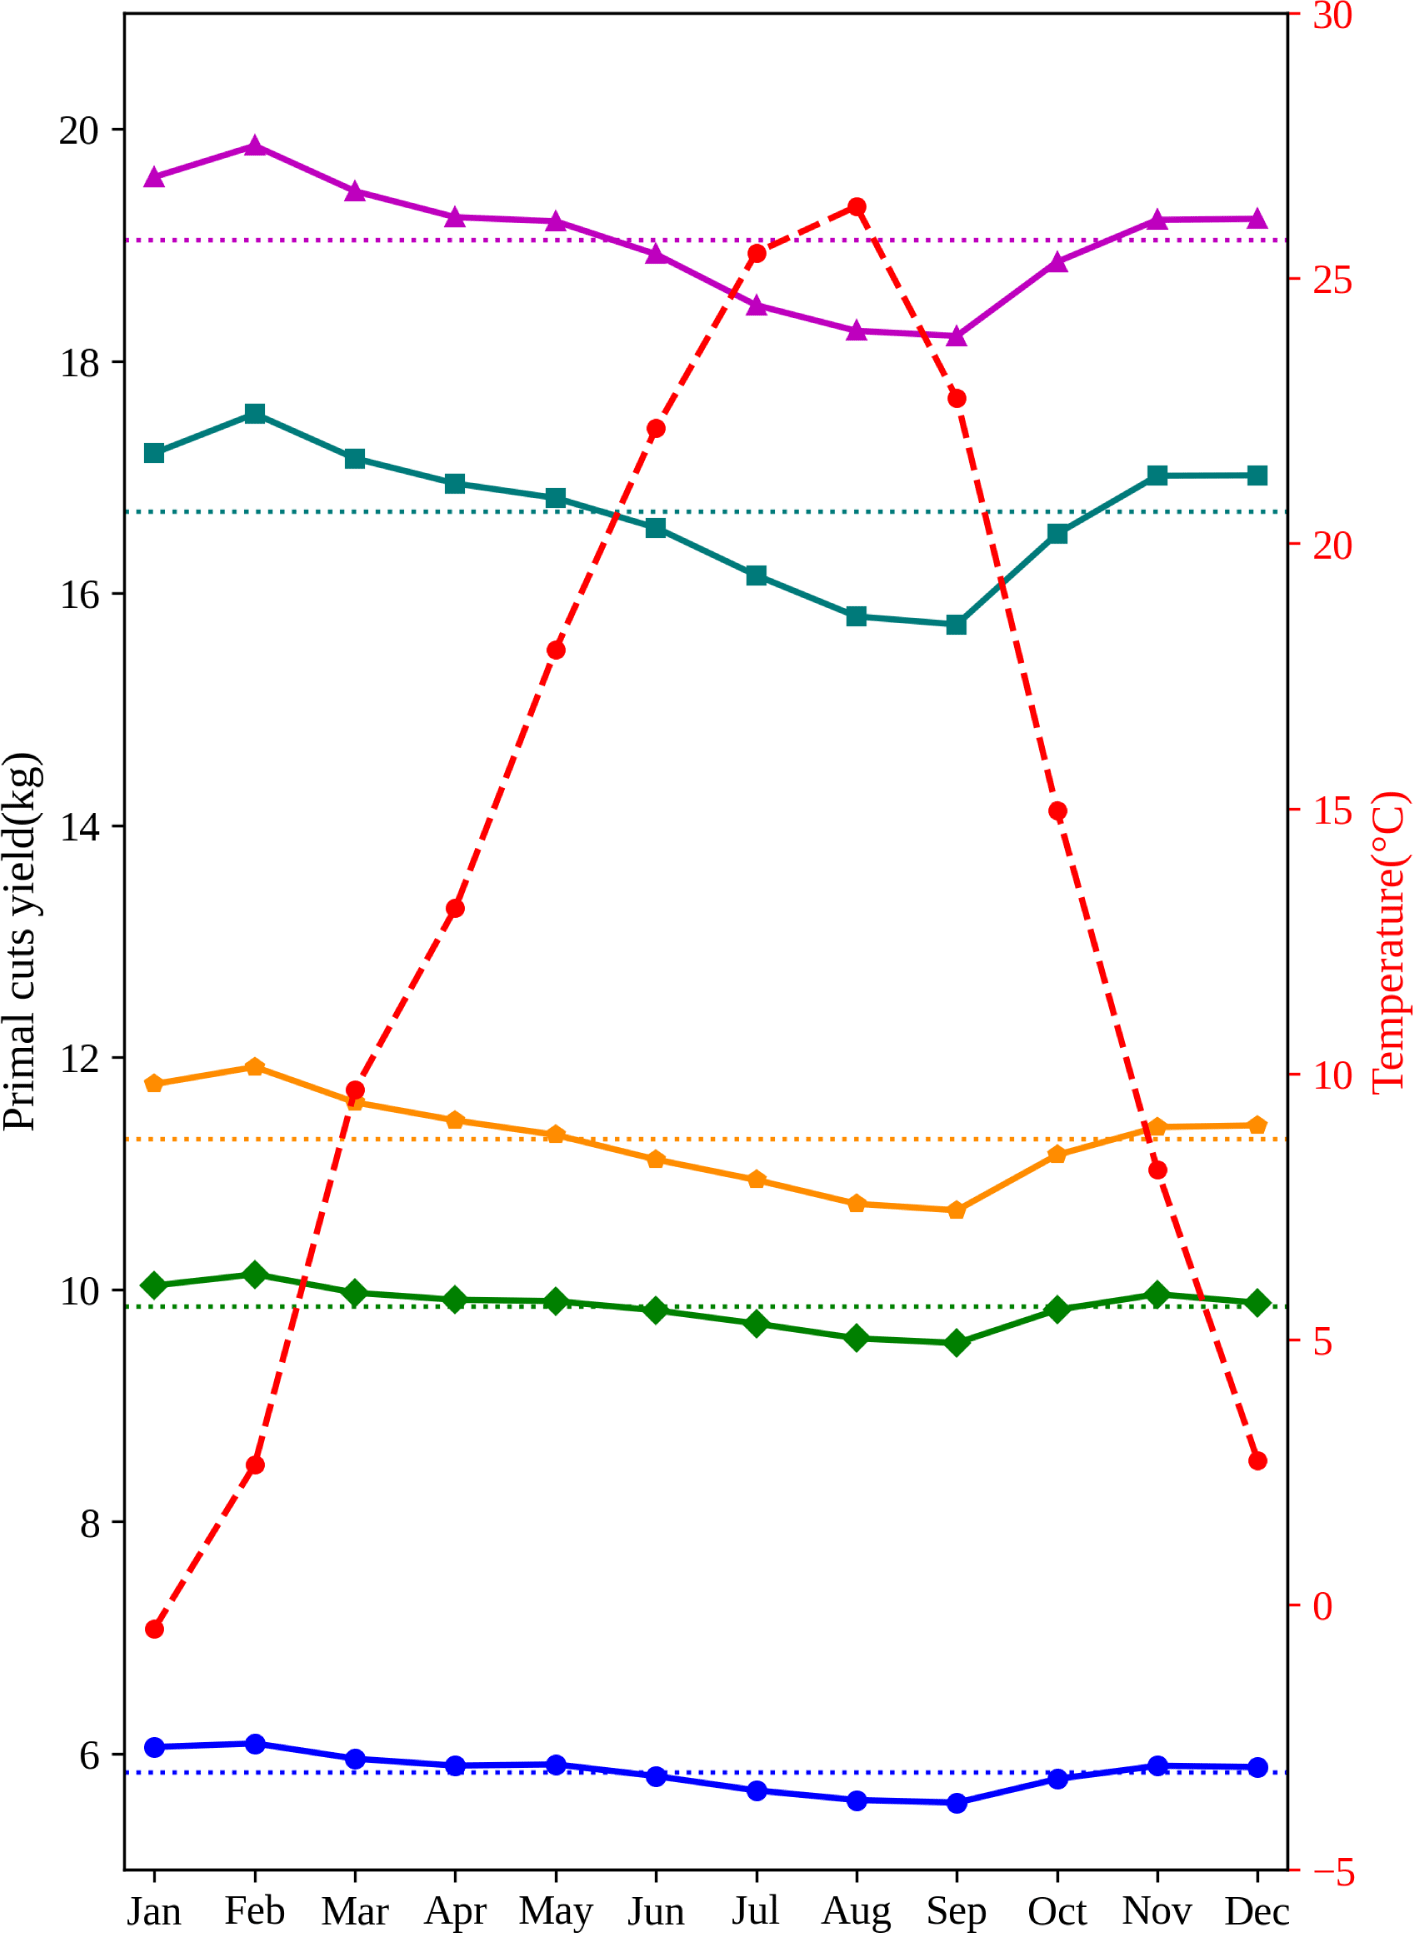
Carcass weight and backfat thickness were measured in accordance with the monthly slaughtering period of pigs (Table 5). The highest carcass weight occurred in February, showing a continuous decline until September, then followed by a rise (p < 0.05). Conversely, backfat thickness reached its lowest in September, increased until November, and then decreased again (p < 0.05). When comparing monthly temperatures and primal cuts production, all primal cuts production, similar to carcass weight, decreased during the high-temperature season (June, July, August) and increased during the low-temperature season (December, January, February). Pigs exposed to heat stress exhibit an increase in heart rate and peripheral blood flow to enhance heat dissipation [33], and they voluntarily reduce feed intake to lower internal heat production [34,35]. Moreover, ambient humidity can affect pig feed intake, and humidity levels above 80% intensify the effect of heat stress on feed intake [36]. In Korea’s hot and humid summer, reduced feed intake due to heat stress results in reduced carcass weight and production yields. Conversely, the cold and dry conditions of winter promote increased feed intake [37], leading to higher carcass weight and production yields. The decline in pig production due to elevated temperatures directly impacts the finishing period at slaughter (Tables 5 and 6; Fig. 2). Consequently, nutritional and environmental management during the finishing period is essential for optimizing pig production.
To examine the relationship between temperature and LYD pig carcass weight, backfat thickness, and primal cuts, Spearman correlation coefficients were calculated (Fig. 3). All Spearman correlation coefficients were negative, indicating that increases in temperature correspond to reductions in pig production at slaughter (Fig. 3). Among the various primal cuts, the loin showed a very weak correlation strength, while the other primal cuts exhibited weak correlations [38]. The interpretation of these correlation coefficients can vary by field [39], and the temperature difference inside and outside of a naturally ventilated farm in Korea is about –3.5°C to 5.0°C, with a humidity variance of approximately 3% [40]. These factors are likely to attenuate the correlation strength between temperature and specific meat types. Notably, backfat thickness showed a weaker correlation with temperature than other primal cuts did (Fig. 3), possibly due to the high heritability estimates of backfat thickness in the Landrace, Yorkshire, and Duroc breeds that make up LYD pigs [41].

CONCLUSION
This study measured the monthly slaughter production of cut meats using the carcass analyzer non-destructive carcass analyzer and established the correlation between carcass weight and cut meats, as well as the regression equation. Over the course of one year, approximately 700,000 pig carcasses were analyzed for five cut meats (Shoulder blade, Shoulder picnic, Loin, Belly, Ham), revealing that the carcass weight and the weight of each cut meat were highest in pigs slaughtered during winter (December, January, February), while the back fat thickness peaked in pigs slaughtered during fall (September, October, November). The simple regression coefficients (R2) of all cut meats, as determined through regression analysis, were 0.71 or higher, and the multiple regression coefficients for all cut meats were notably high at 0.98. Furthermore, the Pearson correlation coefficients between the weights of the five cut meats and carcass weight ranged from 0.70 to 0.94, indicating a strong positive correlation. The Spearman correlation coefficient between the temperature and the cut meat by shipping month ranged from –0.15 to –0.31, indicating a weak negative correlation. In conclusion, the non-destructive carcass analyzer enables accurate predictions of each cut meat’s production based on the fluctuating carcass weight of pigs by slaughter month, allowing for effective response to market demand. In pig farming, shipping time is strategically determined based on temperature, serving as a valuable indicator for breeding or fattening strategies targeted at the production of specific cuts of meat. Therefore, the results could be used as a guideline for optimizing shipping schedules to enhance the production of specific meat cuts.


