INTRODUCTION
Ochratoxin A (OTA) is generated by fungi, such as Aspergillus and Penicillium spp., and it is a widespread contaminant in farm animal feeds, including meat, cereal grain, vegetables, and forage [1]. When these contaminated foods are ingested by humans or animals, they induce a range of negative effects, including nephrotoxicity, carcinogenicity, teratogenicity, immunotoxicity, and hepatotoxicity [2]. OTA exposure is more common in farm animals than in humans who consume safely processed foods. In contrast, farm animals can be exposed to OTA via various environmental contaminants. With the gradual increase in OTA exposure in farm animals, the livestock industry has been affected by various diseases and economic loss, impacting several organs and tissues [3–5]. Furthermore, several OTA-focussed studies have demonstrated that the toxic effects of OTA include inflammation, oxidative stress, and apoptosis through changes in the expression of genes involved in various signaling pathways [6–8]. Notably, OTA is absorbed in the small intestine, particularly the proximal jejunum, where it can target and hamper intestinal function [9,10].
The intestinal epithelium—a physical barrier in the immune system—plays a vital role in the maintenance of health, nutrient absorption, and protection from harmful external factors, such as contaminated foods and toxins. Intestinal biological barriers are supported by tight junctions that are a necessary defence against external factors and which regulate the paracellular movement of harmful factors from the lumen of the small intestine into the body. However, if the epithelial barrier is damaged OTA can spread to the interior intestinal wall. OTA-mediated toxicity impairs intestinal epithelial barrier function, resulting in inflammatory activity and tight junction collapse [11–13]. Additionally, various studies have shown that OTA can injure the intestinal mucosa and inactivate the immune system in humans and animals, resulting in tight junction structure disruption and an inflammatory response [14–17]. OTA represents a significant threat to the porcine industry as it accumulates in the muscle and induces weight loss, dehydration, and diarrhea [18,19]. Nevertheless, research on the mechanisms affected by OTA is still lacking. Additionally, few OTA-mediated studies in the small intestine of pigs have articulated the molecular mechanisms involved. Thus, we confirmed the molecular changes in porcine small intestine enterocytes (IPEC-J2 cells) treated with OTA.
To this end, we assessed the cytotoxicity and alteration in tight junctions after treatment with OTA and confirmed the gene expression profile of OTA-treated IPEC-J2 cells. Additionally, genes significantly upregulated or downregulated by OTA were further examined to investigate their various functions in IPEC-J2 cells.
MATERIALS AND METHODS
IPEC-J2 cells—an immortalized cell line derived from the jejunal epithelium of unsuckled piglets [20,21]—were cultured in Dulbecco’s Modified Eagle Medium supplemented with 10% fetal bovine serum and 1% penicillin-streptomycin at 37°C in an atmosphere of 5% CO2. OTA (Sigma-Aldrich, St. Louis, MO, USA) was prepared in dimethyl sulfoxide (DMSO) for treating IPEC-J2 cells.
IPEC-J2 cells were seeded in 96-well plates at a density of 1 × 10⁴ cells per well and then exposed to OTA (0, 0.5, 1, 2, 4, 5, 10, 20, 30, and 40 μM) for 48 h. After exposure, the cells were treated with a water-soluble tetrazolium-1 cell proliferation reagent and incubated at 37°C for 2 h. Next, the absorbance of the dye was analyzed by subtracting the background wavelength at 600 nm from that at 450 nm using a GloMax Discover Multi-Microplate Reader.
IPEC-J2 cells were treated with OTA for 48 h before RNA extraction. Total RNA was extracted using the AccuPrep Universal RNA Extraction Kit and RNA quality was assessed using an Agilent 2100 bioanalyzer with the RNA 6000 Nano Chip (Agilent Technologies, Amstelveen, Netherlands). RNA was quantified using an ND-2000 Spectrophotometer (Thermo Fisher Scientific, Waltham, Ma, USA). Library was constructed using the QuantSeq 3 mRNA-Seq Library Prep Kit (Lexogen, Vienna, Austria), in accordance with the manufacturer’s protocols. Briefly, an oligo-dT primer containing an Illumina-compatible sequence at its 5’ end was hybridized to the RNA (500 ng), and reverse transcription was performed. After degradation of the RNA template, second-strand synthesis was initiated using a random primer containing an Illumina-compatible linker sequence at its 5’ end. Next, the double-stranded library was purified using magnetic beads to remove the reaction components. In addition, the library was amplified to add complete adapter sequences required for cluster generation. Finally, the finished library was purified from the polymerase chain reaction (PCR) components and high-throughput sequencing was performed as single-end 75 sequencing using the Next Seq 500 (Illumina, San Diego CA, USA). Finally, gene expression data were verified via Excel-based differentially expressed gene analysis. Differentially expressed genes (DEGs) were analyzed using the Gene Ontology (GO) and Kyoto Encyclopedia of Genes and Genomes (KEGG) Mapper using the Database for Annotation, Visualization, and Integrated Discovery.
After OTA treatment, IPEC-J2 cells grown on gelatin-coated glass coverslips were fixed with 4% paraformaldehyde. Next, cells were incubated with the blocking buffer. Following this, the cells were probed overnight with an antibody against zonula occludens-1 (ZO-1, 1:200, Thermo Fisher Scientific) diluted with antibody buffer at 4°C. After washing, the cells were incubated for 1 h with the secondary antibody, i.e., anti-rabbit IgG (Alexa Fluor 488) at dark room temperature. Finally, the cells were mounted using VECTASHIELD Antifade Mounting Medium with 4’, 6-diamidino-2-phenylindole (DAPI). Images were captured using a fluorescence microscope.
For western blotting, OTA-treated cells were washed with phosphate-buffered saline (PBS) and lysed in 1x lysis buffer, followed by centrifugation for 10 min at 14,000×g and 4°C. The extracted protein was collected and protein concentration was analyzed using the Pierce BCA Protein Assay Kit. Following this, the protein sample was denatured in 2× Laemmli buffer (4% sodium dodecyl sulfate, 10% 2-mercaptoethanol, 20% glycerol, 0.004% bromophenol blue, and 0.125 M Tris-HCl) (1:1) at 95°C for 5 min. Proteins were separated by electrophoresis on a 9% sodium dodecyl sulfate–polyacrylamide gel electrophoresis (SDS-PAGE) gel (1 h at 150 V) and transferred onto polyvinylidene fluoride membranes (Thermo Fisher Scientific). The membranes were washed with Tris-buffered saline with Tween 20 (TBST, 20 mM Tris, pH 7.5, 150 mM NaCl, and 0.1% Tween 20) and then blocked for 1 h in blocking buffer (5% skim milk). After blocking, the membranes were incubated overnight with the primary antibody (ZO-1, 1:2000, Thermo Scientific) and (sc-47778, beta-actin antibody, 1:2000, Santa Cruz Biotechnology, Dallas, TX, USA) diluted in 5% skim milk at 4°C. After overnight incubation, the membrane was washed with TBST (thrice) and incubated with a secondary antibody for 1 h at room temperature. Protein bands were visualized with enhanced chemiluminescence western blot substrate and imaged using the ChemiDoc imaging system.
To evaluate mRNA expression, qRT-PCR was performed. Initially, total RNA (1 μg) reverse transcribed into cDNA using a DiaStar RT Kit. Primers for target genes were designed using Primer 3 (Table 1). The qRT-PCR was performed on a 7500 Fast Real-Time PCR System using the following conditions: 95°C for 3 min, 40 cycles of 95°C for 15 s, 56°C–59°C for 15 s, and 72°C for 15 s. Target gene expression was normalized against that of glyceraldehyde-3-phosphate dehydrogenase (GAPDH), a housekeeping gene. Relative expression was calculated using the 2−ΔΔCT method: ΔCt = Cq (treated) − Cq (control) and Δ Δ Ct = ΔCt (treated) − ΔCt (control) [22].
All experiments were conducted independently in triplicate. Significant differences between treatments was measured using a general linear model (PROC-GLM) procedure in SAS. Cell viability data, PCR, and western blotting data were analyzed using a general linear model and t-test, respectively. Significance was set at p < 0.05.
RESULTS
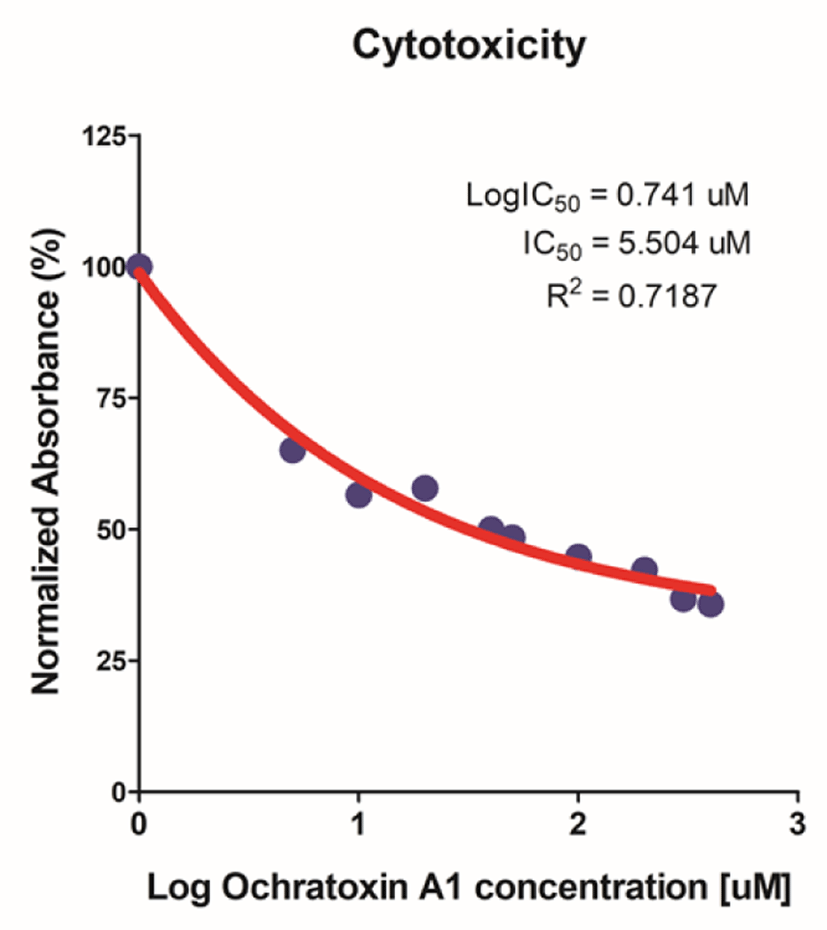
To confirm the cytotoxic effect of OTA on IPEC-J2 cells, a cell viability assay was conducted (WST-1 assay). As cells were exposed to varying concentrations of OTA (0–40 μM), cell viability decreased in a concentration-dependent manner (Fig. 1). The IC50 value of OTA for IPEC-J2 (48 h treatment) was 5.504 μM. However, the IC50 value was 5.504 μM, but we selected OTA 4 μM for further experiments.
Based on the cytotoxicity results, 4 μM OTA for 48 h was selected as the inhibitory concentration for subsequent experiments. We performed gene expression profiling to identify DEGs with or without OTA treatment in small intestinal epithelial cells and found that of 1678 DEGs, 782 were upregulated and 896 were downregulated (Fig. 2A).
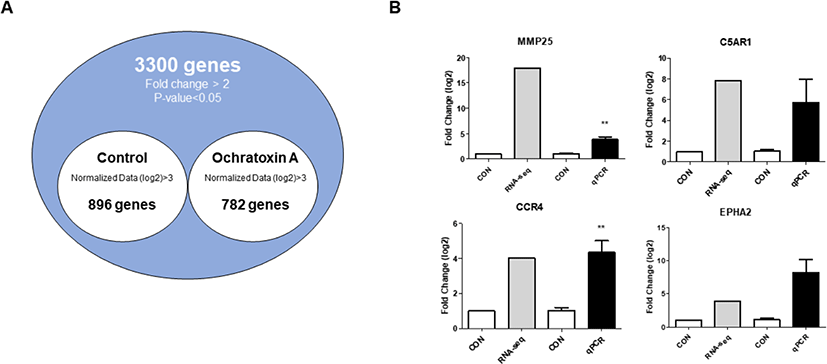
To verify the expression of DEGs, we examined the expression of the top four genes via qRT-PCR in IPEC-J2 cells with or without OTA treatment using RNA seq (Fig. 2B). The results show that MMP25 (p < 0.01) and CCR4 (p < 0.01) were upregulated, and there was no statistical difference between C5AR1 and EPHA2 compared to the control (Fig. 2B).
Additionally, 782 upregulated DEGs were subjected to GO analysis, including 27 that code for biological processes, four cellular components, and six molecular functions (Fig. 3A). The “biological process” category involved “positive regulation of transcription from RNA polymerase II promoter,” “small guanosine triphosphatases (GTPase) mediated signal transduction,” “positive regulation of cell proliferation,” “inflammatory response,” “defense response to Gram-positive bacterium,” “blood coagulation,” “response to peptidoglycan,” and “positive regulation of mast cell cytokine production.” Genes classified as “cellular components” were related to the “extracellular region,” “nuclear nucleosome,” “nucleosome,” and “dendritic spine.” Furthermore, the majority of DEGs were related to calcium ions, GTP, pyridoxal phosphate binding and transporters, and nicotinamide adenine dinucleotide (NAD)(P)+-protein-arginine adenosine diphosphate (ADP)-rebosyltransferase activity.
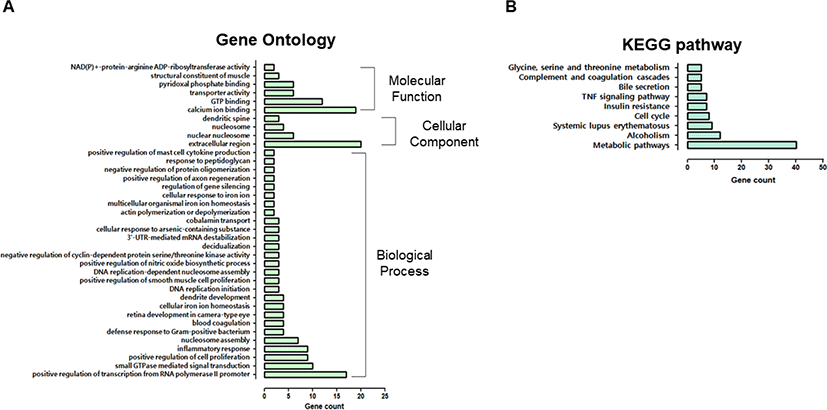
KEGG pathway analysis revealed that many DEGs were involved in metabolic, systemic lupus erythematosus, the cell cycle, insulin resistance, tumor necrosis factor (TNF) signaling, bile secretion, and complement and coagulation cascade pathways (Fig. 3B). The enrichment of GO or KEGG pathways was associated with the inflammatory response, defense response to gram-positive bacteria, response to peptidoglycan, and TNF signaling.
Next, 896 downregulated DEGs were registered for GO analysis, consisting of 28 biological processes, seven cellular components, and six molecular functions (Fig. 4A). Reduced DEGs within the “biological process” category were connected through “negative regulation of cell proliferation,” “defense response to a virus,” “proteolysis,” “negative regulation of viral genome replication,” “response to lipopolysaccharides,” “wound healing,” the “T cell receptor signaling pathway,” “antibacterial humoral response,” “positive regulation of cell-cell adhesion,” “T cell costimulation,” and “cellular response to type I interferon.” Additionally, we identified that DEGs classified as “integral component of the plasma membrane,” “extracellular space,” “extracellular region,” and “proteinaceous extracellular matrix,” were expressed at low levels and further worked weakly in terms of “calcium ion binding,” “serine-type endopeptidase inhibitor activity, and “cysteine type endopeptidase inhibitor activity involved in the apoptotic process.”
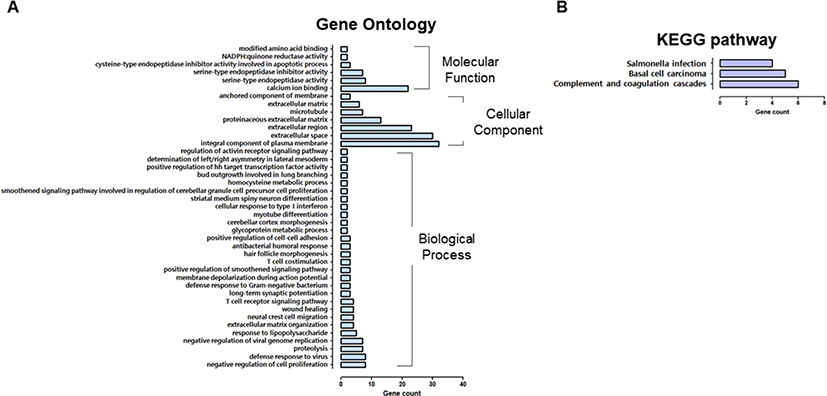
Compared with the control, KEGG pathway analysis revealed fewer “salmonella infections, complement, and coagulation cascades,” and “basal cell carcinoma” (Fig. 4B).
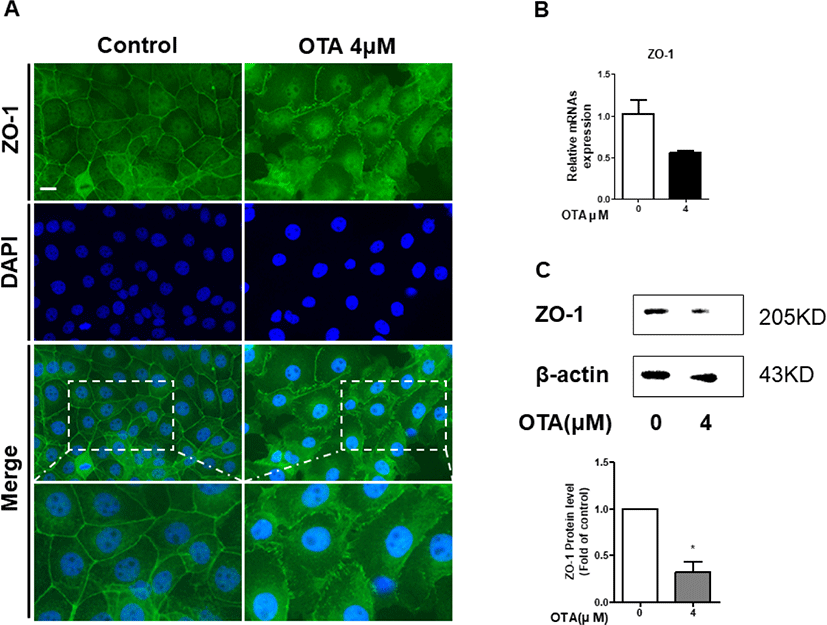
It was confirmed through GO analysis that the positive regulation of cell-cell adhesion was downregulated. We hypothesized that this would affect tight junction proteins (TJPs). Therefore, we measured ZO-1 expression using immunocytochemistry, RT-qPCR, and western blotting in IPEC-J2 cells to evaluate whether OTA exposure alters TJPs. As expected, the immunocytochemistry results showed that the contour of ZO-1 treated with 4 μM OTA for 48h was significantly disrupted compared to the control (Fig. 5A). Moreover, treatment of IPEC-J2 cells with OTA for 48 h hindered the mRNA expression of ZO-1 (Fig. 5B). OTA treatment significantly degraded the ZO-1 protein (Fig. 5C). Although ZO-1 was not expressed in the RNA-seq results, these results suggest that OTA aggravated intestinal barrier function in small intestinal epithelial cells.
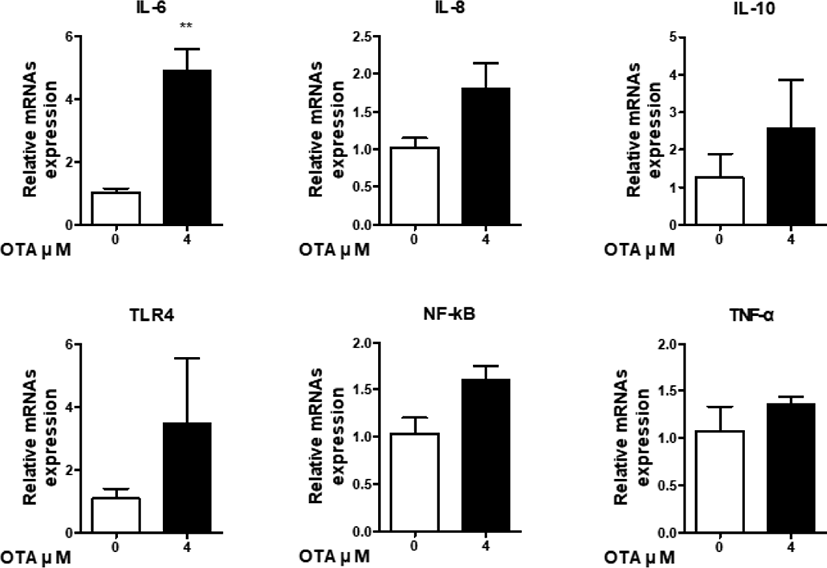
GO analysis showed that OTA upregulates the “inflammatory response.” Therefore, we determined the effects of OTA exposure on the intestinal immune system by inspecting the expression of immune genes. Six genes (IL-6, IL-8, IL-10, TLR4, TNF-α, and NF-kB) were detected using RT-qPCR to determine immunocyte expression levels. The RNA-seq results show increases in IL-6 and NF-kB expression, decreases in TLR4 and IL-8 expression, and no expression at all of IL-10 or TNF-α. In response to 48 h of 4 μM OTA treatment, the expression of cytokines (TNF-α, IL-6, and IL-10), chemokines (IL-8), toll-like receptors (TLR-4), and signaling transcription factors (NF-kB) in IPEC-J2 cells was determined using RT-qPCR (Fig. 6). Additionally, the mRNA levels of cytokines (TNF-α, IL-6, and IL-10) were higher than those in the control group. Furthermore, upregulation of IL-8 was observed after OTA treatment. Additionally, relative TLR-4 and NF-kB mRNA levels were slightly higher than those of the control. Although the RT-qPCR and RNA-seq results were different, they suggest that OTA induces the activation of the immune system in IPEC-J2 cells via diverse inflammatory-related genes.
DISCUSSION
OTA is a mycotoxin that especially affects pigs and has multiple health risks, such as reduction in feed intake, slowing of growth, and immunotoxicity, all leading to economic loss [1–5,23]. The small intestine is the first site of absorbtion of harmful chemicals, and it is therefore particularly vulnerable to external stressors, including OTA. Previous studies have shown that OTA exposure affects multiple pathways in the small intestine, including ROS/Ca2+ production, intestinal epithelial barrier dysfunction, and apoptosis, through molecular changes to myosin light-chain kinase (MLCK), TJPs, and inflammatory cytokines [11–14,16,17,24–26]. Nevertheless, OTA-induced molecular changes remain unclear.
First, we examined the cytotoxicity of various OTA doses in IPEC-J2 cells (Fig. 1). IC50 value of 5.504 μM was confirmed through WST-1 assay. The concentration of 5 μM is the closest in the OTA cell viability that was performed. However, in the cell viability analysis, there was no statistical difference between 4 μM and 5 μM, so the further experiment was performed at 4 μM. We then identified 782 upregulated and 896 downregulated DEGs using gene expression profiling (Fig. 2A). Additionally, we analyzed the GO and KEGG pathways of DEGs, which showed that these DEGs regulated the inflammatory response, defensive response to gram-positive and gram-negative bacteria, TNF signaling, pathogen responses, and positive regulation of cell-cell adhesion. Thus, we surmised that OTA treatment of IPEC-J2 cells was related to inflammatory responses, immunocytes and cytokines, response to pathogens, and cell adhesion.
The main functions of the small intestine are nutrient absorption and intestinal defence. Furthermore, the small intestinal epithelium acts as a defense against the passage of harmful pathogens via cell-cell adhesion, where tight junction proteins of the epithelial cells form a barrier by recruiting proteins associated with the regulation of cell migration, proliferation, and differentiation. However, if the pathogen induces small intestinal dysfunction, TJP in the small intestinal epithelium is damaged by pathogen-mediated imbalance and inflammation-mediated barrier disorders. In summary, the intestinal epithelium is imbalanced by external stressors, leading to changes in TJPs that inhibit their main function. [12,20,24,27–30]. According to gene expression profiling analysis, OTA treatment induced changes in gene expression related to cell-cell adhesion and cell proliferation. Our results show that after OTA treatment, ZO-1 expression levels decreased in intestinal epithelial cells, suggesting that OTA lowers barrier function in the small intestine.
Based on gene expression profiling, we ascertained that OTA treatment altered the inflammatory response, leukocyte and cytokine-mediated immune processes, defense response to various pathogens, and TNF and T cell receptor signaling pathways. Furthermore, when a pathogen invades, the immune system increases cytokine production, pattern recognition receptor (PRR) activation, and expression of various cell signaling pathways [31–33]. These reactions serve as the first defense mechanism in the body and it eliminates pathogens by activating the immune system [34]. PRR recognizes pathogen-associated molecular patterns and regulates the transcription of genes associated with the inflammatory response, including pro-inflammatory cytokines, chemokines, anti-inflammatory cytokines, and transcription factors. Regulated cytokines cooperate with cell-cell interactions in the immune system, such as those including B and T cells, neutrophils, basophils, eosinophils, and macrophages [35,36]. When these immune cells are activated, PRR induces NF-kB expression, a transcription factor that regulates the expression of genes associated with innate and adaptive immunity, inflammation, proliferation, apoptosis, and cancer progression [37–39]. Thus, we confirmed that OTA treatment activated the immune system in the small intestine by increasing IL-6 levels in IPEC-J2 cells.
This study is the first to analyze gene expression profiling in pig intestine epithelial cells treated with OTA. Overall, we identified 782 upregulated and 896 downregulated DEGs. This suggests that OTA exerts harmful effects by altering molecular mechanisms in the intestinal epithelium. Furthermore, GO analysis showed that OTA was associated with intestinal dysfunction, inflammation, and the production of immune-related cytokines. Conclusionvely, these results may helpful in understanding the molecular alteration in the porcine intestine against mycotoxins.


