INTRODUCTION
The odor emitted from swine farms is a serious problem for nearby residents and hinders the development of the swine industry [1]. Odor can also have a significant im-pact on human health and quality of life [2]. The operational conditions such as com-posting facility aeration process, sealing level, emission source identification, gas emission treatment and collection are considered as the form of basic swine odor management [3]. In addition, pertinent management of livestock manure composting can help minimizing the effects of odors, although odors cannot be completely avoided [4].
It is also very important to understand the chemical composition of the odor and the concentration of the odorous substances. Ammonia and sulfuric compounds are the representative livestock odor substances found in previous studies [5], but the composition of odor-forming substances is not simple [5,6]. Analyzing individual substances that make up complex compounds can greatly contribute to finding causes of odor and ways to reduce odor [7].
Until now, studies conducted to reduce the odor released from swine farms have focused on remodeling swine farm facilities, application of odor reducing substances such as deodorants, and identification of odor causing substances [8]. Although various techniques have been tried to reduce odor emitted from swine houses, there is no pertinent odor control method suggested to meet efficiency, economics and safety. Biofiltration methods such as biofilter, bioscrubber and biotrickling filter are proven efficient to reduce odor emission in pig building by many researchers [9]. However, they can be difficult to operate and more expensive than other odor reduction strategies in terms of construction cost. The chemical methods using many different oxidizing agents like ozone are also effective in reducing malodors in pig building, but these have relatively short periods’ effectiveness and can be potentially toxic to farmers and pigs if applied excessively [10]. However, these methods can be suitable as countermeasures after the occurrence of odors.
The swine manure is the principal cause of odor derived from swine farms [11]. In addition, main factor affecting the composition of swine manure was reported to be the feed [12]. Previous research has shown that amino acid supplementation in feed affects odor intensity, ammonia release and swine manure properties such as PH, ammonia, nitrogen, sulfur, phenolic compounds and volatile fatty acid (VFA). Their results showed that supplementing crystal-line S-containing amino acid (AA) in surplus of the requirement increased odor emission (p < 0.001) and odor intensity (p < 0.05) and reduced odor hedonic tone (p < 0.05) from the air above the manure pits. To reduce odor from pig manure, dietary S-containing AA should be minimized to just meet the recommended requirements [13]. However, there are little information on the generation pattern of swine odor substance according to feed processing form and composition.
Therefore, the purpose of this study is to find a form of feed suitable for reducing odors by changing the processing mode and caloric value of feed that directly affects swine manure composition.
MATERIALS AND METHODS
The experimental procedure was approved by the Institutional Animal Care and Use Committee at Seoul National University of Science & Technology (approval No. : 2021-0002). The experimental period was between July and August in 2022. Three types of feed (A type: powder & general calorie feed, B type: pellet & general calorie feed, C type: pellet & low calorie feed) were evaluated in this study. Table 1 shows the general ingredient information for feed.
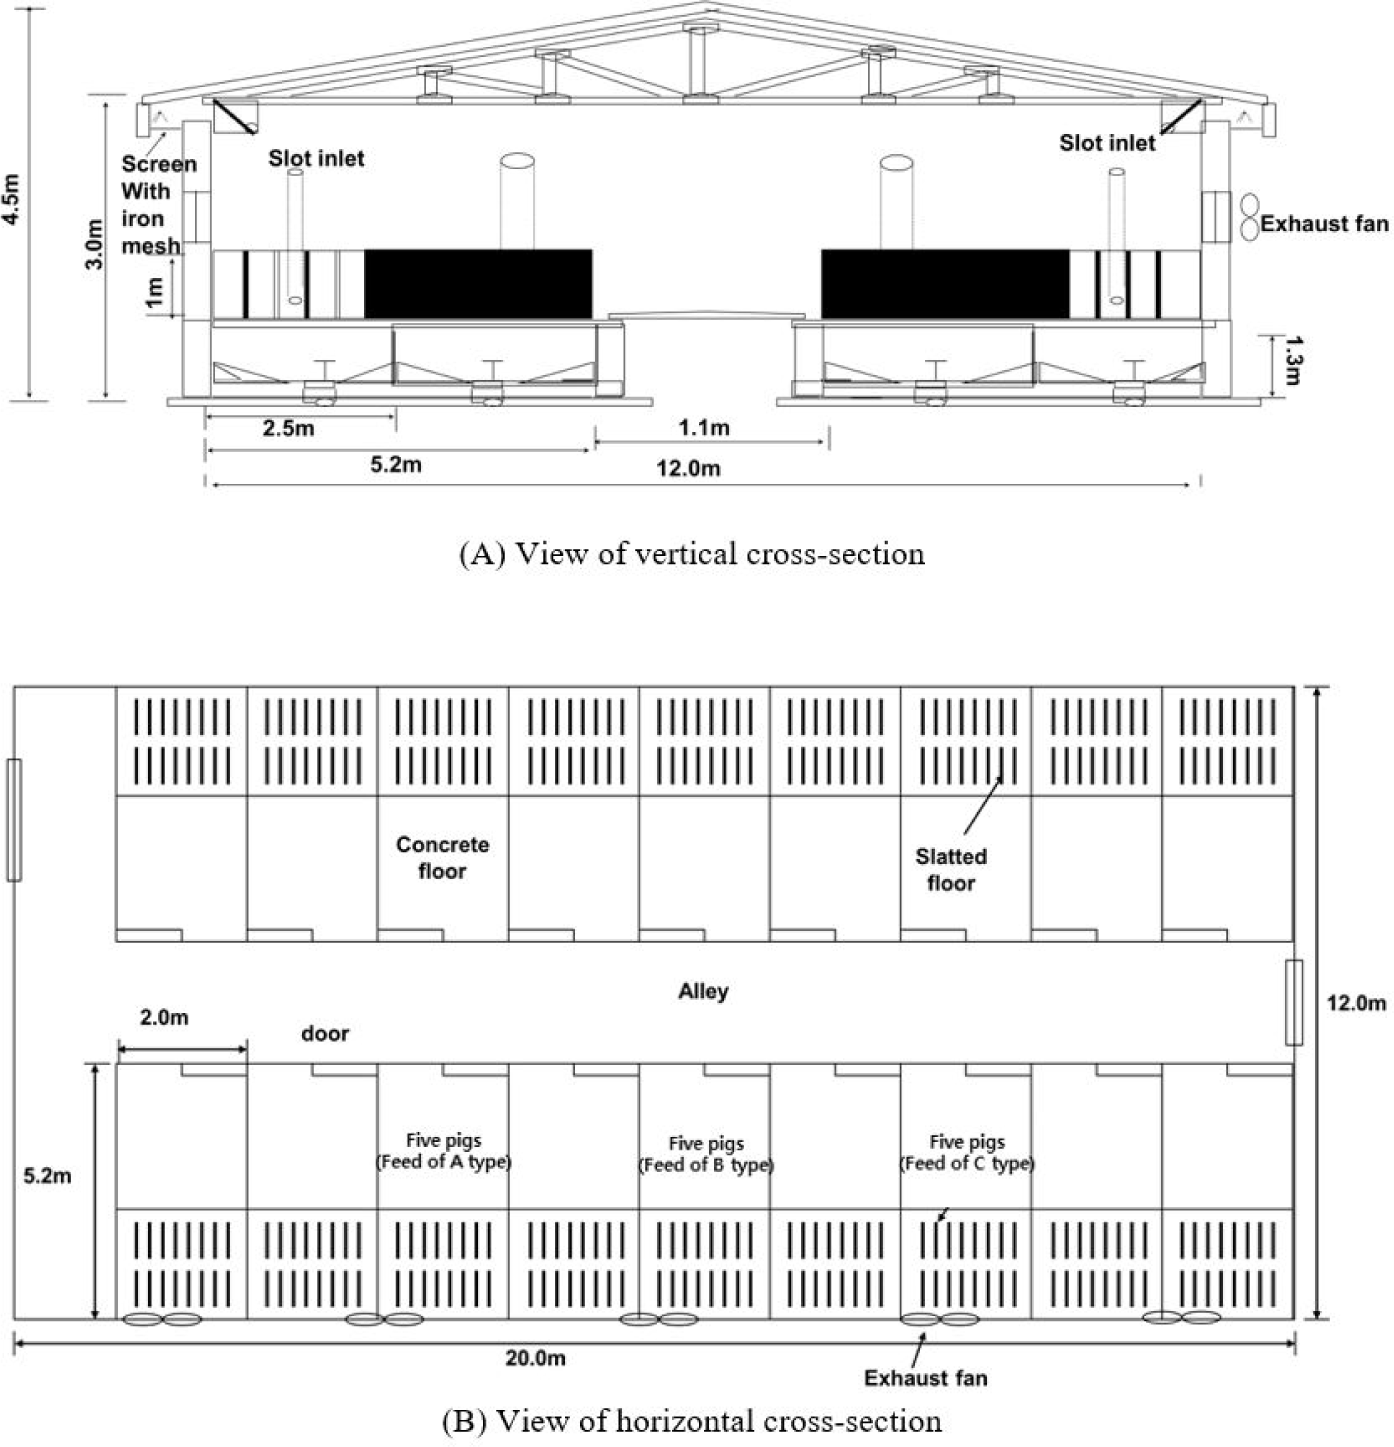
Experimental swine house (4.5 m × 12.0 m × 3.0 m) selected in this study was located at the National Institute of Animal Science, Korea. It had two pig housing rooms and 10 pens (L: 6.0 m × W: 5.2 m × H: 0.5 m) in each room installed with open partitions and constructed from galvanized steel spindles 3.7 cm apart, on either side of a 1.1m wide central alley. A 1.3 m deep manure pit was under a partially slatted and concrete floor with a pit surface area of 22.8 m2. Inside, the building was insulated with 0.8 mm steel plate and 50 mm styrofoam in the side walls and ceiling. The ventilation mode in the pig building is a negative pressure system equipped in the wall. The 70 cm-diameter wall exhaust fan in the compartment removed the stale air. Fundamentally, an automatic controller adjusted the wall ventilation rate based on the optimal room temperature (15°C–25°C) and relative humidity (40%–70%) for growing pig well. The layout of the experimental swine house is well described in Fig. 1.
Total fifteen crossbred (Landrace × Yorkshire × Duroc) growing pigs with the approximate average weight of 50 kg were housed and five pigs were placed shown in Fig. 1 to investigate the odor generation pattern according to three types of feed with different processing form. All the pigs were feeder-fed at 16% protein corn-soybean meal-based diet that satisfied the National Research Council (NRC) nutrient requirements. The feeders were manually filled once every two days. Pigs were given ad libitum access to feed and water supplied by a nipple.
One kg of swine manure collected from pit of three treatment pens was placed in a glass bottle and maintained at 25°C through a thermostat and air was sampled thrice every two weeks after the initial concentration measurement to evaluate the odor generation pattern during experimental period. The odorous air samples were collected in a 3L capacity Tedlar bag using portable air sampler (FIBOX, Odortech, Paju, Korea). Complex odors were analyzed by using human sense of smell according to the standard test protocol presented by the Korean Ministry of Environment. The concentration of ammonia and the sulfur-based substance (Hydrogen sulfide, Methyl mercaptan, Dimethyl sulfide, Dimethyl disulfide), which are the main substances of swine odor, were measured using a direct recording measuring device (BL-002, Baseline, SBENE, Incheon, Korea) connected to the Tedlar bag. The operation mode of the direct recording measuring device was continuous monitoring in seconds for 1 minute using the periodic measurement mode and the average of values measured for 1 minute was used as a representative value.
For qualitative analysis of swine manure odor substances, air samples were collected in a solid adsorption tube (Tenax TA tube, Carbograph1, Sigma-Aldrich, St. Louis, MO, USA) at a flow rate of 100 mL/min for 20 minutes. After condensing and adsorbing the collected air sample to 2 L each, thermal desorption (TD; APK, KNR, Namyangju, Korea)- gas chromatography (GC; 7820A, Agilent, Santa Clara, CA, USA)-mass spectrometry (MS; 5977E, Agilent) was used for detecting individual volatile organic compounds. Table 2 shows the detailed analysis conditions of TD-GC-MS.
RESULTS
The results of sensory evaluation for complex odor are shown in Fig. 2. In this data, a high air dilution ratio means a severe odor. In all types of feed, the highest air dilution ratio was found at the first sampling and it was very low at the second sampling. However, it tended to increase again at the third sampling.
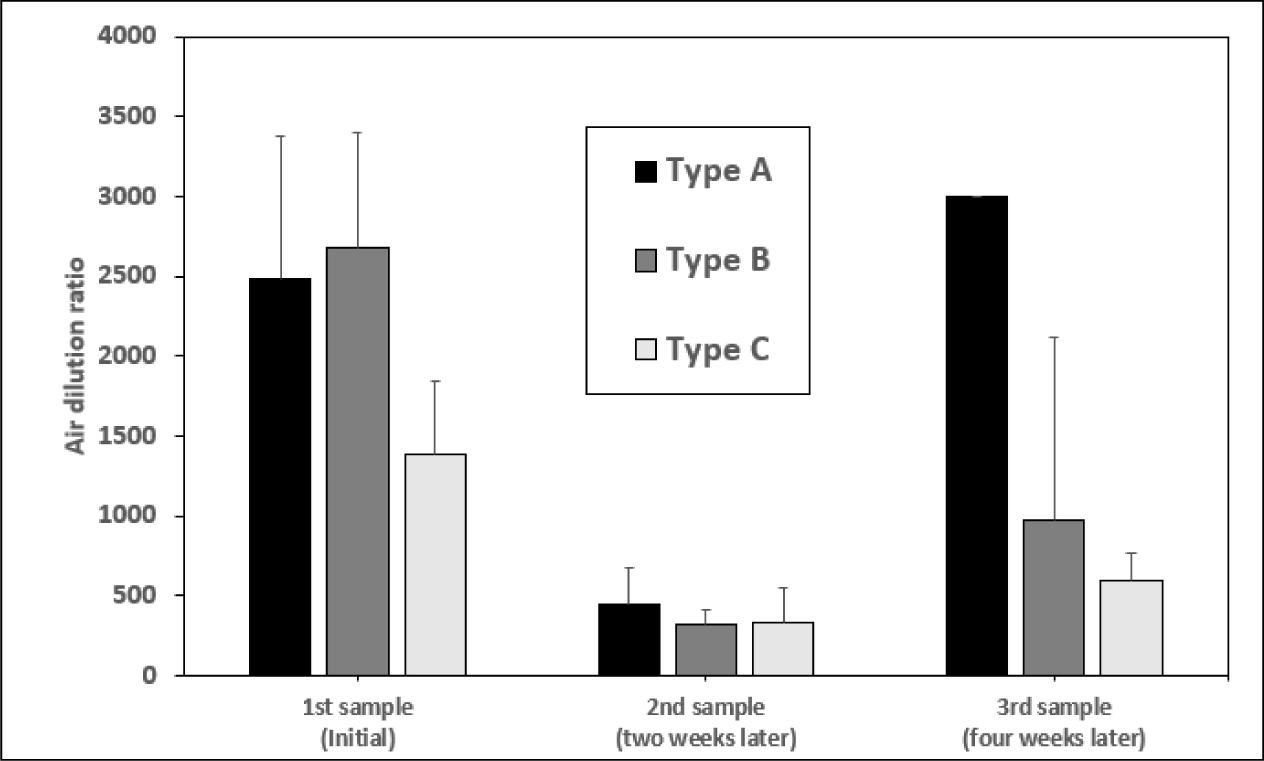
In case of type A feed, the air dilution ratio was measured at an average of 2,481 (± 890) when first sampled, but at the last sampling, it was measured at 3,000 (± 0) higher than the first, indicating that the odor became worse. For type B feed, the air dilution ratio was determined to be the highest at 2,678 (± 719) at the first sampling, but the odor decreased the most at the second sampling over time. And it was found that the odor increased when the last sample was collected four weeks later. For type C feed, the air dilution ratio was 1,386 (± 451) at the first sampling and 486 (± 217) at the second sampling, and the odor level decreased as time passed. However, the type C feed also showed an air dilution ratio of 595 (± 165) in the sampling after 4 weeks (third sampling), indicating that the odor level increased again.
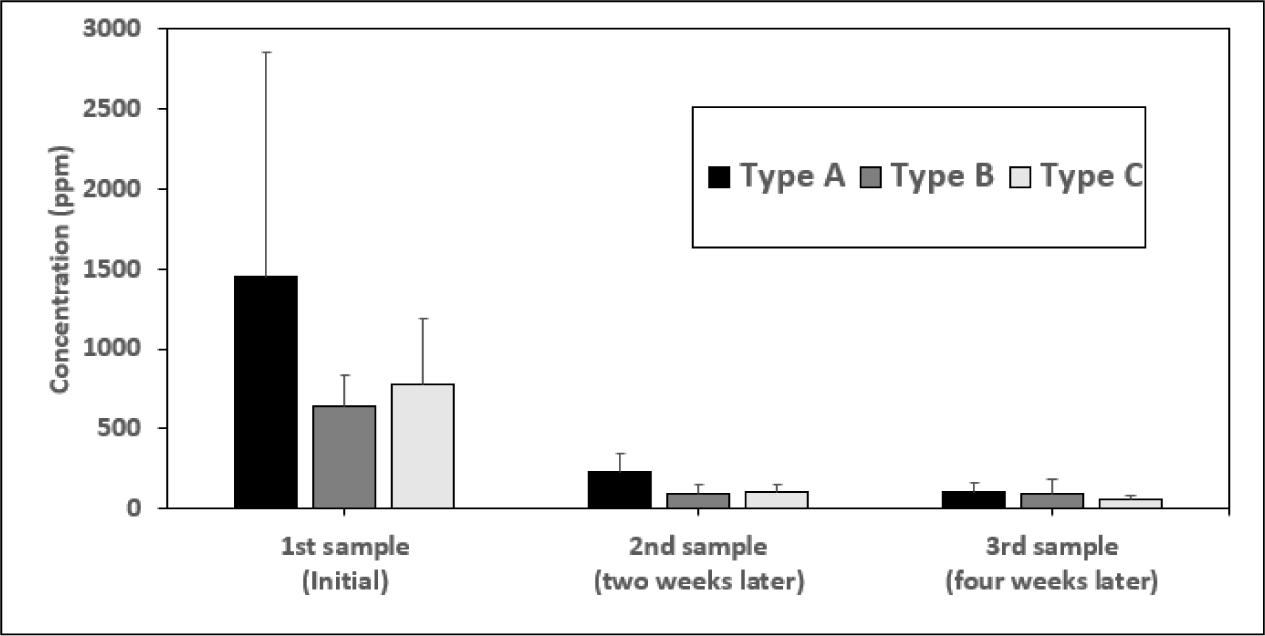
As shown in Fig. 3, ammonia concentration decreased over time in all types of feed. The Type A feed reduced ammonia concentration from 1,452 (± 1,395) ppm at the first sampling to 234 (± 115) ppm at the second sampling and 111 (± 48.6) ppm at the third sampling continuously. The type B feed decreased from 646 (± 188) ppm at the first sampling to 96 (± 54.3) ppm at the second sampling, but slightly increased to 100 (± 89.5) ppm at the third sampling. The type C feed showed a stable decrease in concentration from 780 (± 413) ppm to the last 60 (± 21.7) ppm.
At the first sampling, all substances (methyl mercaptan [MM], dimethyl sulfide [DMS], dimethyl disulfide [DMDS]) except H2S were below the detection limit or the quantitative limit. Hydrogen sulfide was measured at a level of 3.26 to 3.72 ppm in all samples regardless of feed type. In the case of the second sampling, 1.29 ppm of DMDS was detected in swine manure sample No. 1 among Type A feeds, and 0.18 ppm of DMS was detected in swine manure sample No. 2. In addition, 0.22 ppm of MM and 0.70 ppm of DMS were detected in the manure sample No. 3. H2S was detected at 0.27 ppm in the 12th odor sample of Type C feed. And all the rest of swine manure samples were below the detection limit or below the quantitative limit. The third sampling was analyzed below the quantitative limit in all samples (refer to Table 3).
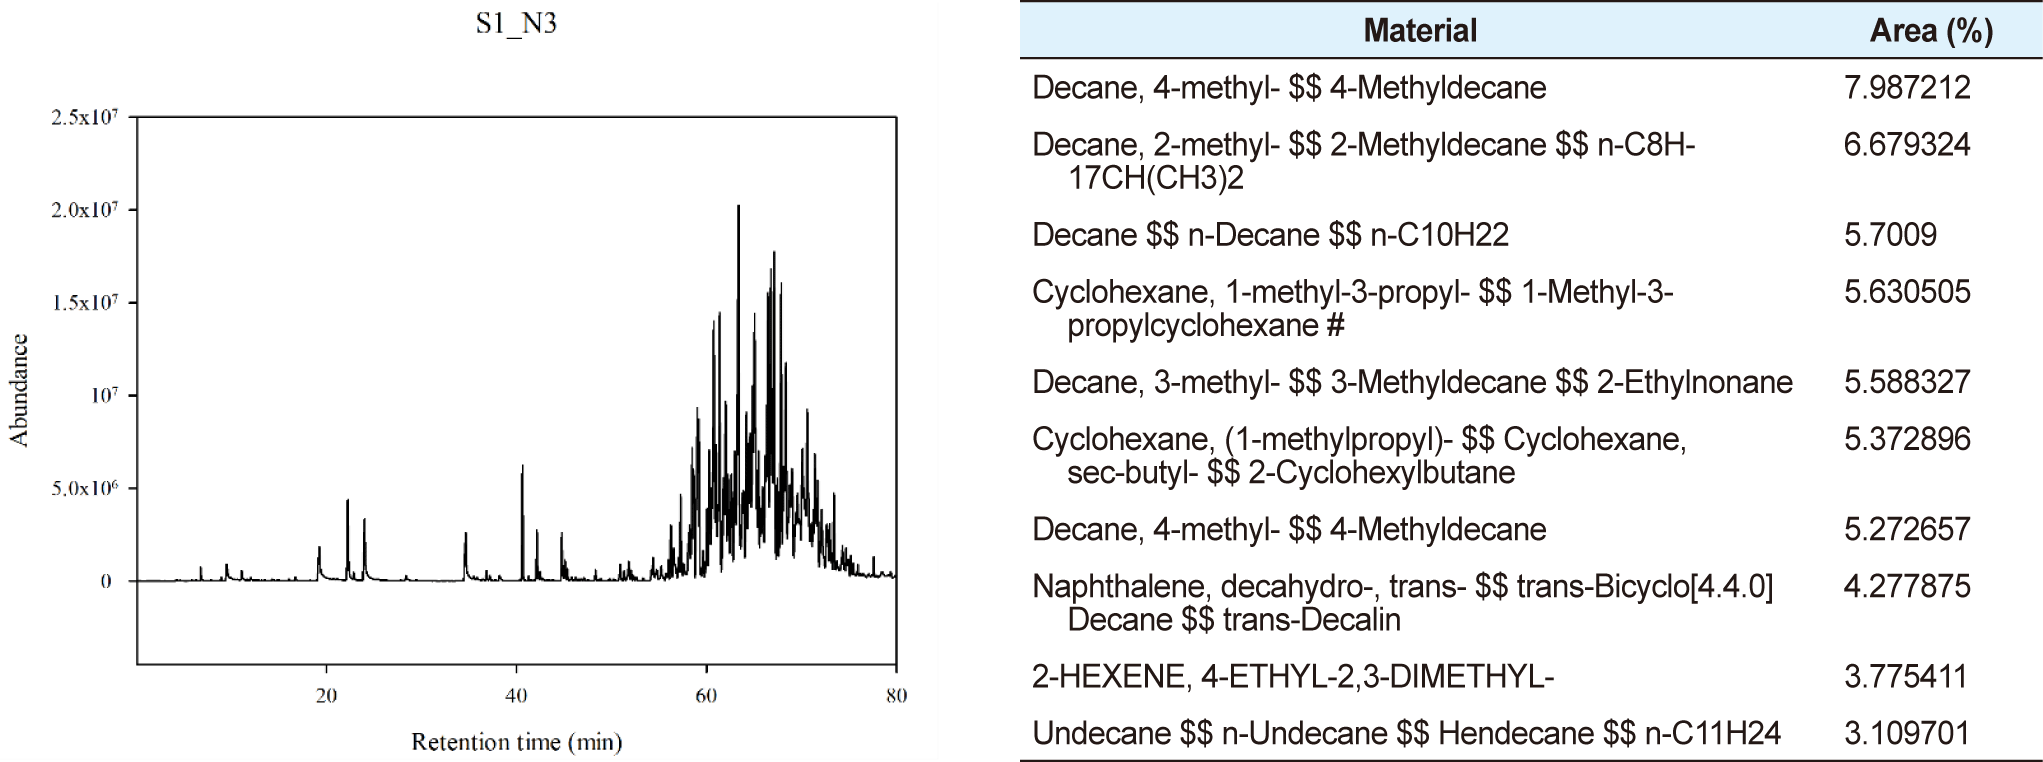
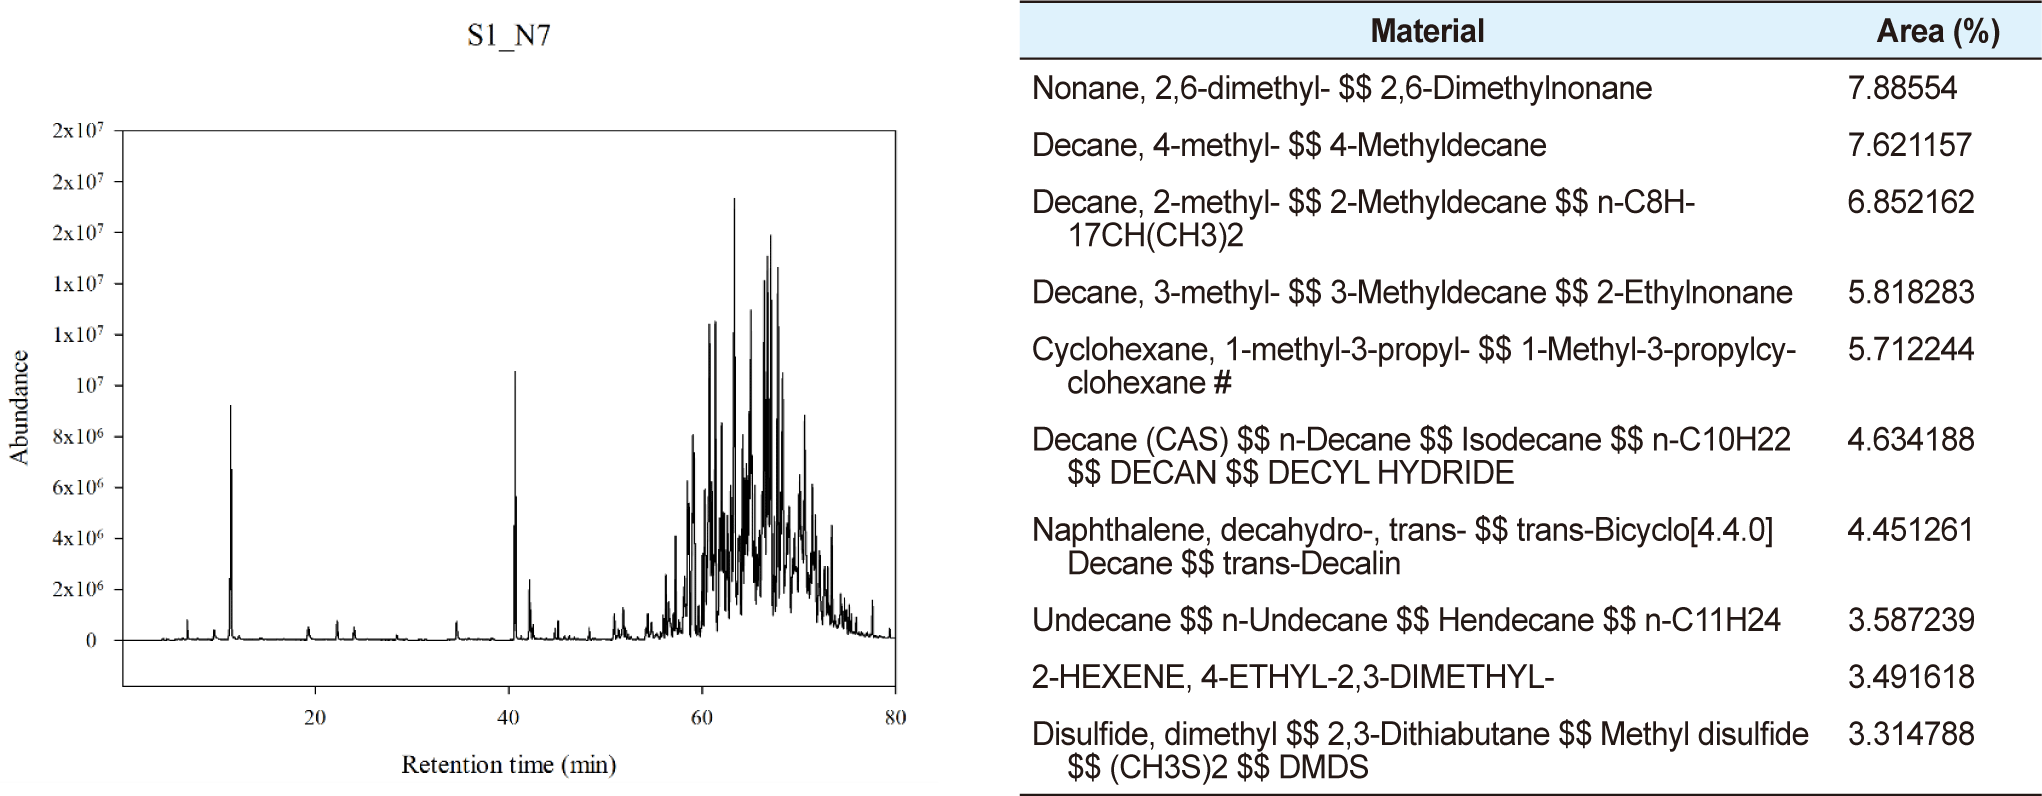
Figs. 4 to 12 show representative VOCs for each feed type detected through qualitative analysis. The major VOCs were analyzed by sorting the materials in the order of areas, and all chromatograms had the same abundance range for mutual comparison. At the first sample, Decane (n-Decane, 2-Methylldecane, 3-Methylldecane, 4-Methylldecane, 5-Methylldecane, etc.), 2, 6-Dimethylnonane, and 1-Methyl-3-propylcyclohexane were commonly detected as shown in Figs. 4, 5, and 6.
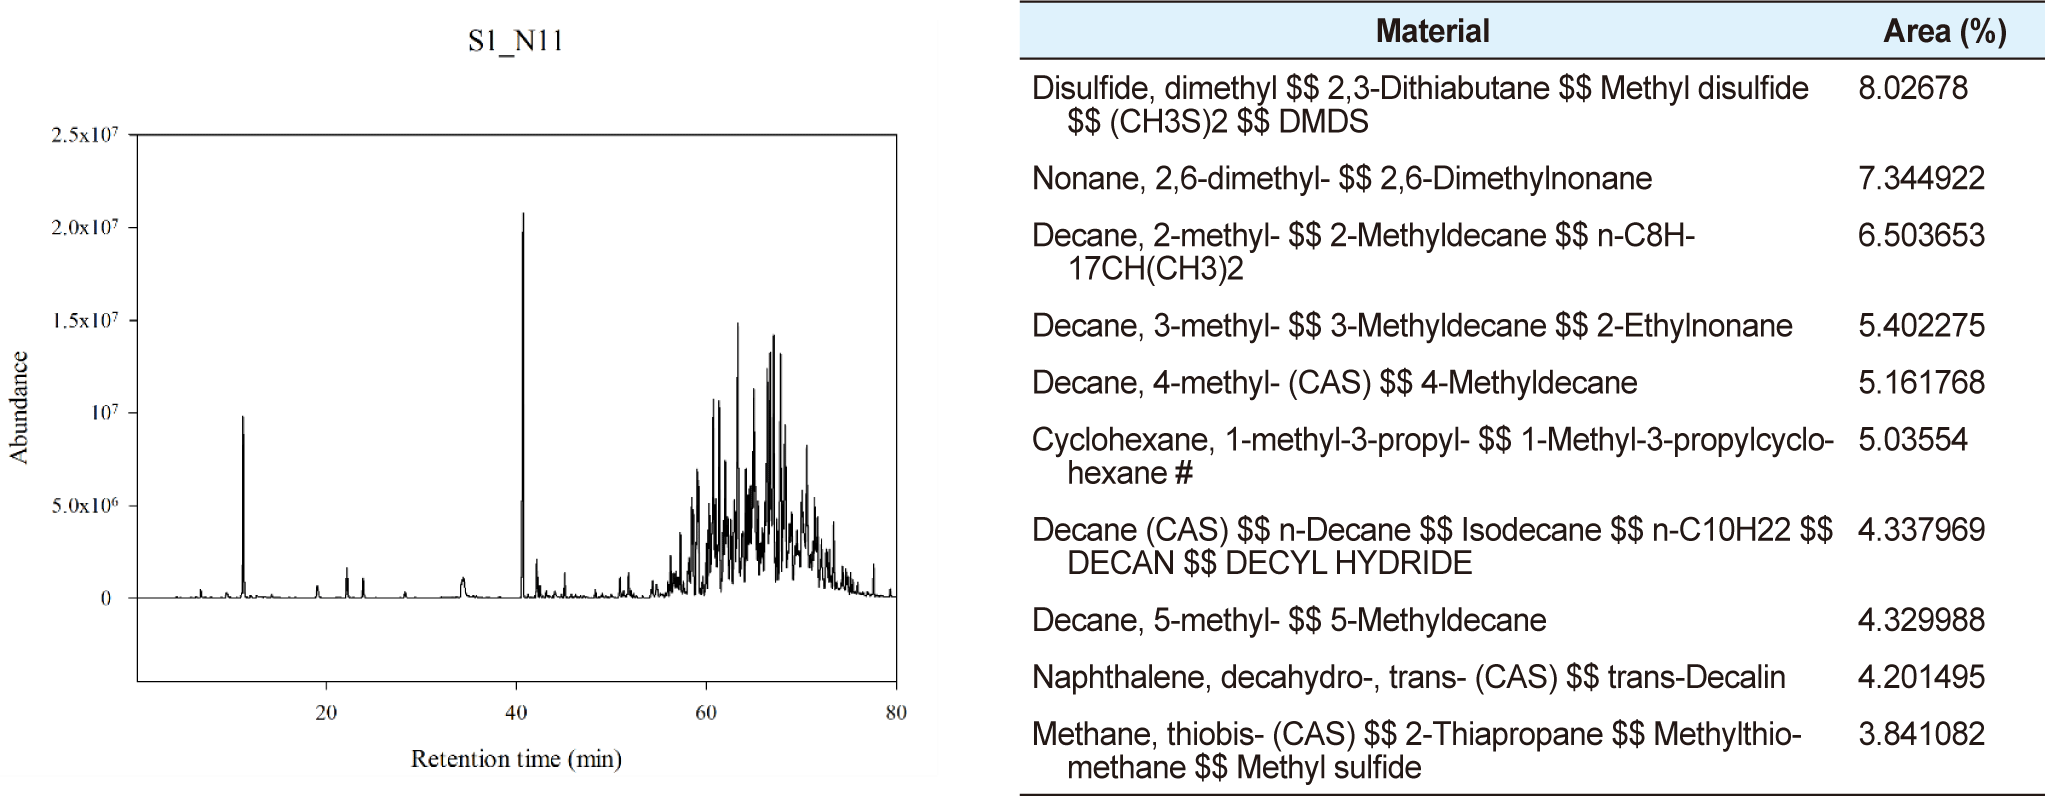
At the second sample of type A feed, Decane (n-Decane, 2-Methyldecane, 3-Methyldecane, 4-Methyldecane, 5-Methyldecane, etc.), and methyl disulfide were ana-lyzed as the main components of VOCs. Overall the Decane accounted for most of the top areas of type A feed as shown in Fig. 7.
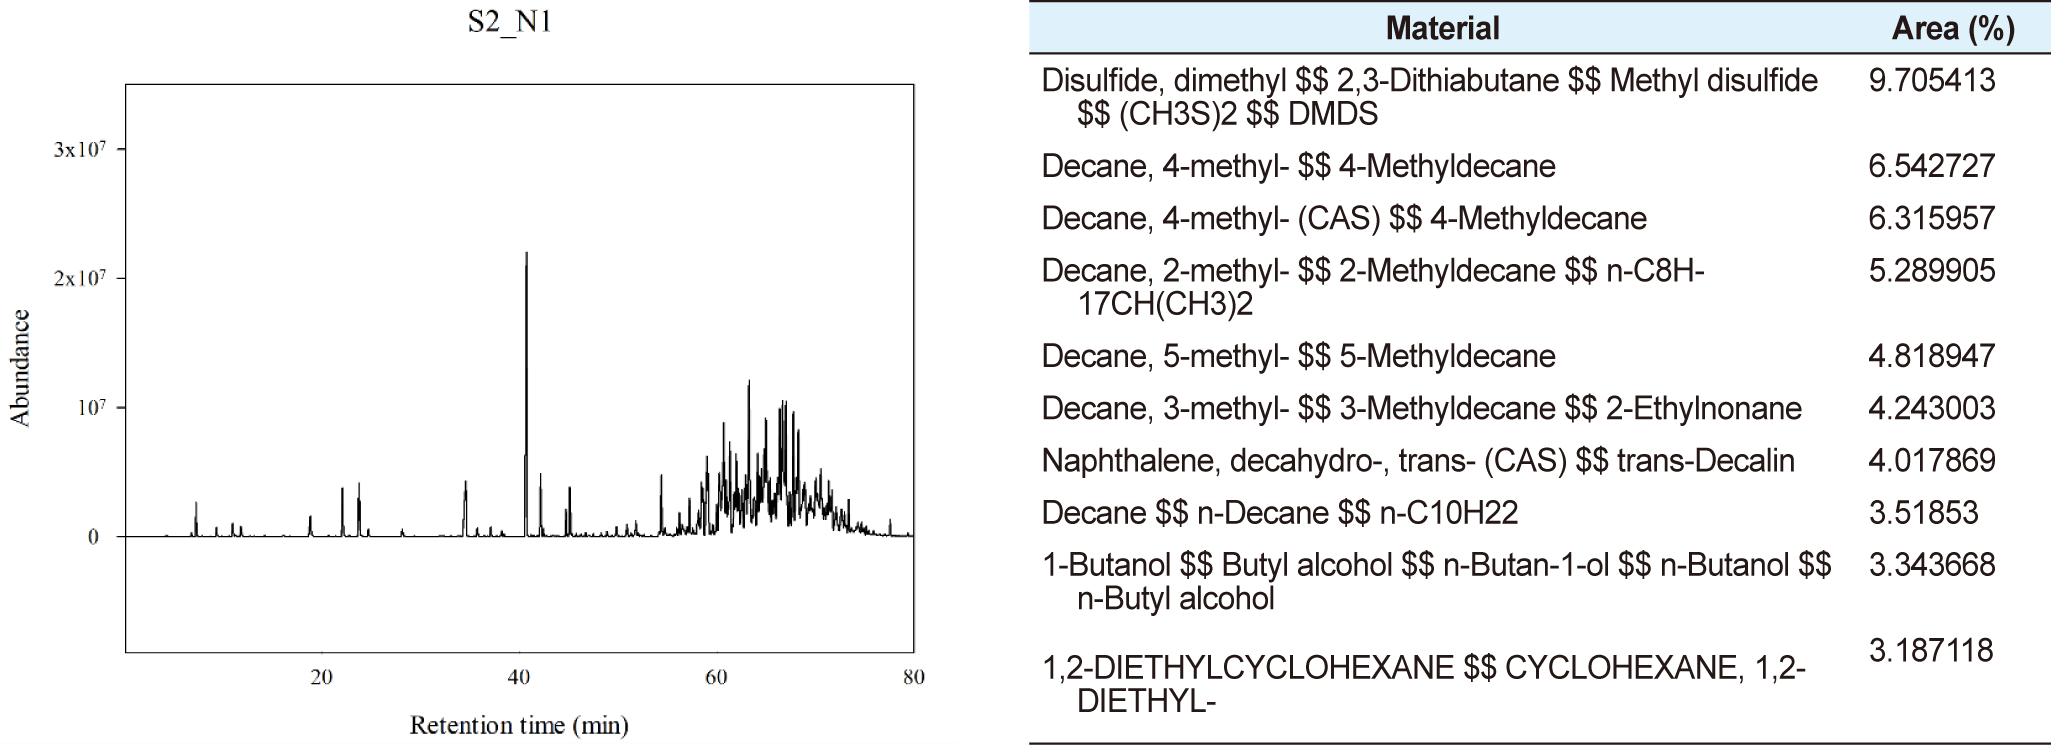
In case of type B feed, components such as Decane (n-Decane, 2-Methyldecane, 3-Methyldecane, 4-Methyldecane, 5-Methyldecane, etc.), n-Undecane, methyl disulfide, and Dimethylsiloxane cyclic trimer were analyzed as major VOCs. Overall about half of the top areas were Decane and the other half were other substances as shown in Fig. 8.
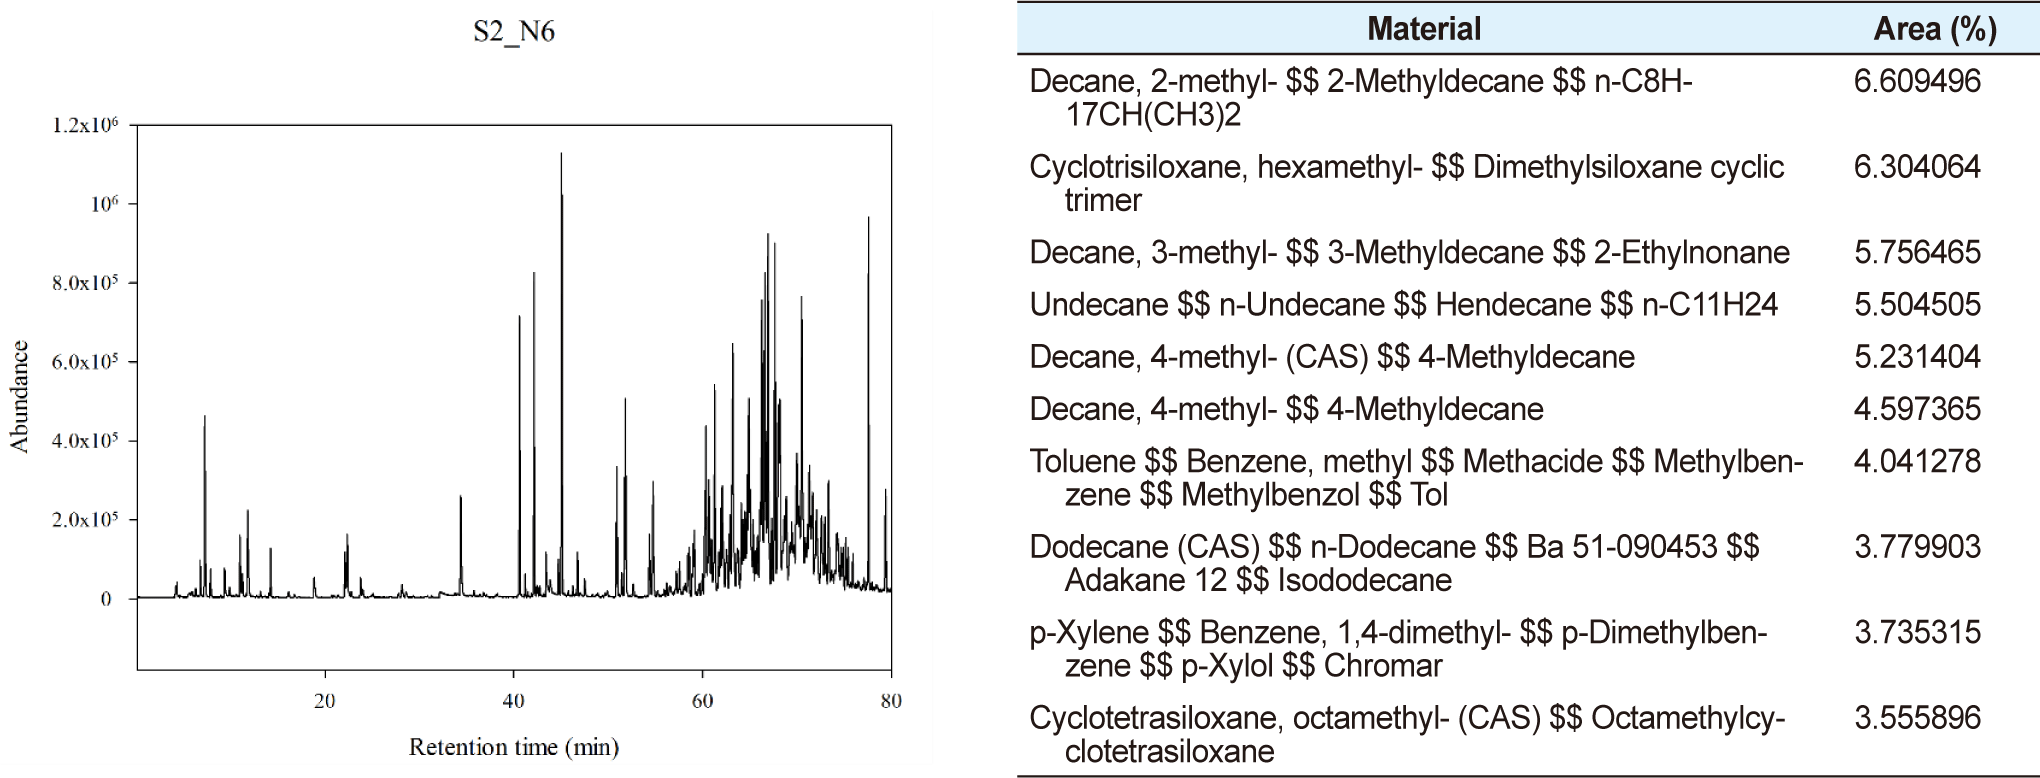
In case of Type C feed, the top three materials in the area were composed of only the four substances listed above and the substances were the main VOCs as shown in Fig. 9.
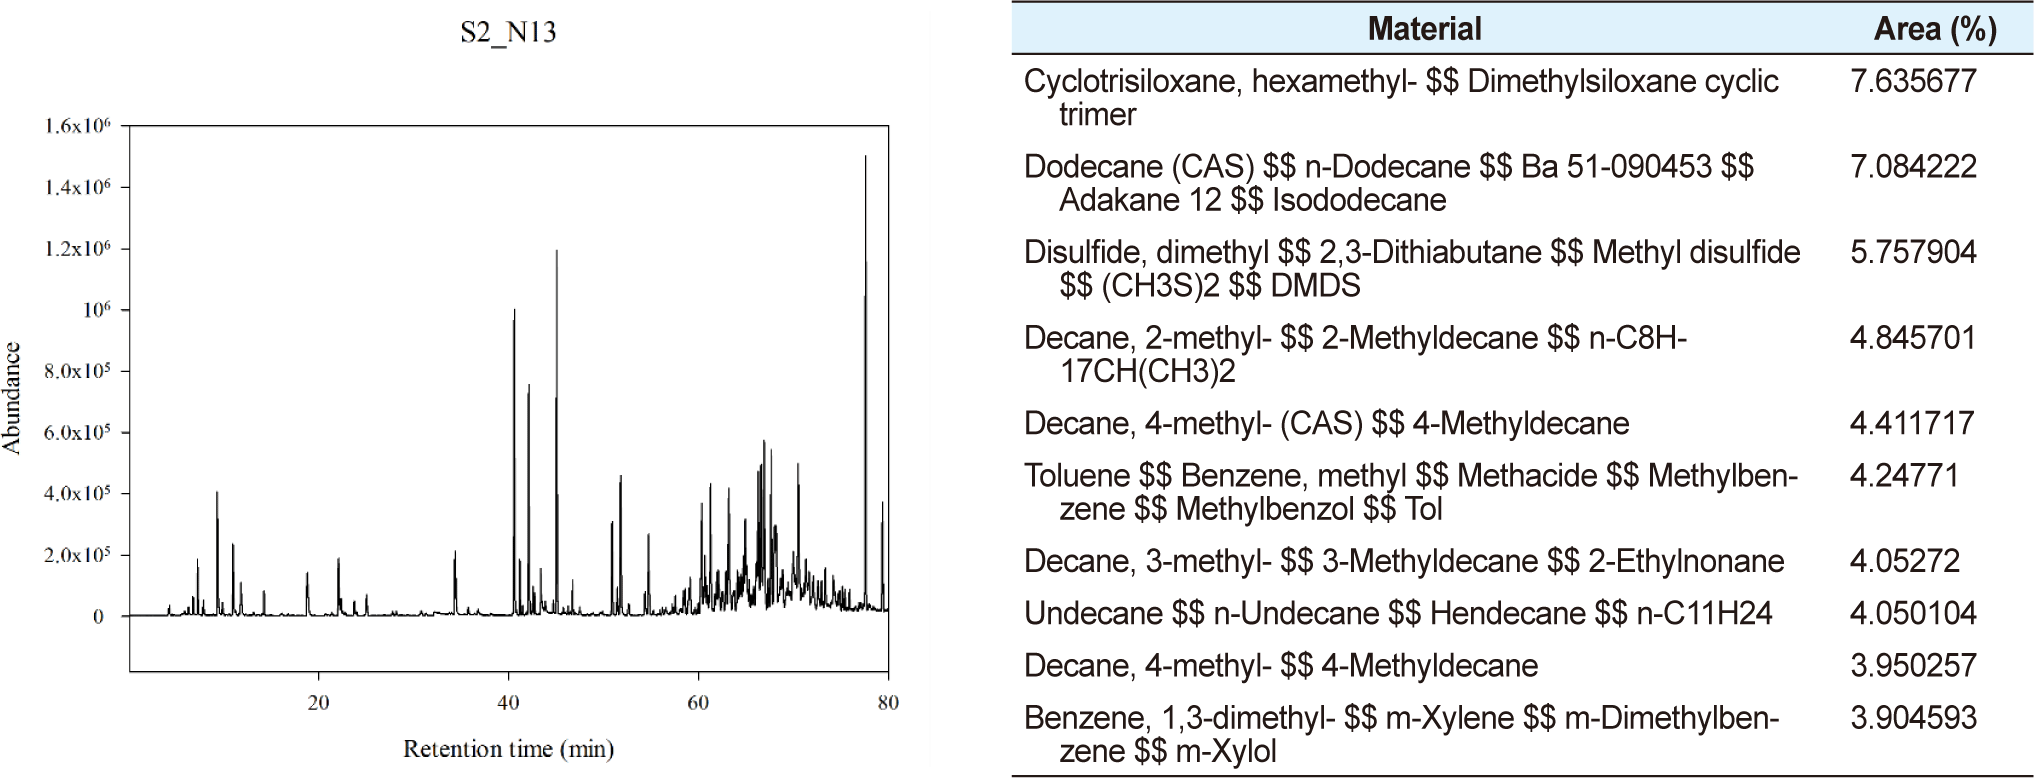
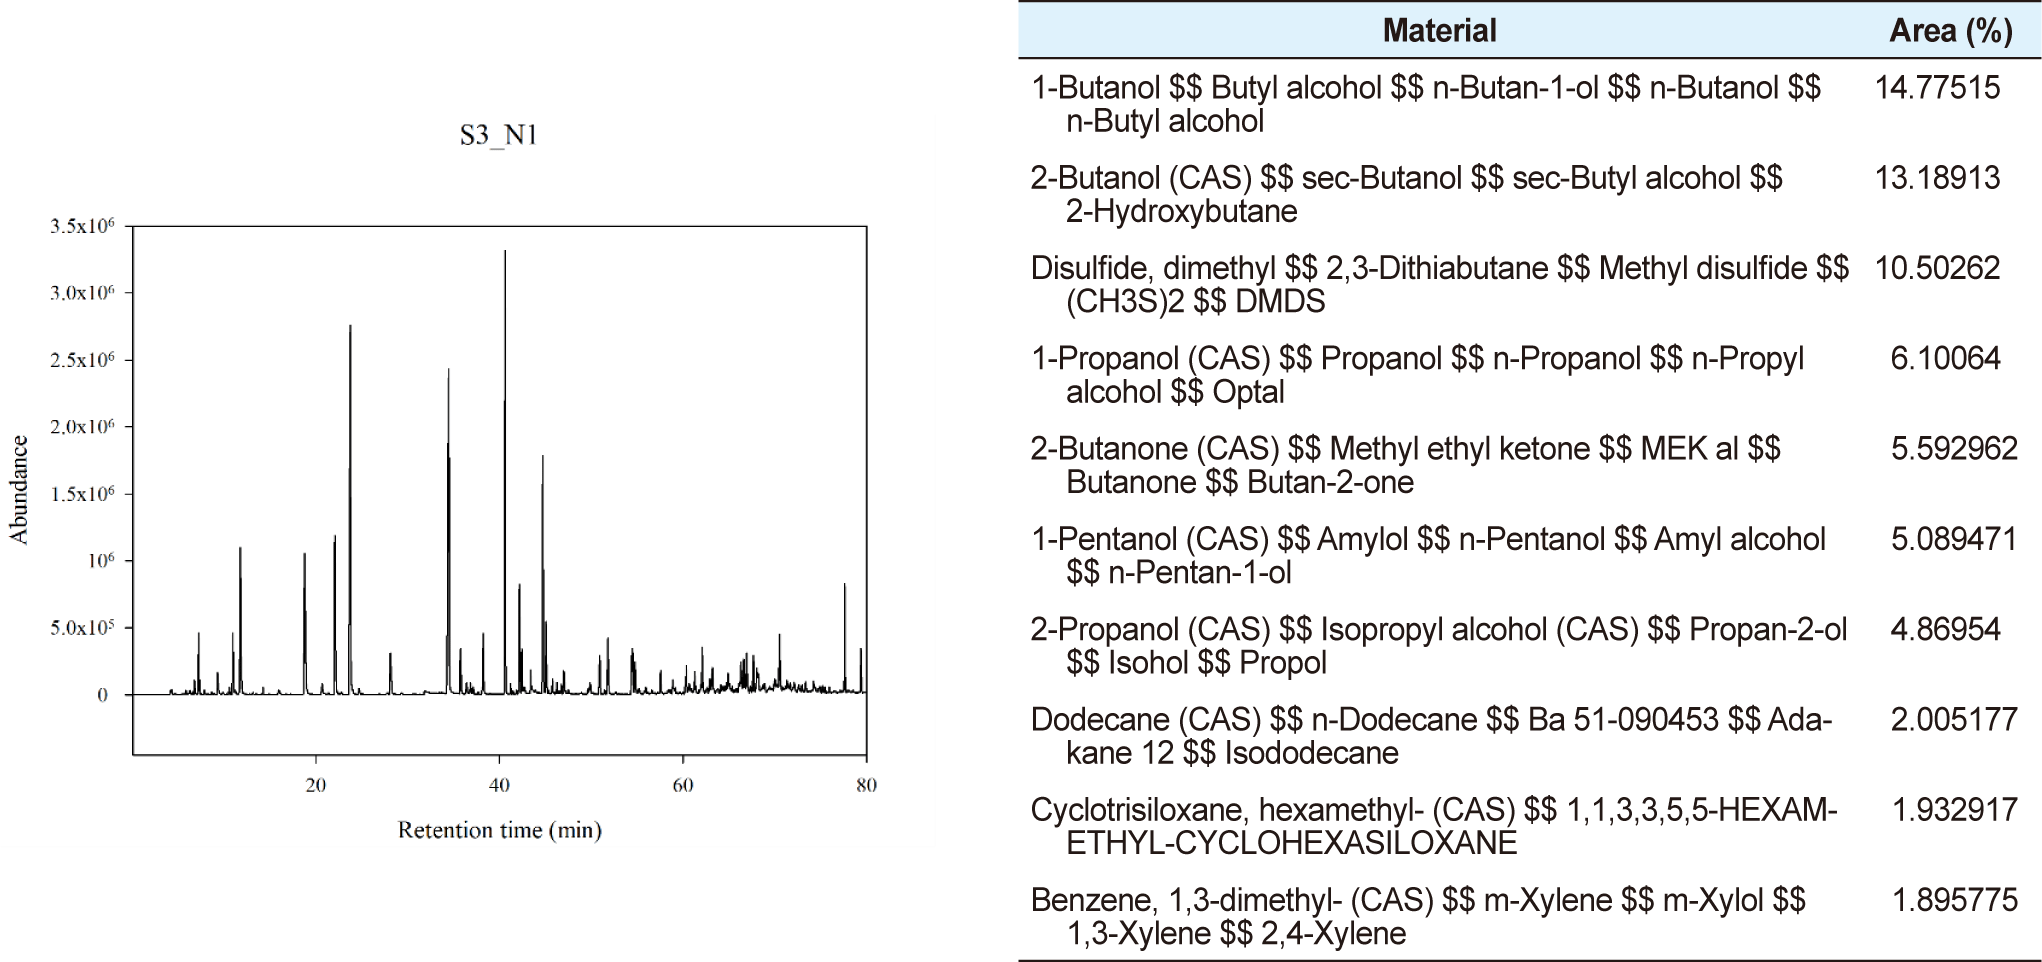
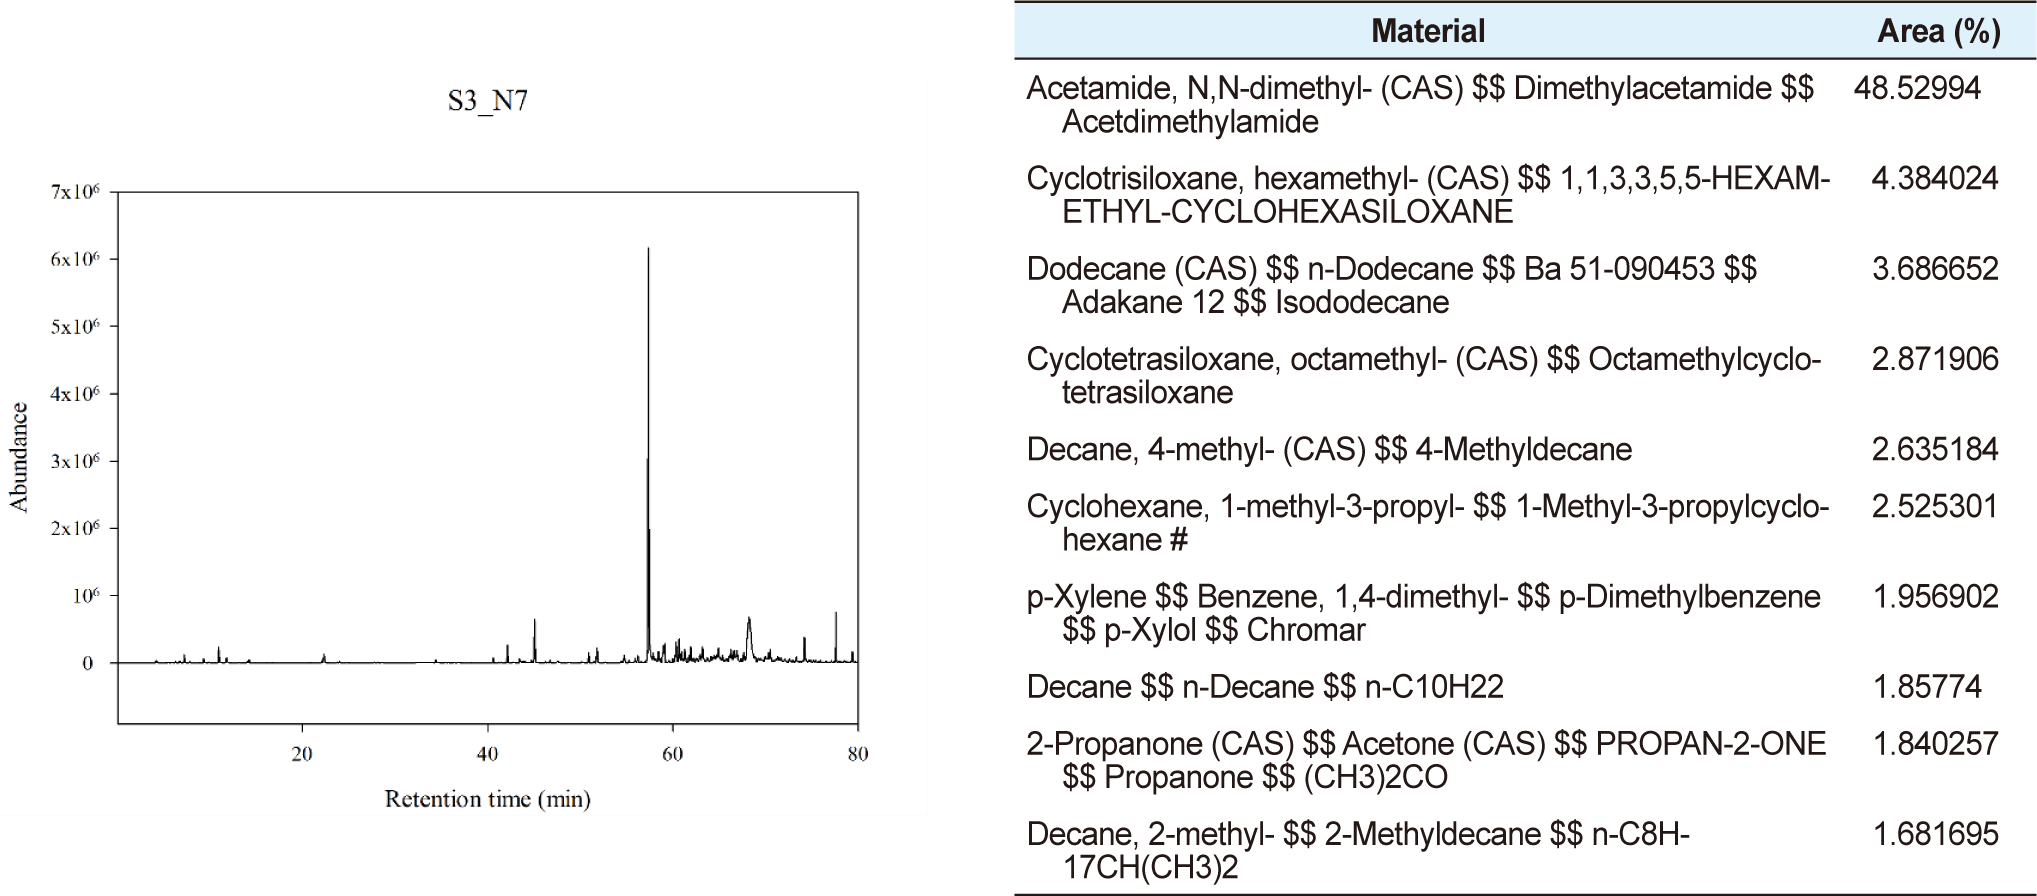
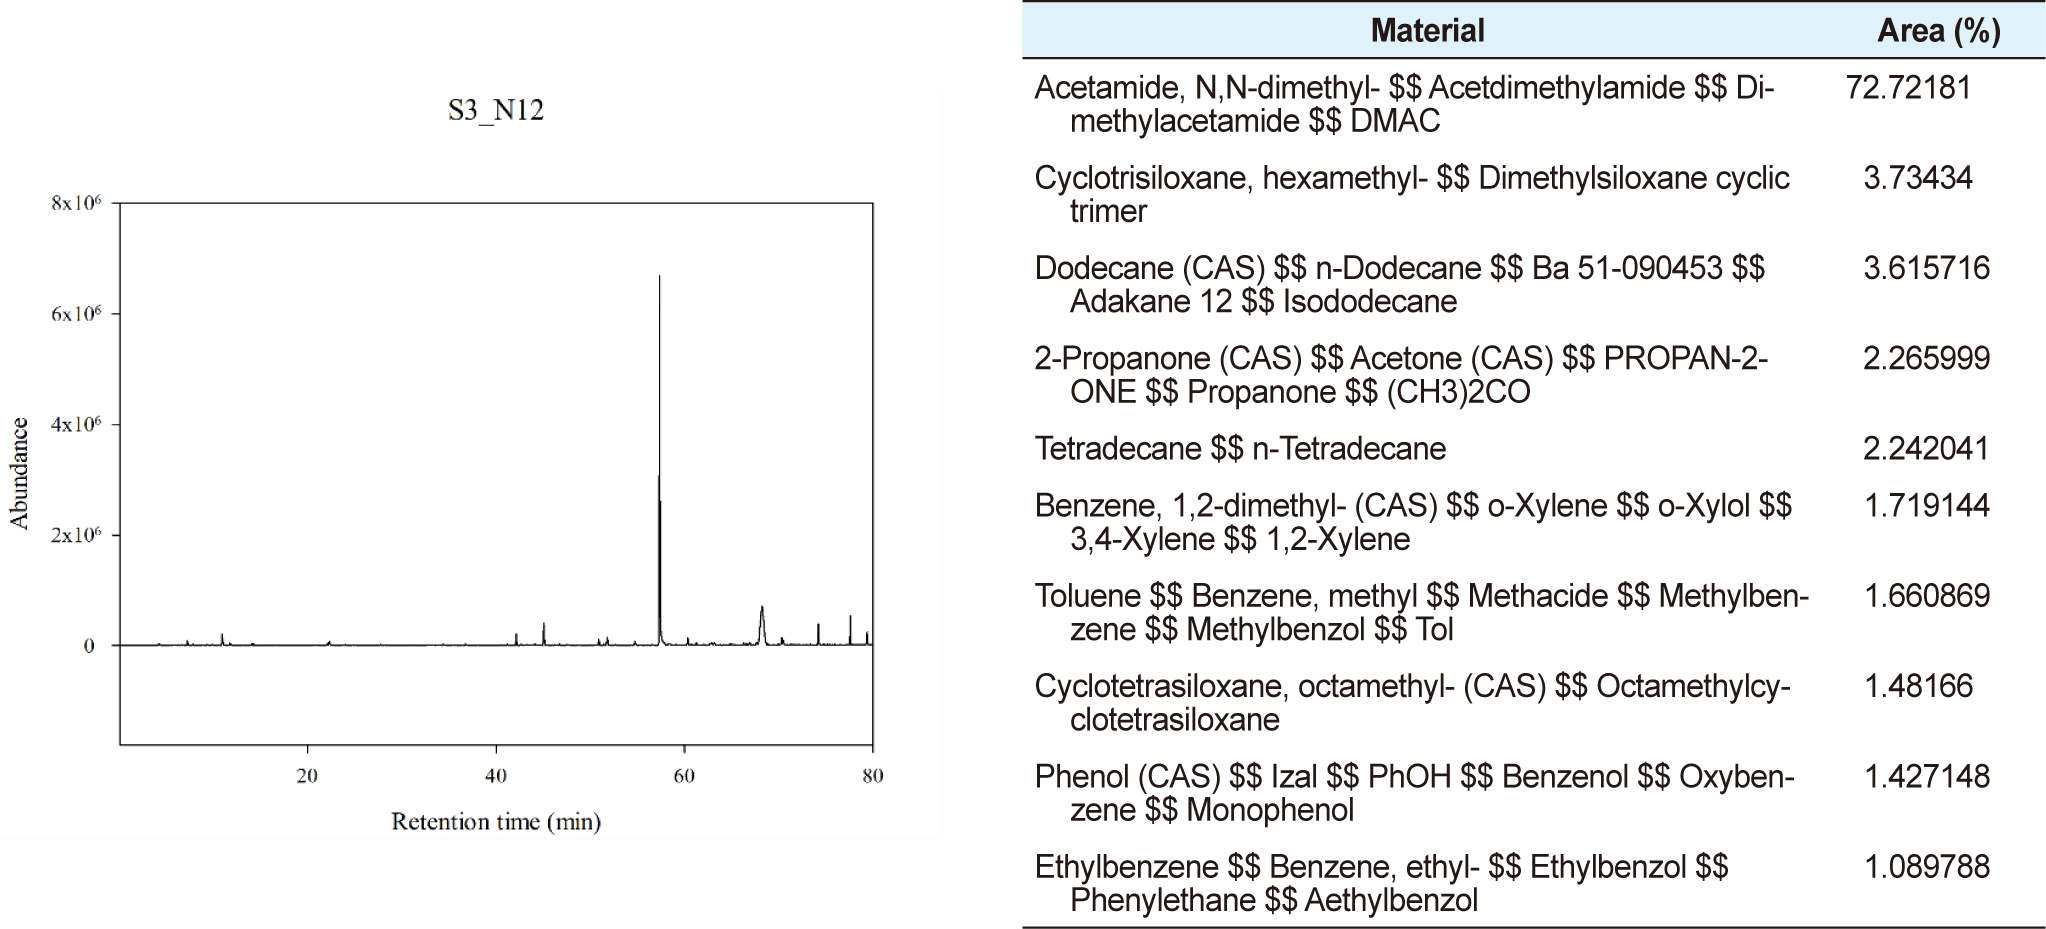
At the third sample, Butyl alcohol, Methyl disulfide, and n-Dodecane were analyzed as major VOCs in the case of type A. Many other substances were also detected besides major substances in case of type A feed as shown in Fig. 10. For type B and C feed, Dime-thylacetamide, Dimethylsiloxane cyclic trimer, 1,1,3,3,5,5-Hexamethyl-cyclohexasiloxane, and n-Dodecane were analyzed as the main VOCs. In both type B and C feed, Dimethyla-cetamide accounted for the largest number of areas and the area itself of all materials was also smaller than the first and second sampling days as shown in Figs. 11 and 12.
DISCUSSION
The most important part of the odor evaluation is the evaluation as soon as possible after the odor sample is collected. It is usually recommended to evaluate within four to six hours because losses can occur during the transport and storage of odor samples, which can be underestimated compared to the actual degree of odor [14,15]. In this experiment, the sampling site and the evaluation site are located about 2 hours away, and accordingly, the loss of odor samples occurred in the preparation process for transporting and evaluating the samples may be a limitation of this study.
As a result of the sensory evaluation of the complex odor, it was confirmed that the degree of odor significantly weakened after two weeks compared to the collection day (1st sample) of swine manure. However, after four weeks, the odor level increased again, which would be due to the decomposition of swine manure. Therefore, it is recommended to set the evaluation period within two weeks when evaluating the odor of swine manure.
There is a lack of information on feed in this study. However, information on the calories, mixing conditions, and nutritional content of feed varies widely from product to product. Additionally it is very difficult to manage all feed uniformly. In this study, we tried to propose a method that can reduce the odor of swine manure by simply controlling the shape of feed and calories. For example, most of pigs do not chew their food carefully like humans do. It can be seen from the fact that corn is not digested in pig manure and is discharged as it is.
Ammonia and sulfur-based odorous substances are the causative agents that account for the majority of swine manure odors [16]. Most previous studies have shown that ammonia and sulfur-based odor substances have a constant decrease in concentration over time [17]. In this study, it was also confirmed that the concentration of ammonia and sulfur-based odor substances decreased over time compared to the concentration on the collection day of swine manure.
Based on the results of qualitative analysis of VOCs, Decane substances accounted for most of the VOCs from the collection day of swine manure to two weeks later. Four weeks later, however, Butyl alcohol, Methyl disulfide, and n-Dodecane dimethylacetamide be-came the main VOCs. It was found that the composition of the major VOCs changed over time, which is also due to swine manure decay [18]. The simple adjustments such as the shape of feed and calories were made in this study. In addition, a qualitative analysis was conducted to investigate what odor substances were generated according to the digestive state. In the future, however, we feel the need to propose a plan to control the nutrients in the feed by matching the information on the blending conditions and nutritional components of the feed with the quantitative analysis results of GC-MS.
In case of a study conducted on animals as in this study, the health status and condition of pigs subject to the study may affect the results of the study. The fact that both the health and condition of the 15 pigs during the experiment period are not consistent can also be a limitation of this study [19]. In the future, thus, it is necessary to increase the number of pigs to be evaluated in order to obtain more reliable data than the current re-search results. In addition, there is limitation for evaluating complex odor concentration such as the small number (five persons), disproportionate gender ratio and the failure to completely control the olfactory state of panels who conducted a sensory evaluation [20]. It is expected that more reliable results can be obtained if further research, which is improved by reflecting these limitations, is conducted in the future.
CONCLUSION
According to the processing mode and calorific composition of the feed, which is a factor that greatly affects the odor of swine manure, 15 pigs were raised under different forms and calorific compositions of feeds and the occurrence pattern of swine manure odor generated according to each condition was analyzed simultaneously. On the collection day of swine manure, ammonia and sulfuric compounds were the main substances affecting the degree of odor. After 4 weeks, however, it was confirmed that the main odorous substances changed from ammonia and sulfuric compounds to VOCs. This finding would be conversion of main odorous compounds due to decay of swine manure from two weeks later. This phenomenon was more pronounced in pigs fed with powdered feedstuff and the higher the calories of feed, the worse the odor. Therefore, it is advantageous to use low-calorie feed consisting of pellet type to reduce the odor generated during the swine raising process. Furthermore, it is considered that manure in swine farms should be treated two weeks before its decay occurs to effectively prevent emission of odor derived from swine manure.


