
INTRODUCTION
Providing appropriate nutrients and feed additives is crucial for optimizing the health, growth, productivity, and overall well-being of livestock [1]. Novel feed additives have been researched and developed, including functional mineral preparations, natural plant products, and compounds designed to enhance animal health and productivity [2].
Polyphosphates, naturally found in microorganisms, plants, and animals, are known as polyphosphoric acids. They are a class of inorganic compounds composed of multiple orthophosphate units connected by phosphoanhydride bonds [3,4]. These compounds are crucial in various industrial and biological applications due to their unique chemical properties and functional versatility [3]. They contribute to bone formation and regeneration, anti-inflammatory responses, energy metabolism, and buffering and water retention in tissues. Additionally, they exhibit antimicrobial activity and inhibit the growth of pathogenic bacteria [5,6].
The functionality of polyphosphate depends on the molecule’s chain length [7]. Short -chain polyphosphates primarily act as an energy carrier, similar to adenosine triphosphate (ATP), which supports cellular metabolism and energy storage [7]. Meanwhile, medium-chain polyphosphates are involved in physiological processes associated with cell growth, differentiation, migration, bone formation, and tissue regeneration [8]. Long -chain polyphosphates play roles in regulating inflammatory responses, blood coagulation, and immune functions [9]. Due to their diverse functional roles based on chain length, polyphosphates demonstrate significant potential as a feed additive in livestock.
Recent studies on polyphosphates supplementation in broilers have been reported [10,11]. The absence of IL-6 and TNFα expression in the intestinal tissues of healthy chickens indicates that polyphosphates did not induce severe inflammation, thereby supporting its potential as a safe dietary intervention. P14 increased the diversity of gut microbiota and decreased the number of Shigella,Salmonella in the cecum of broilers [10]. Supplementation with long-chain polyphosphates (P130) has improved growth performance, organ characteristics, blood urea nitrogen, and gut bacterial composition in broilers [11]. These studies suggest that medium-chain and long-chain polyphosphates improve productivity, immunity, and a diverse and balanced gut microbiome in broiler chickens.
Although previous studies have demonstrated the potential benefits of polyphosphate supplementation in broilers, there are few studies on how these benefits translate to laying hens, particularly with regard to effects on egg production and quality. Research is needed to determine the specific effects of polyphosphate chain length on productivity and various physiological and in laying hens. Comparing polyphosphate supplementation of various chain lengths could provide insights into the optimal polyphosphate chain length and the benefits of these feed additives for laying hens. Thus, this study aimed to evaluate the effects of supplementation with short, medium, and long-chain polyphosphates on laying performance, egg quality, blood characteristics, visceral organs, tibia characteristics, intestinal histomorphology, and cecal microbiota in laying hens. This research will contribute to more sustainable and efficient poultry production by identifying the most effective types of polyphosphates.
MATERIALS AND METHODS
Polyphosphates of varying chain lengths—P3 (short-chain polyphosphate [SCPP]), P14 (medium-chain polyphosphate [MCPP]), and P130 (long-chain polyphosphate [LCPP])—were obtained from RegeneTiss for use in this study.
This study involved one hundred 51-week-old Lohmann Brown laying hens, divided into four groups, each consisting of five replicates with four hens each. The treatment groups received diets supplemented with 0.1% of P3, P14, or P130, while the control group was given a basic diet devoid of polyphosphate additives. The basal diet used in this experiment was formulated with nutrient levels that meet the requirements of the 2017 Korean Poultry Feeding Standard (Table 1). For the preparation of the polyphosphate-included diets, P3, P14, or P130 was dissolved in one liter of water and mixed with two kilograms of the basic feed. This premix was then thoroughly blended with the main feed using a feed mixer (DKM-350SU, Daekwang) for ten minutes. After a 2-week adaptation period to the basal diet, the experimental diets were then fed for 4 weeks of the experimental period. Feed and water were provided ad libitum, and a lighting schedule of 18 hours of light and 6 hours of darkness was maintained throughout the experiment. The temperature was consistently maintained at 22 ± 3°C. At the end of the experiment, five hens from each treatment group were randomly selected and euthanized with carbon dioxide to assess blood, organ, and tibia characteristics, gut histomorphology, and gut microbiota. The experimental protocol was approved by the Animal Care and Use Committee (IACUC) of Konkuk University (approval number: KU23227).
1) Vitamin mixture provided the following nutrients per kg of diet: vitamin A, 20,000 IU; vitamin D3, 4600 IU; vitamin E, 40 mg; vitamin K3, 4 mg; vitamin B1, 3.6 mg; vitamin B2, 8 mg; vitamin B6, 5.8 mg; vitamin B12, 0.04 mg.
Throughout the experiment, data were collected daily at 10 am regarding the number of eggs, their weight, and any occurrences of damage or deformation. The egg production rate (EPR, %) was calculated weekly by dividing the total number of eggs produced by the initial count of hens and repeated each week. Egg weight (EW) was determined daily by dividing the total weight of the normally produced eggs by their quantity. Egg mass (EM) was derived by multiplying the daily egg weight by the egg production rate. Feed intake (FI) was measured and documented weekly. The feed conversion ratio (FCR) was calculated by dividing the weekly feed intake by the egg mass [12].
Each week, twenty eggs per treatment were collected and evaluated for various parameters including egg weight, Haugh unit, eggshell strength, and eggshell thickness. All egg quality measurements, except for eggshell weight, were performed using a Digital Egg Tester (DET6000, NABEL). The haugh unit (HU) was calculated using the following formula: HU = 100 × Log (H + 7.57 – [1.7 × W0.37]). In the aforementioned formula, H denotes the albumen height (mm) and W represents the egg weight (g) [13].
Following euthanasia, cardiac puncture was performed to collect approximately 10 mL of blood from each bird, which was then stored in clot activator tubes (CAT) under refrigeration until analysis. Serum was isolated from the blood samples by centrifugation at 1,500×g for 10 min using a centrifuge (HA-1000-3, Hanil Science Medical) and subsequently stored at –20°C for biochemical analysis. Biochemical parameters such as aspartate aminotransferase (AST), alanine aminotransferase (ALT), blood urea nitrogen (BUN), calcium, total cholesterol (TC), creatinine, glucose, inorganic phosphorus (IP), triglyceride (TG), and total protein (TP) were analyzed using an automatic biochemistry analyzer (CHEM 7000i, Fujifilm) [14].
The intestines were segmented into four parts: the duodenum, measured from the pancreatic ring; the jejunum, from the end of the pancreatic ring to Meckel’s diverticulum; the ileum, from Meckel’s diverticulum to the ileocecal junction; and the cecum, quantified by the average length of the right and left ceca. These segments’ lengths were recorded relative to body weight, specifically per 100 g of body weight. The liver and spleen weights were also measured using an electronic scale (EL4002, Mettler Toledo) and recorded relative to 100 g of body weight.
The left tibia was collected from each specimen, with all surrounding tissues removed before analysis. The tibia’s breaking strength was determined using a three-point bending test conducted on an Instron Universal Testing Machine (Model 3342). The bone was secured at intervals of 4.0 cm, and force was applied at a crosshead speed of 200 mm/min within a 50 kg load range to determine its strength [15].
Samples measuring 2 cm each from the jejunum and ileum were collected and fixed in 10% formalin solutions, respectively. Following fixation, the samples were sent to a slide production company (KP&T) for hematoxylin and eosin staining. The processed slides were analyzed under a microscope (BX43, Olympus) using eXcope X3 software (DIXI Science). Measurements of villus height (VH) and crypt depth (CD) were taken at five points within each sample, and the averages were calculated. The results are expressed as the ratio of VH to CD.
Immediately after dissection, the cecum’s contents were preserved on dry ice and transported to the laboratory for microbial enumeration. They were stored in 50 mL conical tubes (Falcon). Various media were used for culturing: Nutrient Agar (NA; Difco) for total bacteria, deMan Rogosa Sharpe (MRS; Difco) for lactobacilli, MacConkey (Difco) for coliform bacteria, and Shigella and Salmonella (SS; Difco) for detecting Shigella and Salmonella. Each 1g sample was serially diluted in sterile distilled water and inoculated onto the respective media. Cultures were incubated at 37°C for 24 to 48 hours. Following incubation, colony counts were computed and expressed in Log CFU/g.
Approximately one gram of cecal contents was collected from five birds per treatment and immediately frozen in liquid nitrogen. PCR conditions, DNA extraction, bioinformatics and NGS sequencing analysis were performed according to a previously described method [16]. Briefly, a PowerSoil DNA Isolation Kit (Mobio Laboratories) was first used to isolate genomic DNA. The V3-V4 region of the bacterial 16S rRNA gene was then amplified using 341F and 785R primers. Sequencing was then performed on the Illumina Miseq platform using the commercial service of Macrogen. Amplicon sequence variants (ASVs), Chao1, Shannon and Gini-Simpson indices were checked to compare alpha diversity. Principal coordinate analysis (PCoA) and unweighted pair-group mean average (UPGMA) analysis based on the UniFrac distance matrix were used.
The data were subjected to a completely randomized design via the PROC GLM procedure in SAS 9.4 (SAS Institute). Laying performance was evaluated based on replications, and egg quality was assessed on a per-egg basis. Analyses of blood, organs, tibia, and cecal microbiota used individual laying hens as the experimental units. Differences between means were determined using one-way ANOVA with Tukey’s test at a significance level of p < 0.05. Significance level 0.05 < p < 0.10 was indicated as trend. Results are presented as mean and standard error of the mean (SEM).
RESULTS AND DISCUSSION
The effects on egg production rate, egg weight, daily egg mass per hen, and FCR are presented in Table 2. The P130 group exhibited a significantly lower egg production rate and egg mass compared to the control and P3 group (p < 0.05). The P130 group also tended to have the lowest egg weight (p = 0.07). The control’s feed intake was lower than that of the P3 group (p < 0.05). However, FCR did not significantly differ between groups (p > 0.05). Previous studies have demonstrated that sodium long-chain polyphosphate (P130) can significantly reduce FCR in broiler chickens from day 7 to day 21 [11]. Poultry performance results may vary according to factors such as bird breed, age, rearing environment, and supplementation. Phosphorus concentration of each polyphosphate, with a molecular structure of (NaPO3)n, can vary due to the different sodium forms, making it challenging to accurately quantify its phosphorus content. Given that polyphosphate was introduced at only 0.1% of the diet, its influence on the overall calcium-to-phosphorus (Ca:P) ratio is minimal and unlikely to affect the balance.
This study suggests that while P130 may negatively affect egg production parameters in laying hens, its effects on feed efficiency, as indicated by FCR, were not significant in this context. This highlights the need for careful evaluation of the use of P130 in laying hen diets, particularly in light of its potential to reduce overall productivity. The implications of these findings suggest that while P130 has shown benefits in broilers, its use in laying hens may require adjustments in dosage or a reconsideration of its suitability for this purpose. Furthermore, research on the effects of polyphosphate feed additives on animal productivity remains sparse, underscoring the need for further experimental studies and detailed analyses. The limited availability of previous studies makes it challenging to draw definitive conclusions at this time. Future research should focus on identifying the optimal dosage of polyphosphates for laying hens, as well as investigating its long-term effects on laying performance at different stages of the laying cycle.
Table 3 assesses the effects of polyphosphate supplementation in the feed on various egg quality parameters such as weight, Haugh unit, shell -breaking strength, and thickness. The average weight of the eggs tended to be lower in the P130 group compared to the control (p = 0.07). The P3 group exhibited significantly greater shell strength compared to the P130 groups (p < 0.05). The Haugh unit and eggshell thickness were not significantly different between groups (p > 0.05). The findings suggest that different chain lengths of polyphosphate in the feed did not affect the Haugh unit and eggshell thickness. Egg quality is genetically determined by the breed of laying hens and influenced by factors such as environmental conditions, the age of the hens, diet composition, and other variables [17].
Table 4 illustrates the effects of dietary supplementation with polyphosphates of various chain lengths on biochemical blood characteristics. Serum enzyme levels serve as markers of organ or tissue damage [18]. There were no significant differences in ALT, AST, BUN, calcium, total cholesterol, creatinine, glucose, IP, and TG between the groups (p > 0.05). TP levels were significantly higher in the control compared to P3 and P130 (p < 0.05). However, this variation falls within the range (4.5 to 7.0 g/dL) documented in other studies on healthy laying hens. Adequate serum protein levels are essential for laying hens, facilitating effective utilization of energy and nutrients essential for growth and productivity. These levels are also critical for the normal functioning of biological processes, including immune responses [19,20]. Furthermore, there is a possibility that polyphosphate may influence protein metabolism or utilization, although the precise mechanisms underlying this effect remain unclear. It is hypothesized that polyphosphate may interact with processes such as nutrient absorption, liver protein synthesis, or immune modulation, which highlights the need for further investigation.
Previous poultry studies have also reported that polyphosphate can affect blood parameters, which supports its potential role in modulating physiological processes. Chang et al. [10] reported that P130 increased glucose and triglyceride levels while P3 decreased triglyceride levels in broilers. Moon et al. [11] observed that P130 decreased blood urea nitrogen in broilers. The properties of blood can be influenced by bird breed, environmental factors or different nutritional elements, which affect intermediate metabolic processes [21]. This study indicates that polyphosphate supplementation did not influence mortality or have adverse effects on the health of laying hens.
Table 5 reveals the effects of polyphosphate supplementation on the organ characteristics of laying hens. The size and structure of intestines offer valuable insights into how dietary components affect organ function and development in these birds [22]. Longer intestines require more energy for maintenance, which may reduce the energy available for productive activities. Additionally, an extended residence time for digestive enzymes usually leads to an increase in intestinal length. Consequently, shorter intestines can improve nutrient absorption rates and decrease the FCR [23]. There were no significant differences in the relative lengths of the duodenum, jejunum, ileum, and ceca among the groups (p > 0.05).
Regarding liver weight, the P3 group had significantly higher values compared to the P130 group (p < 0.05). However, polyphosphate supplementation did not affect liver weight compared with the control group. The liver plays a crucial role in humoral immunity and performs various metabolic and homeostatic functions. Changes in liver weight could directly or indirectly influence health and productivity [24]. Increases in liver weight might result from the accumulation of fat, protein, and water, or from hepatocyte hypertrophy [25]. Additionally, studies on broiler carcass quality have demonstrated that diets including LCPP resulted in reduced liver weights, which correlated directly with body weight [10,26].
This study suggests that polyphosphate supplementation had no adverse effects on organ weight and characteristics. Future studies should evaluate the effects of long-term administration of polyphosphate by optimal chain length on the physiological characteristics of laying hens.
Table 6 demonstrates that polyphosphate supplementation affects the strength of the tibia. Although there was no significant difference in bone strength between the groups, P130 exhibited greater bone strength than the control group. The trends observed in the impact of different chain lengths of polyphosphate on tibia breaking strength are substantial and call for more detailed investigation in future studies [27]. The skeletal system of laying hens is a crucial component in the calcium supply chain, which is essential for eggshell formation. Studies have shown that dietary components can independently enhance egg production, eggshell quality, and bone characteristics in laying hens [28].
| Item | Treatment1) | SEM | p-value | |||
|---|---|---|---|---|---|---|
| Control | P3 | P14 | P130 | |||
| Bone Strength | 19.92 | 21.46 | 25.74 | 26.61 | 1.63 | 0.16 |
Therefore, these findings clarify how the structural diversity of polyphosphate influences the skeletal health of laying hens. The results also suggest that selecting the appropriate forms and feeding strategies of polyphosphate could significantly benefit skeletal health in laying hens [29].
Table 7 displays the effects of polyphosphate on the microstructural characteristics of the digestive tract in laying hens, noting significant changes in the structural properties of the jejunum and ileum. Polyphosphate groups had no significant effect on the VH compared to control, however, VH increased significantly in the P130 group compared to the P14 group (p < 0.05) in the jejunum. An increase in VH indicates a higher number of intestinal cells and enhanced production of digestive enzymes [30]. Additionally, increased VH suggests a larger surface area for nutrient absorption, facilitating improved nutrient uptake [31]. These results reveal that the chain length of polyphosphate affects the nutrient absorption area in the jejunum, thus directly influencing nutrient absorption efficiency.
Significant differences were also observed in the ileum, particularly in CD, with significant reductions noted in the P3, P14, and P130 groups compared to the control (p < 0.05). The reduction in CD could indicate enhanced cellular regeneration and restructuring within the intestine, potentially benefiting the health and recovery capabilities of the digestive organs. Optimal CD are associated with intestinal cell regeneration, contributing to improved intestinal health and enhanced nutrient absorption efficiency [32]. Significant differences were noted in the ratio of villus height to crypt depth (VH/CD) in the ileum, with an elevated VH/CD ratio in the P130 group compared to the control (p < 0.05). A higher VH/CD ratio suggests an optimal structural morphology of the intestinal epithelium, indicative of a larger surface area for nutrient absorption [33]. [34] reported that biogenic polyphosphate nanoparticles (BPNPs) improved intestinal epithelial barrier function and prevented oxidative stress. Therefore, this study suggests that polyphosphate supplementation may improve barrier function, suppress intestinal inflammation, and promote epithelial cell regeneration, thereby optimizing the VH/CD ratio, improving intestinal mucosal health, and maintaining structural integrity.
Table 8 illustrates variations in microbial populations within the cecum after polyphosphate supplementation. No significant differences were detected among treatments in the counts of Lactobacilli, Coliform bacteria, and Shigella/Salmonella (p > 0.05), with Lactobacilli showing the highest numbers, ranging from 8.35 to 8.50 Log CFU/g. This study suggested that polyphosphate supplementation did not influence changes in the bacterial population. Table 9 analyzed the microbial community in the cecal contents of laying hens using ASVs, the Chao1 index for biological richness, and the Shannon index for diversity and evenness [35]. The data indicated that the P130 treatment resulted in higher values for ASVs and the Chao1 index compared to the control (p < 0.05), implying that longer chain lengths of polyphosphate contribute to increased microbial diversity and richness in the cecal contents. The Shannon index revealed no significant differences between the groups (p > 0.05). A diverse gut microbiome is believed to support a broad range of microbial strains, which contribute to overall health. While diversity is important, maintaining a balanced microbial community is more closely associated with optimal gut health [36]. Polyphosphate supplementation resulted in increased microbial diversity. To explore its potential impact on gut health, beta-diversity analysis and microbial community composition were assessed.
| Items | Treatment1) | SEM | p-value | |||
|---|---|---|---|---|---|---|
| Control | P3 | P14 | P130 | |||
| ASVs | 523.00b | 545.20ab | 566.00ab | 616.00a | 19.86 | 0.03 |
| Chao1 | 527.56b | 551.46ab | 579.11ab | 631.05a | 22.24 | 0.03 |
| Shannon | 7.87 | 7.92 | 7.97 | 8.04 | 0.04 | 0.16 |
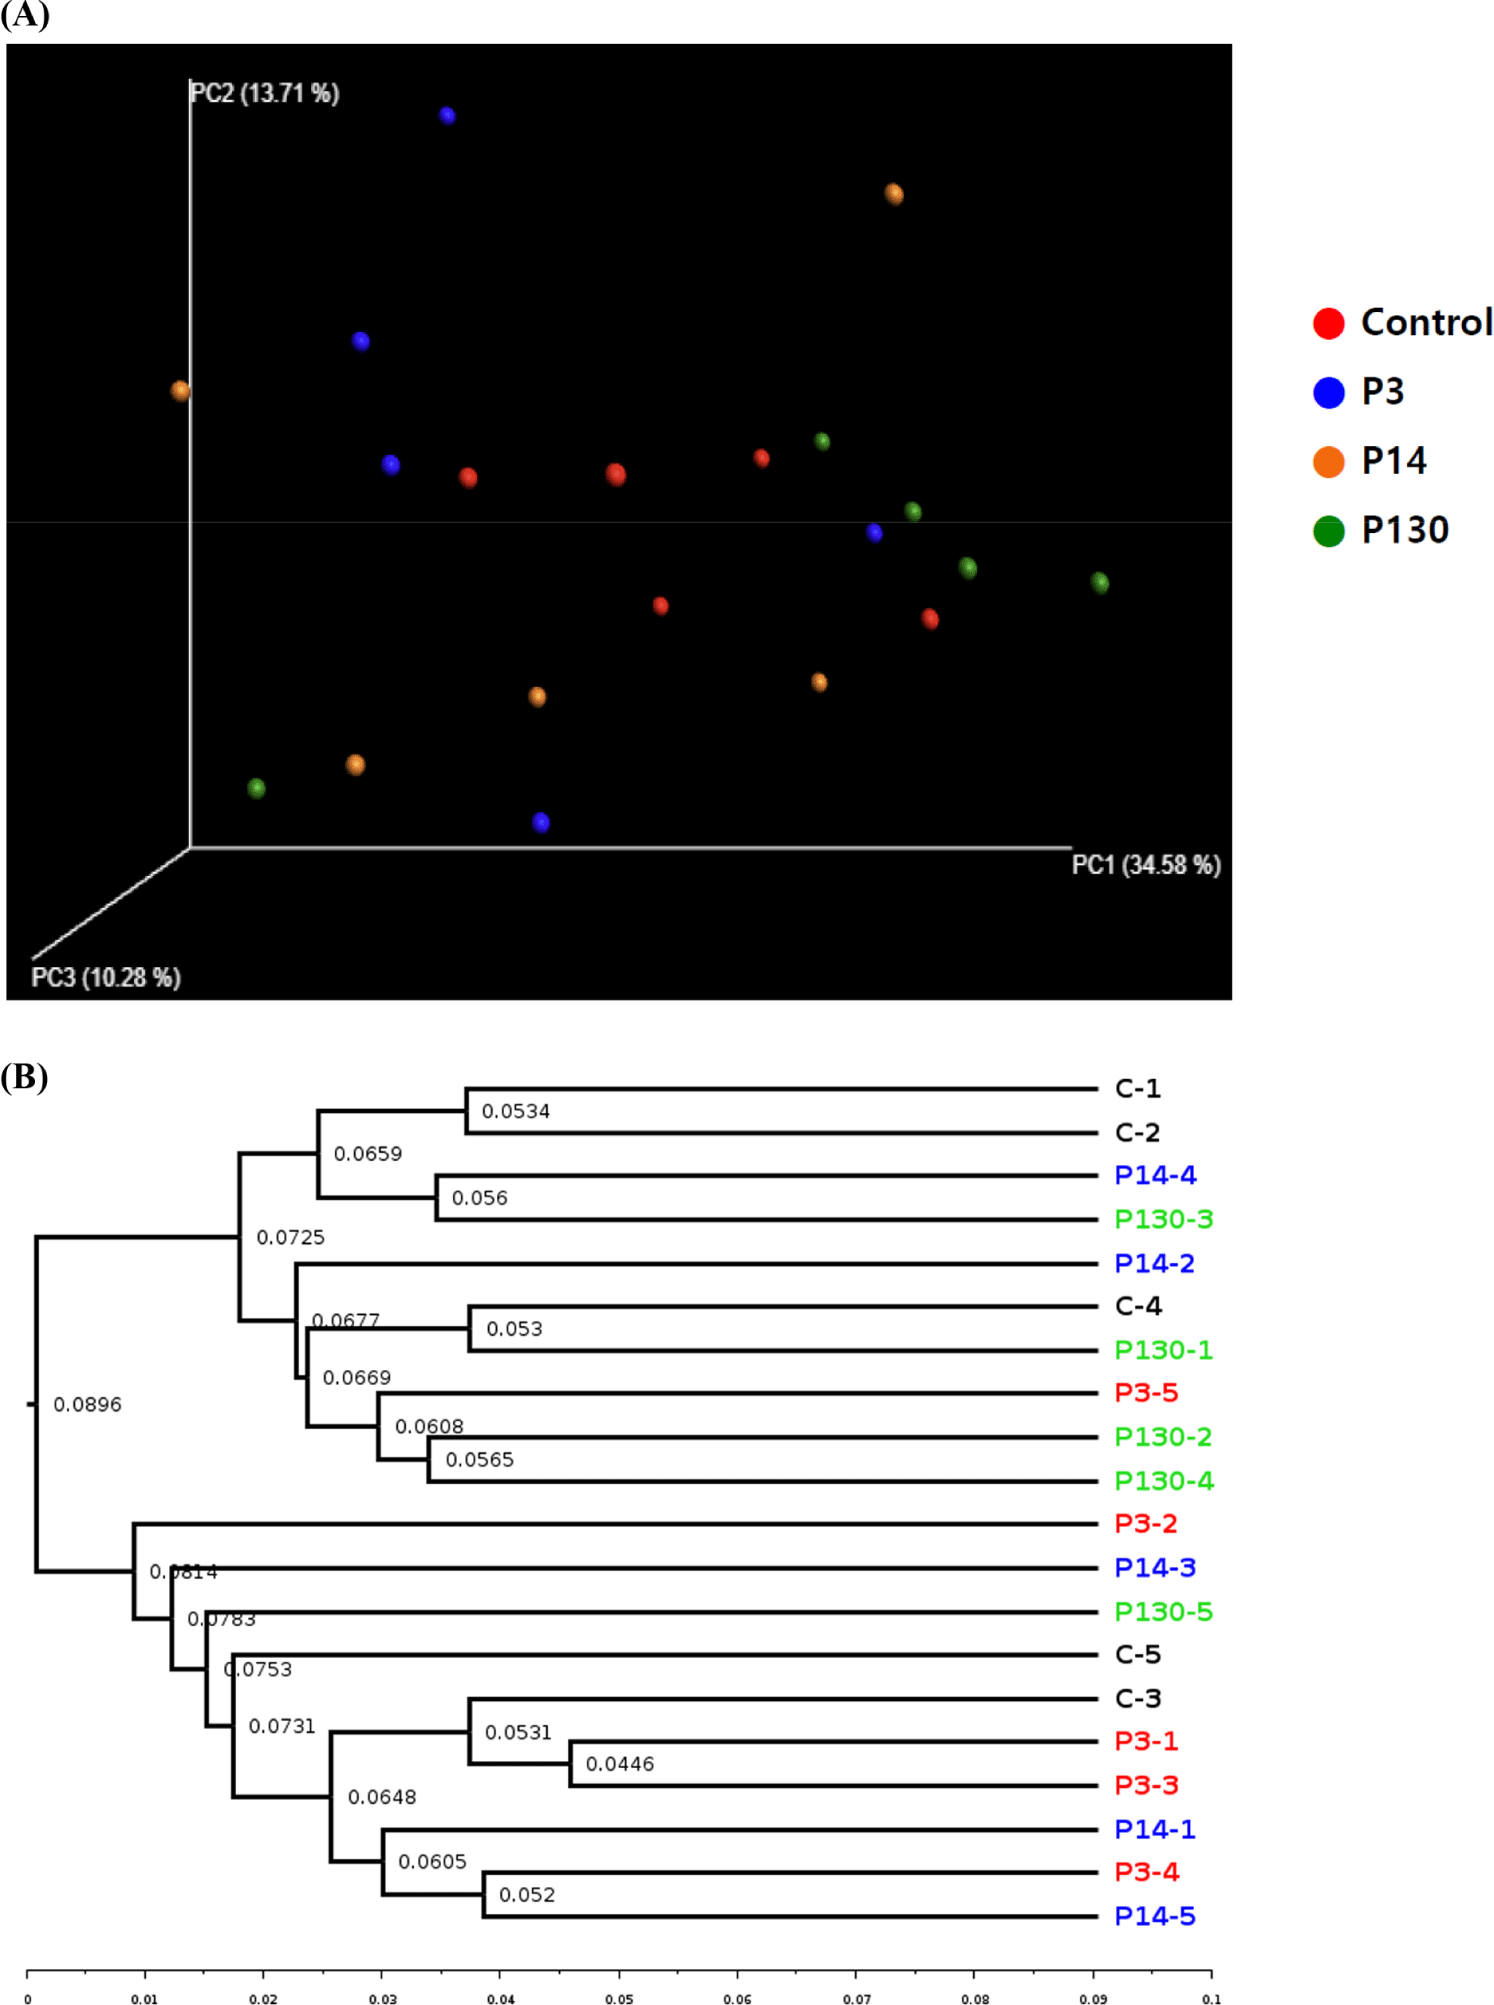
Beta diversity, a crucial concept in ecology and microbiology, reflects the variation in species composition across different environments or samples. Techniques such as PCoA and UPGMA tree are utilized to visualize and analyze beta diversity [37–39]. The effects of polyphosphate supplementation on the beta diversity of the microbial community in cecal contents are depicted in Fig. 1A and 1B. The beta diversity results showed that the PCoA plots and UPGMA tree revealed distinct bacterial communities between the control and P3 groups. Chang et al. [10] also reported differences in bacterial communities between the P130 and control groups in broilers. These results suggest that polyphosphate supplementation can significantly alter the composition of the gut microbiota, potentially resulting in distinct microbial communities.
The relative abundance of microbial components is illustrated in Fig. 2. The cecal microbiota of laying hens at the phylum level predominantly comprises Bacteroidetes (28.95%) and Bacillota (55.46%). These two major species, Bacteroidetes and Bacillota, represent approximately 84% of the total microorganisms in relative abundance (Fig. 2A). Although there were no significant differences between groups at the phylum level, the P14 group tended to show the highest abundance of Bacteroidota. Bacteroidota are linked to increased fermentative activity and play roles in the degradation of complex carbohydrates and protein metabolism, enhancing gut health [40,41]. Some Bacteroidota species may become opportunistic pathogens, particularly in individuals with compromised immune systems or dysbiosis. The Bacteroidota phylum includes both beneficial and harmful bacterial species, making the relative proportions of these species critical [42].
Fig. 2B illustrates the classification components of gut flora at the family level. Lachnospiraceae, Bacteroidaceae, and Oscillospiraceae constituted the largest percentages at this level. However, there were no significant differences between the groups at the family level. Lachnospiraceae and Oscillospiraceae belong to the phylum Firmicutes and possess beneficial functions, including butyrate production, inflammation reduction, and fiber fermentation. Nevertheless, in the case of dysbiosis, the gut can lead to health issues such as inflammatory bowel disease and irritable bowel syndrome [43]. Bacteroidaceae falls within the phylum Bacteroidestes and contributes to nutrient absorption and the prevention of harmful bacteria overgrowth. Certain species within the Bacteroidaceae family can become opportunistic pathogens when the gut microbiome balance is disrupted, potentially leading to infections or exacerbating inflammatory conditions [44]. This study indicates that polyphosphate had no effect on cecal dysbiosis, as no health problems or mortalities occurred during the experimental period. In Table 10, polyphosphate supplementation showed no significant difference in the abundance of bacterial genera. The findings reveal that polyphosphate supplementation did not substantially alter the microbial composition in the ceca of laying hens.
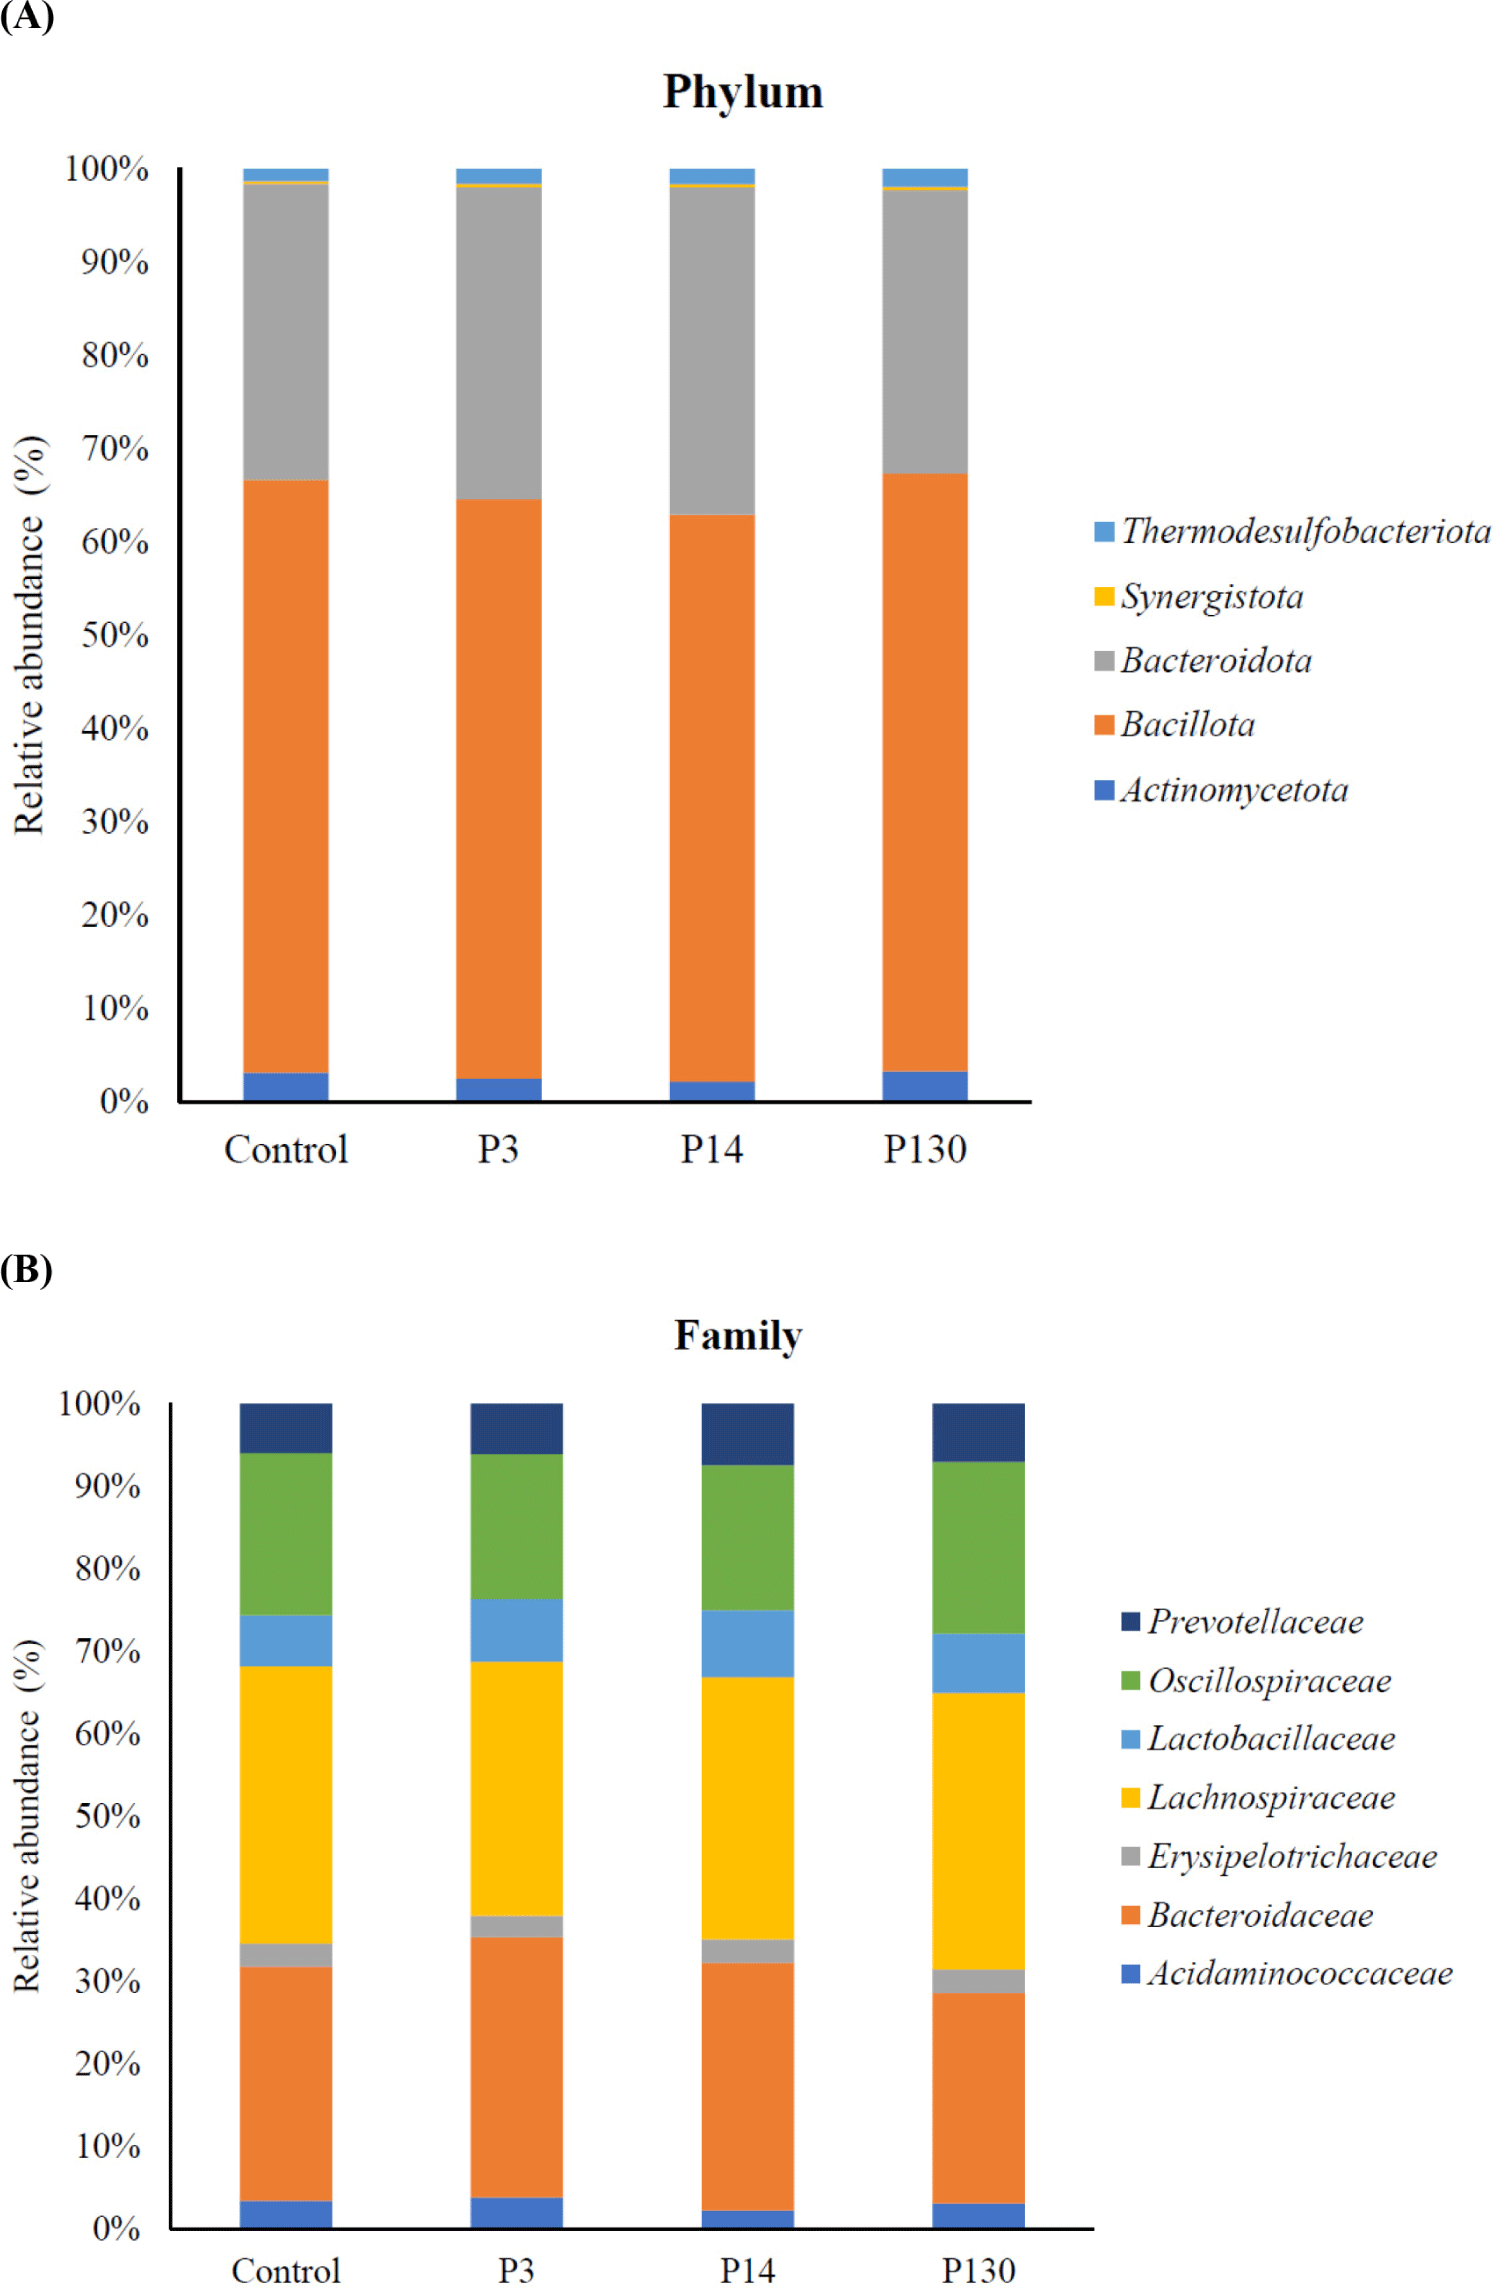
Table 11 compares the results of this study with previous broiler research on polyphosphate supplementation, showing that performance, blood characteristics, organ characteristics, and intestinal morphology, etc. Specifically, changes in the broiler microbiome have been observed. Chang et al. [10] reported that P130 supplementation increased the abundance of Phocaeicola and Faecalibacterium at the genus level in the cecum of broilers. In addition, supplementation with P14 and P130 reduced the population size (Log CFU/g) of Shigella and Salmonella in the cecum of broilers. Moon et al [11] also found that P130 supplementation increased the population size of beneficial bacteria (Streptococcus spp.) in the jejunum of broilers. However, no significant effects on the gut bacterial composition of laying hens were observed in this study. This discrepancy could be attributed to factors such as bird breed, age, metabolic pathways and different nutritional requirements.
| Laying hens | Broilers | Broilers | |
|---|---|---|---|
| Tested | P3, P14, P130 | P3, P14, P130 | P130 |
| Ref. | This study | Chang et al. [10] | Moon et al. [11] |
| Items | |||
| Performance | - Egg production and egg mass increased in control and P3 compared to P130 - Feed intake in P3 increased |
ND | - P130 improved body weight, average daily gain and decreased FCR during grower phase |
| Egg or meat quality | - No significant effect | - No significant effect | ND |
| Blood characteristic | - P3 and P130 decreased total protein levels | - P130 increased glucose and triglyceride levels - P3 decreased triglyceride levels |
- P130 decreased blood urea nitrogen |
| Organ characteristics | - No significant effect | - Liver weight was lower in P130 than control - P3 increased jejunum length |
- Duodenum and ileum length was shorter in the P130 than the control |
| Intestinal morphology | - CD in P3, P14, and P130 was lower than control - VH/CD ratio in P130 was higher than control |
ND | ND |
| Population size of bacteria in the gut | - No significant effects | - P3 and P14 decreased coliform bacteria - P14 and P130 decreased Shigella and Salmonella in the cecum |
- P130 increased coliforms and lactose negative enterobacteria in the jejunum - P130 increased Streptococcus spp. in the jejunum |
| Alpha diversity in the cecum | - P130 increased ASVs and Chao1 | - P14 increased ASVs and Chao1 | ND |
| Intestinal flora in the cecum | - No significant effects | - P3 and P14 decreased Bacteroides at the genus level - P130 increased Phocaeicola and Faeclibacterium - P3 increased Barnesiella |
ND |
Considering these results, further research is necessary to evaluate the suitability of various polyphosphates. Specifically, exploring the impact of polyphosphate chain length and its effects during different stages of the laying period, such as the early, mid, and late stages, would be valuable. Such investigations could elucidate the potential advantages and optimal conditions for employing polyphosphates in poultry, enabling customization to enhance productivity and gut health.
CONCLUSION
In conclusion, polyphosphate supplementation enhanced the VH/CD ratio in the ileum and increased bacterial diversity in the cecum, without adversely affecting blood and organ characteristics in laying hens. Among the three polyphosphates with varying chain lengths, P130 was found to be more effective than P3 and P14, potentially improving nutrient absorption and the diversity of the gut microbiome in laying hens.