INTRODUCTION
Climate change due to global warming is one of the most pressing challenges facing humanity. Methane is a potent greenhouse gas with a global warming potential (GWP) about 28 times greater than that of carbon dioxide, despite being present at lower atmospheric concentrations [1]. Enteric fermentation in ruminants is a major source of methane emissions, accounting for approximately 40% of global agricultural methane emissions [2] and representing the largest share of greenhouse gas emissions from livestock farming [3]. Reducing methane emissions from ruminant production has therefore become a critical goal in the fight against climate change.
In the rumen, microorganisms ferment carbohydrates to produce volatile fatty acids (VFAs) such as acetate, propionate, and butyrate. The hydrogen generated during this process is primarily consumed by methanogenic archaea (methanogens) and converted into methane. Various methane reduction strategies have been reported, including changes in feed composition and the use of chemical or natural additives [4–6].
However, these methods face significant limitations for commercialization, including supply constraints, high costs, and concerns about long-term safety and efficacy. As a result, biological methane reduction strategies using microorganisms have recently attracted considerable attention. Studies have shown that hydrogen metabolic pathways compete with propionate-producing and acetate-accumulating bacteria, and that activation of alternative hydrogen utilization pathways can significantly reduce methane production [7–9].
Lactic acid bacteria (LAB) supplementation, for example, can lower methane production indirectly by shifting fermentation pathways and altering organic acid profiles, rather than directly inhibiting methanogenesis [10]. These findings imply that microbiological strategies in the rumen offer feasible approaches for methane mitigation.
Total mixed ration (TMR) and fermented TMR (FTMR) are widely used feed types for ruminants due to their nutritional and management benefits. Conventional TMRs require complex control of moisture, microbial activity, and fermentation balance among feed ingredients, whereas FTMR employs LAB and fiber-degrading enzymes during fermentation to accumulate beneficial metabolites, thereby extending shelf life and improving overall feed quality [11]. FTMRs have therefore attracted attention as a strategy to enhance both storability and nutritional value. Nonetheless, broader application of FTMRs is limited by insufficient understanding of the functional microorganisms that can be leveraged for efficient fermentation and practical use. The fermentation process of TMR generates metabolites such as lactic acid, acetic acid, propionic acid, and butyric acid [12,13]. It is therefore essential to identify which metabolites most effectively promote fermentation and microbial colonization, and to elucidate the microbial activities they induce. We recently demonstrated that microbial consortia derived from Symbiotic Culture of Bacteria and Yeast (SCOBY) exhibit significant methane-mitigating effects in fermentation systems, implying their potential as functional inoculants for FTMR development [14].
Synbiotics have attracted attention as a strategy to improve the storability and nutritional value of feed through fermentation, because they enhance fermentation quality by promoting microbial colonization and function [15]. To optimize microbial fermentation further, targeted prebiotic development is needed beyond simple fiber- and oligosaccharide-focused research [16]. Meanwhile, genome-scale metabolic (GSM) models have emerged as useful tools for predicting microbial metabolic pathways and substrate utilization, as well as for identifying which precursors and substrates stimulate the growth and metabolic activity of specific strains [17]. Such models can be applied to predict effective prebiotic candidates for targeted probiotics.
In this study, we developed a synbiotic FTMR by combining methane-reducing microorganisms with targeted prebiotics that enhance their growth and evaluated its effects on nutritional and microbiological functional properties during fermentation. The scope of this study was limited to prebiotics identification, synbiotic formulation, and fermentation characterization of the FTMR. The direct assessment of methane reduction efficacy of FTMR under in vitro and in vivo conditions, as well as the elucidation of the underlying mechanisms, are designated as future research directions.
METHODS AND MATERIALS
Kombucha was used as the source of microbial inoculum in this study and was cultured under controlled laboratory conditions [18]. To prepare the fermentation medium, 0.5% (w/v) green tea leaves were infused in 400 mL of distilled water at 70°C for 5 min. After removing the tea leaves, 10% (w/v) sucrose was added and dissolved completely. The medium was then sterilized by autoclaving and cooled to room temperature. Subsequently, 20% (v/v) of the previously prepared kombucha stock was inoculated into the sterile medium. The culture vessel was covered with sterile gauze to maintain aerobic conditions and incubated statically at 25°C for 21 d.
To isolate the microorganisms, present in the kombucha, lactic acid bacteria were cultured on Lactobacilli MRS agar (Difco) and incubated at 37°C for 3 d. Yeasts were isolated using Yeast Peptone Dextrose agar (YPD; Difco) and Potato Dextrose Agar (PDA; Difco), followed by incubation at 25°C for 3 d. The dominant bacterial and yeast strains were identified by Macrogen. The 16S rRNA gene and the internal transcribed spacer (ITS) region were sequenced for bacterial and yeast identification, respectively. Species-level identification was performed by analyzing the obtained sequences using the NCBI BLAST tool.
Genome-scale metabolic modeling (GSM) was applied to two experimental strains, Komagataeibacter intermedius and Zygosaccharomyces parabailii. In addition to SCOBY-derived microbes, ruminal microorganisms essential for methane production were also included in the GSM analysis. Five representative methanogens found in the rumen (Methanobrevibacter ruminantium, Methanobrevibacter gottschalkii, Methanobrevibacter smithii, Methanobrevibacter olleyae, and Methanobrevibactermillerae) and three hydrogen-producing microorganisms (Ruminococcusalbus, Ruminococcusflavefaciens, and Butyrivibriofibrisolvens) were selected. The genome sequences of each microorganism were obtained in GBFF format from the NCBI GenBank database, and the GSMs were constructed using the KBase platform (https://www.kbase.us/).
Model construction was automated using the “Build Metabolic Model” tool, and metabolic pathway analysis was conducted using Flux Balance Analysis (FBA). The modeling conditions were set to anaerobic conditions, complete media, and D-glucose as the carbon source to mimic the rumen environment, with biomass production defined as the objective function for calculating metabolic flux. To identify prebiotic candidates based on GSM analysis, the utilization status of each compound by the selected microorganisms was analyzed. Compounds that were not taken up by the five methanogenic and three hydrogen-producing microorganisms but were utilized by the two experimental strains were shortlisted as candidate prebiotics. From these candidates, selections were further refined based not only on their predicted high metabolic flux contributions to the target strains but also on their economic feasibility and practical usability for industrial applications.
Three different prebiotic treatments were designed to promote the growth of the defined SCOBY: (1) amino acids and vitamin supplementation (AA + Vit), (2) carbohydrates and vitamin supplementation (Car + Vit), and (3) a mixed treatment containing all prebiotics (Car + AA + Vit). For amino acid supplementation, glycyl-L-leucine (0.04 g/L; Tokyo Chemical Industry) and Nα-glycyl-L-asparagine (0.011 g/L; Tokyo Chemical Industry) were used. The carbohydrate sources included glycerol (0.555 g/L; Biosesang) and oleate (12 mL/L; Daejung Chemicals & Metals). Menaquinone-7 (0.1 mg/L; Sigma-Aldrich) was used as the vitamin source.
The culture media were prepared by described in the previous section. Subsequently, 20% (v/v) of previously prepared kombucha stock was inoculated into the sterile medium. The culture vessel was covered with sterile gauze to maintain aerobic conditions and incubated statically at 25°C for 21 d. The experimental groups were treated with AA + Vit, Car + Vit, and Car + AA + Vit, and a control group was included for comparison. To measure optical density, 10 mL of culture medium was dispensed into a glass tube, placed in an optical reader, and the OD value was measured. Microbial growth was monitored by measuring the optical density at 600 nm (OD600) at 7-d intervals throughout the incubation period.
Rumen fluid samples were collected from fistulated Holstein steers with rumen fistulas at the experimental farm of Seoul National University (Pyeonchang, Korea). The collected rumen fluid was filtered through a 1 mm mesh sterile gauze (Daihan Medical) and degassed using a vacuum pump. The flask was sealed with a rubber stopper and maintained under anaerobic conditions by purging with nitrogen gas using a vacuum lock.
The rumen buffer was prepared following the method of Goering & Van Soest [19], containing Na2HPO4 2.85 g/L, KH2PO4 3.1 g/L, MgSO4·7H2O, 0.3 g/L, NaHCO3 17.5 g/L, NH4HCO3 2.0 g/L, tryptone 2.5 g/L, L-cysteine-HCl 0.625g/L, and resazurin sodium salt 10 mg/L. A mineral solution consisting of CaCl2·2H2O 1.32 g/L, MnCl2·4H2O 1.0 g/L, CoCl2·6H2O 0.1 g/L, and FeCl3·6H2O 0.8 g/L was added. The final buffer was adjusted to pH 7.0 using HCl.
The basal diet consisted of a commercial feed mix (Purinafeeds) containing corn and soybean meal, supplemented with ground rice straw. Both the feed mix and straw were ground for 20 min using a grinder (HR3757, Philips) and sterilized.
The in vitro fermentation was conducted in 240 mL serum bottles, each containing 0.5 g of ground feed mix, 0.5 g ground rice straw, 20 mL of rumen buffer, 20 mL of rumen fluid, and 1 mL of the experimental treatment sample. The bottles were sealed with rubber stoppers. The control group received a 1 mL of 0.85% saline solution instead of the treatment sample. Fermentation was carried out in an anaerobic chamber (COY Laboratory Products) at 39°C and 180 rpm. Samples were collected at 10, 20, and 30 h of incubation. All treatments were prepared in triplicate.
Methane and carbon dioxide production were analyzed using a gas chromatograph (ChroZen GC system, Youngin Chromass). The analytical column system included a molecular sieve 13× (Supleco) and a Porapak-N (Supleco). To ensure methanogenic activity, initial gas conditions were set to 3% hydrogen and 3% carbon dioxide, with nitrogen as the background gas. A 5-mL of headspace gas was sampled from each flask and injected into the GC via a gas-tight syringe. An automatic injector system transferred 250 μL of the sample to the GC valve. The carrier gas (helium) flow rate was maintained at 3.0 mL/min.
Values are presented as the mean ± SD and were derived from triplicate experiments. GraphPad Prism 9 software was used to statistically analyze the experimental data. Multiple comparisons were performed using the false discovery rate (FDR) approach, specifically the two-stage step-up method. An unpaired t-test assuming individual variance for each row was used to compare the groups. The results were considered statistically significant at p < 0.05. Significance levels are indicated by asterisks as follows: *p < 0.05, **p < 0.01, ***p < 0.001; ns indicates no statistically significant difference.
The total mixed ration (TMR) was supplied by Hampyeong Livestock Cooperative and consisted of fish meal pellets, timothy hay, alfalfa hay bales, Cheonji base (a commercial mineral and vitamin premix), corn distillers’ grains, molasses, probiotics, and Daumin. The TMR was supplemented with KZ consortium at concentrations of 5% and 10% (v/w), and the moisture content was adjusted to 40% using sterile distilled water. Prepared TMR samples (200 g each) were vacuum-sealed and subjected to anaerobic fermentation at 25°C for up to 14 d (n = 3 per treatment). The proximate composition of the control (CON) and treatment groups (5% Mix and 10% Mix) is presented in Table 1.
| Items (%) | Treatments1) | ||
|---|---|---|---|
| CON | 5% Mix | 10% Mix | |
| Crude protein | 9.79 | 9.71 | 10.16 |
| Crude fat | 1.63 | 1.55 | 1.75 |
| Crude fiber | 10.33 | 10.71 | 9.87 |
| Crude ash | 5.23 | 5.14 | 5.17 |
| NDF | 22.19 | 24.20 | 24.46 |
| ADF | 11.36 | 11.67 | 10.93 |
The moisture content was determined by pre-drying samples in an oven at 65°C for 48 h, equilibrating at room temperature for 24 h, and then drying approximately 2 g of the pulverized sample in an aluminum weighing dish at 135°C for 2 h using the atmospheric pressure drying method. The samples were cooled in a desiccator for 30 min before weighing, and the weight loss indicated moisture content. Crude protein was measured by the Kjeldahl method (AOAC 976.05): 0.5 g of sample was digested with 12 mL of sulfuric acid and a catalyst mixture at 420°C for 1 h, with nitrogen quantified using a Kjeltec Auto 8400 Analyzer (FOSS) and converted to crude protein by multiplying the nitrogen amount by 6.25. Crude fat was analyzed using 0.5 g sample sealed in an Ankom nylon filter bag, dried at 102 ± 2°C for 23 h, cooled, and extracted with diethyl ether for 60 min. Fat content was determined by the difference in weight after extraction. Crude fiber was determined by sequentially treating 0.5 g of sample in an Ankom nylon filter bag with 1.25% H₂SO₄ and 1.25% NaOH and measuring the weight loss, analyzed using a DELTA Fiber Analyzer (Ankom Technology). Ash content was established by combusting approximately 2 g of sample in a muffle furnace at 600°C for 3 h after preheating, followed by cooling and weighing. Organic matter content was calculated by subtracting ash content from total dry weight. Neutral detergent fiber (NDF) and acid detergent fiber (ADF) were quantified by sequential extraction of 0.5 g of sample in a nylon filter bag with neutral and acid detergent solutions using an Ankom DELTA Fiber Analyzer; residues after extraction were used to calculate NDF and ADF, respectively.
FTMR samples were collected on days 0, 7, and 14. For each sampling point, 10 g of sample was mixed with 40 mL of 0.85% saline solution and homogenized using a stomacher (BagMixer 400, Interscience) for 30 min. The homogenate was filtered through a sterile filter bag and used for pH measurement, microbial enumeration, and high-performance liquid chromatography (HPLC) analysis.
The pH of the FTMR extracts was measured using a pH meter (Sarter 300, OHAUS). After pH measurement, the samples were centrifuged at 4,500×g for 10 min, and the supernatant was filtered through a 0.25 μm membrane filter.
Metabolite concentrations, including sucrose, glucose, fructose, lactate, acetate, and ethanol, were determined using HPLC (1260 Infinity system, Agilent Technologies) according to the method described by Jeong et al. (2024). A Rezex-ROA Organic Acid H+(8%) column (Phenomenex) was used with 0.005 N sulfuric acid as the mobile phase. The flow rate was set at 0.6 mL/min, and the column temperature was maintained at 50°C.
FTMR extracts collected on days 0, 7, and 14 were subjected to 10-fold serial dilutions in 0.85% saline solution. Diluted samples were plated using the spread plate method. Bacterial populations were cultured on plate count agar (PCA), consisting of tryptone (5 g/L), yeast extract (2.5 g/L), dextrose (1 g/L), and agar (16 g/L). Yeast populations were cultured on yeast extract glucose chloramphenicol (YGC) agar, composed of yeast extract (5 g/L), dextrose (20 g/L), chloramphenicol (0.1 g/L), and agar (16 g/L). All plates were incubated aerobically at 25°C for 72 h. After incubation, colony-forming units (CFUs) were enumerated to quantify bacterial and yeast populations.
For DNA extraction, the pellet obtained from centrifuged FTMR extract was transferred to a bead-beating tube and vortexed for 30 min. Genomic DNA was extracted using a DNeasy PowerSoil Pro kits (QIAGEN) according to the manufacturer’s protocol. The concentration and purity of the extracted DNA were assessed using a spectrophotometer (NanoDrop, IMPLEN). Next-generation sequencing (NGS) analysis was outsourced to Macrogen.
For bacterial community analysis, the V3-V4 region of the 16S rRNA gene was amplified using the following primer set: forward (5’–CCTACGGGNGGCWGCAG–3’) and reverse (5’-GACTACHVGGGTATCTAATCC-3’). For yeast community profiling, the ITS3-4 region was targeted using the primer set: forward (5’-GCATCGATGAAGAACGCAGC-3’) and reverse (5’-TCCTCCGCTTATTGATATGC-3’) in the first-round PCR. PCR conditions included an initial denaturation at 95°C 3 min, followed by 25 cycles of denaturation at 95°C for 30 s, annealing at 55°C for 30 s, and extension at 72°C for 30 s, with a final extension at 72°C for 5 min. Following amplification, sequencing libraries were prepared using the Herculase II Fusion DNA Polymerase Nextera XT Index V2 Kit (Illumina). Sequencing was performed on the Illumina MiSeq platform.
Data for methane and carbon dioxide concentrations, metabolite profiles, and microbial populations were expressed as the mean ± SD. Statistical analyses were conducted using two-way ANOVA, followed by Tukey’s multiple comparison test, implemented in GraphPad Prism version 8.0.2. Groups not sharing the same letter were considered statistically significantly different at p < 0.05.
RESULTS
Seven microbial species, including bacterial and yeast strains, were isolated and identified from kombucha (Table 2). The bacterial isolates were K. intermedius (Accession No. PP851368), Komagataeibacter swingsii (PX059175), and Gluconoacetobacter hansenii (PX059176). The yeast strains included Zygosaccharomyces bisporus (PX058846), Z. parabailii (PX058844), Brettanomyces bruxellensis (PX058845), and Dekkera bruxellensis (PX058843). Colony morphology and relative abundance assessments revealed K. intermedius and Z. parabailii as the dominant species. These two strains, collectively referred to as KZ, were co-cultured under controlled laboratory conditions, and the resulting mixed culture was employed in synbiotic-based FTMR production.
GSM analysis was used to screen prebiotic candidates for KZ. Metabolic models were constructed for three representative hydrogen-producing rumen bacteria (R. albus, R. flavefaciens, and B. fibrisolvens), five methanogenic archaea (M. ruminantium, M. gottschalkii, M. smithii, M. olleyae, and M. millerae), and the KZ strains. The uptake states of potential substrates were compared across these models (Fig. 1).
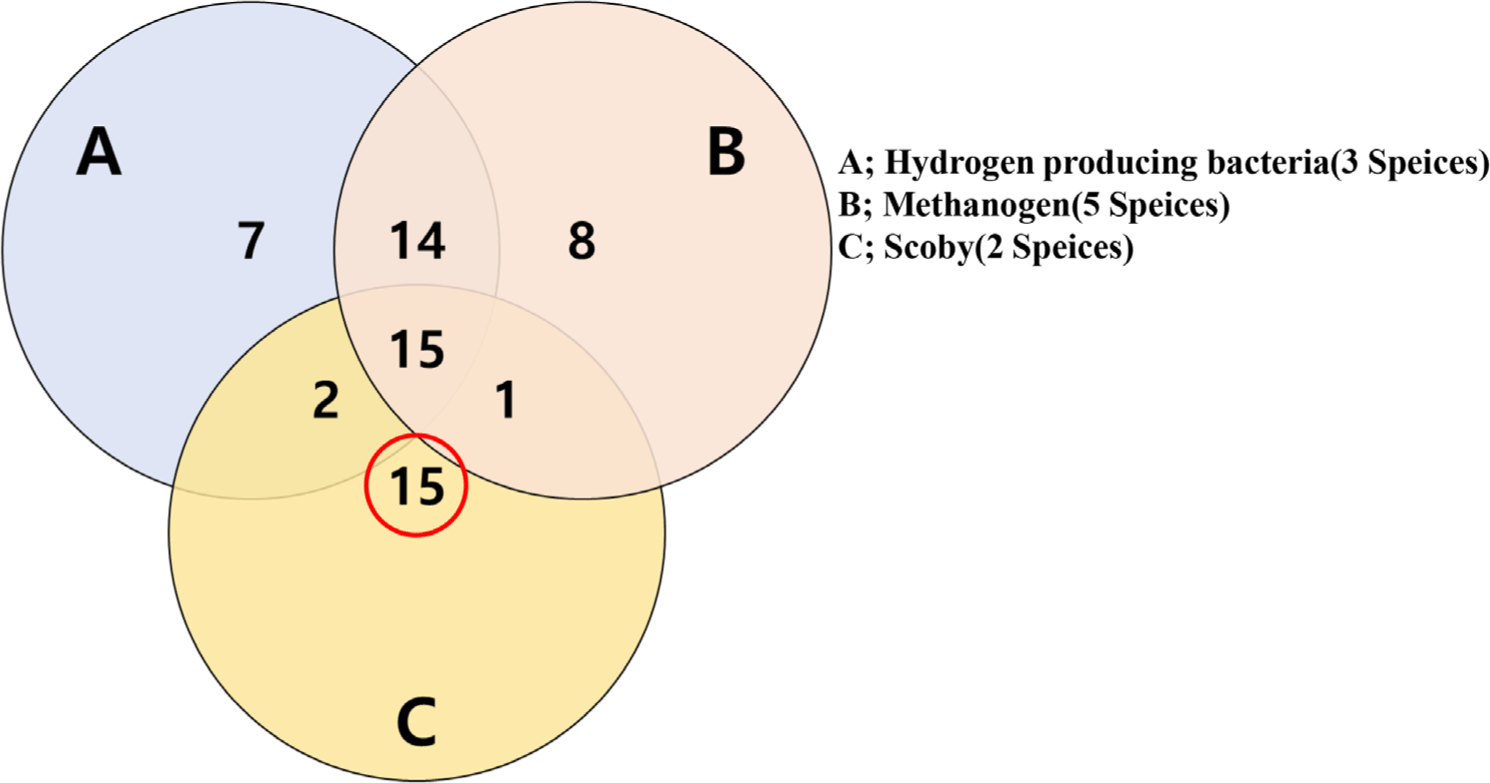
A total of 15 compounds were identified that were utilized exclusively by KZ but not by the hydrogen-producing bacteria or methanogens (Fig. 1 and Table 3). These included small carbohydrates (e.g., glycerol and oleate), cofactors (e.g., menaquinone-7, CoA, and Fe3), and several dipeptides (e.g., Gly-Leu, Gly-Asn-L, and Gly-Met). To avoid redundancy, five representative compounds were selected based on predicted utilization rates, feasibility in cultivation, and commercial availability (Table 4): glycerol, oleate, menaquinone-7, Gly-Leu, and Gly-Asn-L. These were categorized into carbohydrates, vitamins/minerals, and amino acids, and subsequently used in in vitro microbial studies.
1) Hydrogen producing bacteria (Ruminococcus albus, Ruminococcus flavefaciens, and Butyrivibrio fibrisolvens).
Table summarizes metabolites predicted to be selectively utilized by KZ (Komagataeibacter intermedius, Zygosaccharomyces parabailii) but not by hydrogen-producing bacteria or methanogens, as determined via genome scale metabolic (GSM) modeling on the KBase platform. The listed compounds include carbohydrates, minerals, and amino acids, with their molecular formulas, uptake states (g/μmol), and excretion statuses.
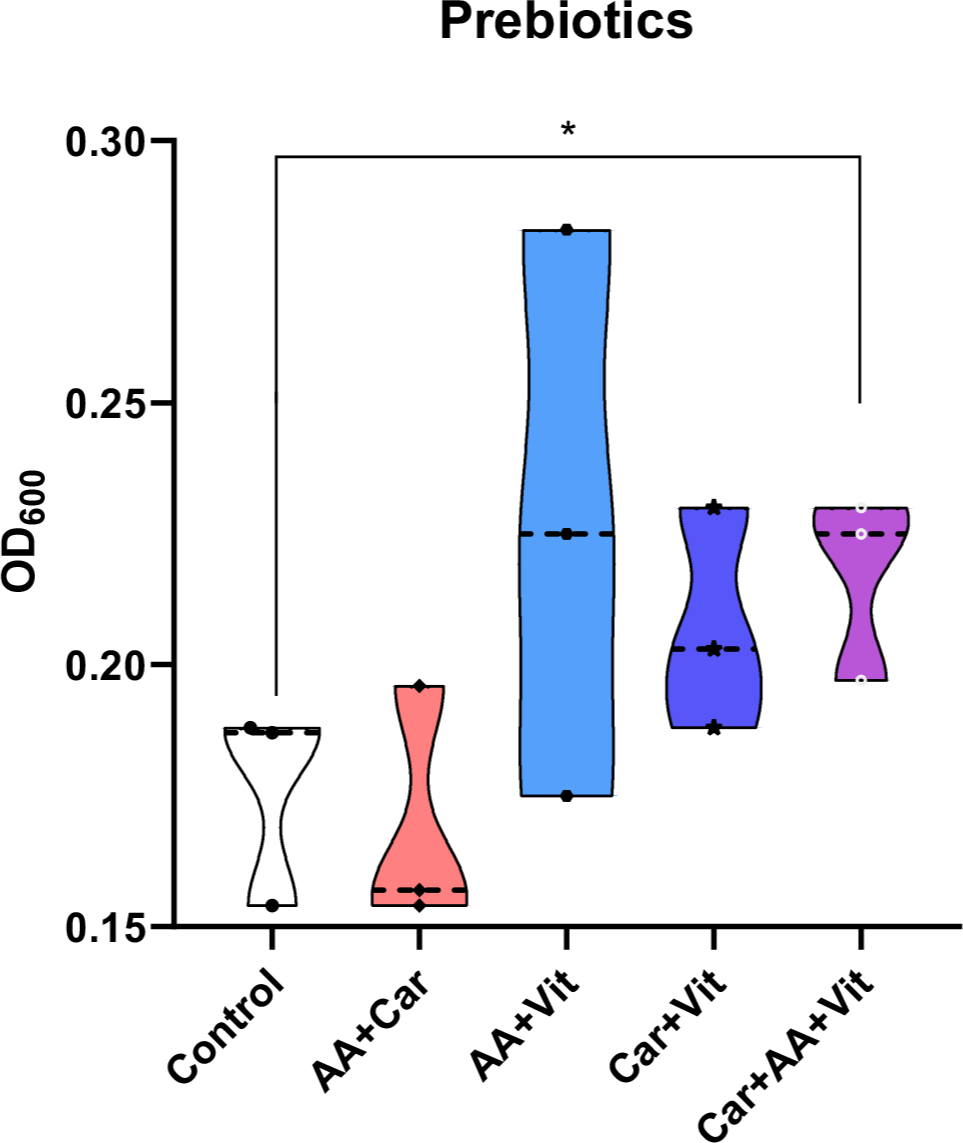
To assess the growth-promoting effects of the selected prebiotics, KZ cultures were grown under four supplementation conditions: amino acids + carbohydrates (AA + Car), amino acids + vitamin (AA + Vit), carbohydrates + vitamin (Car + Vit), and a mixed group containing all three (Car + AA + Vit). Concentrations were standardized (e.g., glycerol 0.555 g/L, oleate 12 mL/L, Gly-Leu 0.04 g/L, Gly-Asn-L 0.011 g/L, and menaquinone-7 0.1 mg/L).
The Car + AA + Vit group showed a significant increase in absorbance compared to the control group (0.217 ± 0.020 vs. 0.176 ± 0.022; p < 0.05; Fig. 2). The AA + Vit and Car + Vit groups exhibited non-significant upward trends. Overall, supplementation with the mixed prebiotics effectively promoted the growth of KZ.
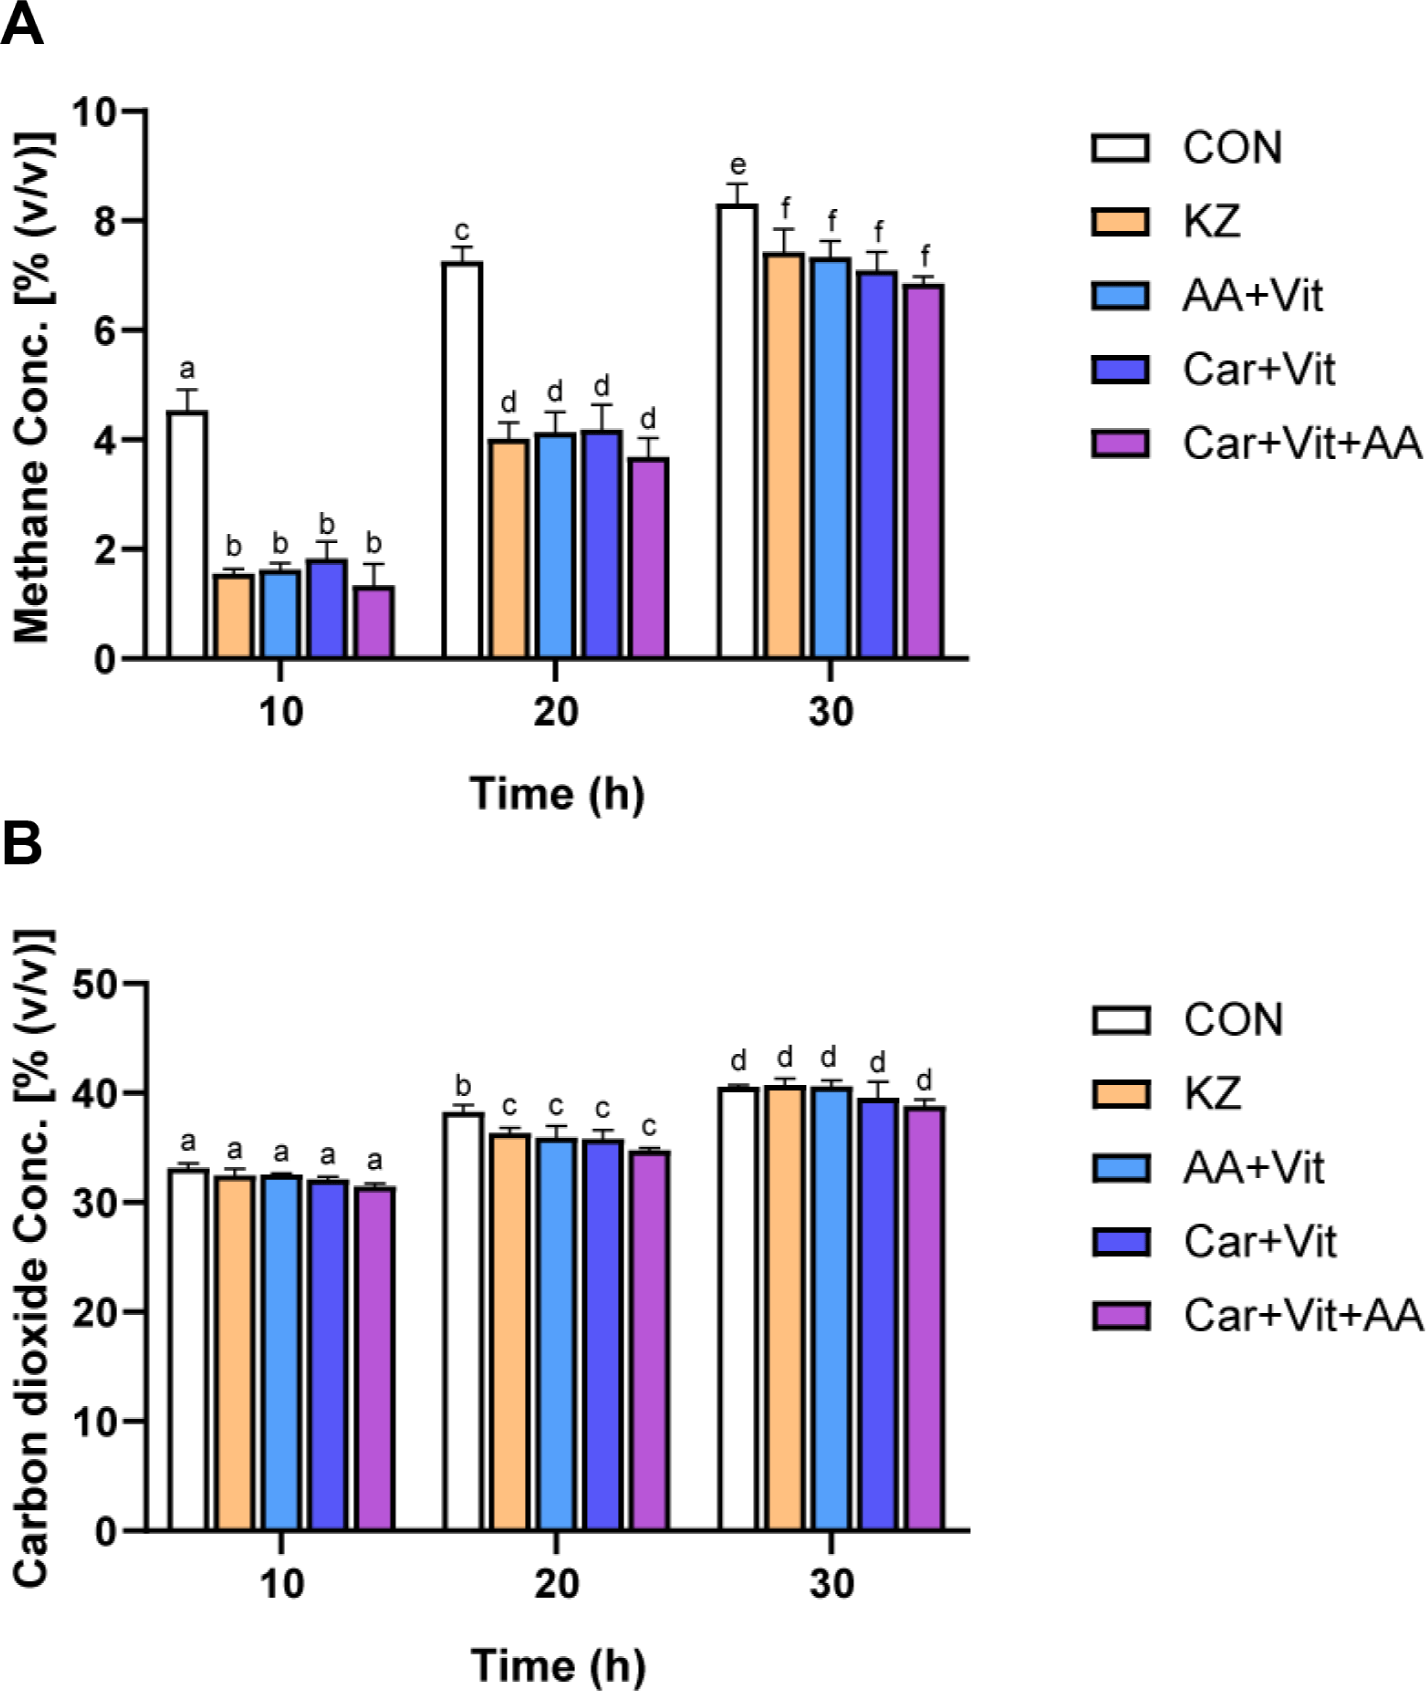
To evaluate methane-reduction efficacy prior to FTMR application, an in vitro rumen fluid fermentation assay was conducted. Experimental groups included a control without additives, KZ alone, and KZ combined with different prebiotics (AA + Vit, Car + Vit, Car + AA + Vit). Methane concentrations (% v/v) increased over time in all groups; however, synbiotic-treated groups consistently produced less methane than the control group (Fig. 3). The Car + AA + Vit group showed the greatest suppression (70.5% and 49.2% reduction at 10 and 20 h, respectively; p < 0.05 vs. controls), with borderline significance compared to the SCOBY group (p = 0.0869). Other groups (AA + Vit, Car + Vit, and SCOBY) showed reductions ranging from 59 to 66%. Carbon dioxide concentrations also increased across all groups, but synbiotic supplementation consistently lowered CO₂ production relative to the controls (p < 0.01).
Based on the in vitro rumen fluid fermentation assay, the combined prebiotic treatment (Mix) demonstrated the strongest growth-promoting and methane-reducing effects. Accordingly, the synbiotic mixture composed of KZ, amino acids, vitamins, and carbohydrates (KZ + AA + Vit + Car) was incorporated into the FTMR to provide methane-mitigating functions. TMR was supplemented with synbiotics at three concentrations (CON, 5% Mix, and 10% Mix) and fermented anaerobically for 0, 7, and 14 d.
Following supplementation, pH values were monitored to assess acidification patterns (Table 5). The initial pH of the control group was 5.20, whereas the 5% Mix and 10% Mix groups showed significantly lower values of 5.11 and 5.02, respectively (p < 0.05; Table 5). As fermentation progressed, pH declined across all treatments, but the rate and extent of acidification varied. On day 7, the 10% Mix group exhibited a higher pH (4.92) than the controls (4.86), and by day 14, the 5% Mix group (4.73) remained significantly higher than the controls (4.66) (p < 0.05). These results indicate that synbiotic supplementation moderates the rate of acidification during fermentation.
| Days of ensiling | Treatments1) | ||
|---|---|---|---|
| CON | 5% Mix | 10% Mix | |
| 0 | 5.20 ± 0.03a | 5.11 ± 0.01b | 5.02 ± 0.00c |
| 7 | 4.86 ± 0.01a | 4.75 ± 0.11ab | 4.92 ± 0.03b |
| 14 | 4.66 ± 0.03a | 4.76 ± 0.04b | 4.72 ± 0.08ab |
Metabolite profiling was conducted to evaluate the effects of synbiotic supplementation on fermentation dynamics (Fig. 4). At day 0, sucrose, glucose, and fructose concentrations were high across all groups but declined rapidly. By day 7, sucrose and fructose were below the detection limit in all treatments. At day 14, the 10% Mix group retained the highest glucose concentration (3.23 g/L), while the controls showed the lowest (1.78 g/L); however, no statistically significant difference was observed (p > 0.05).
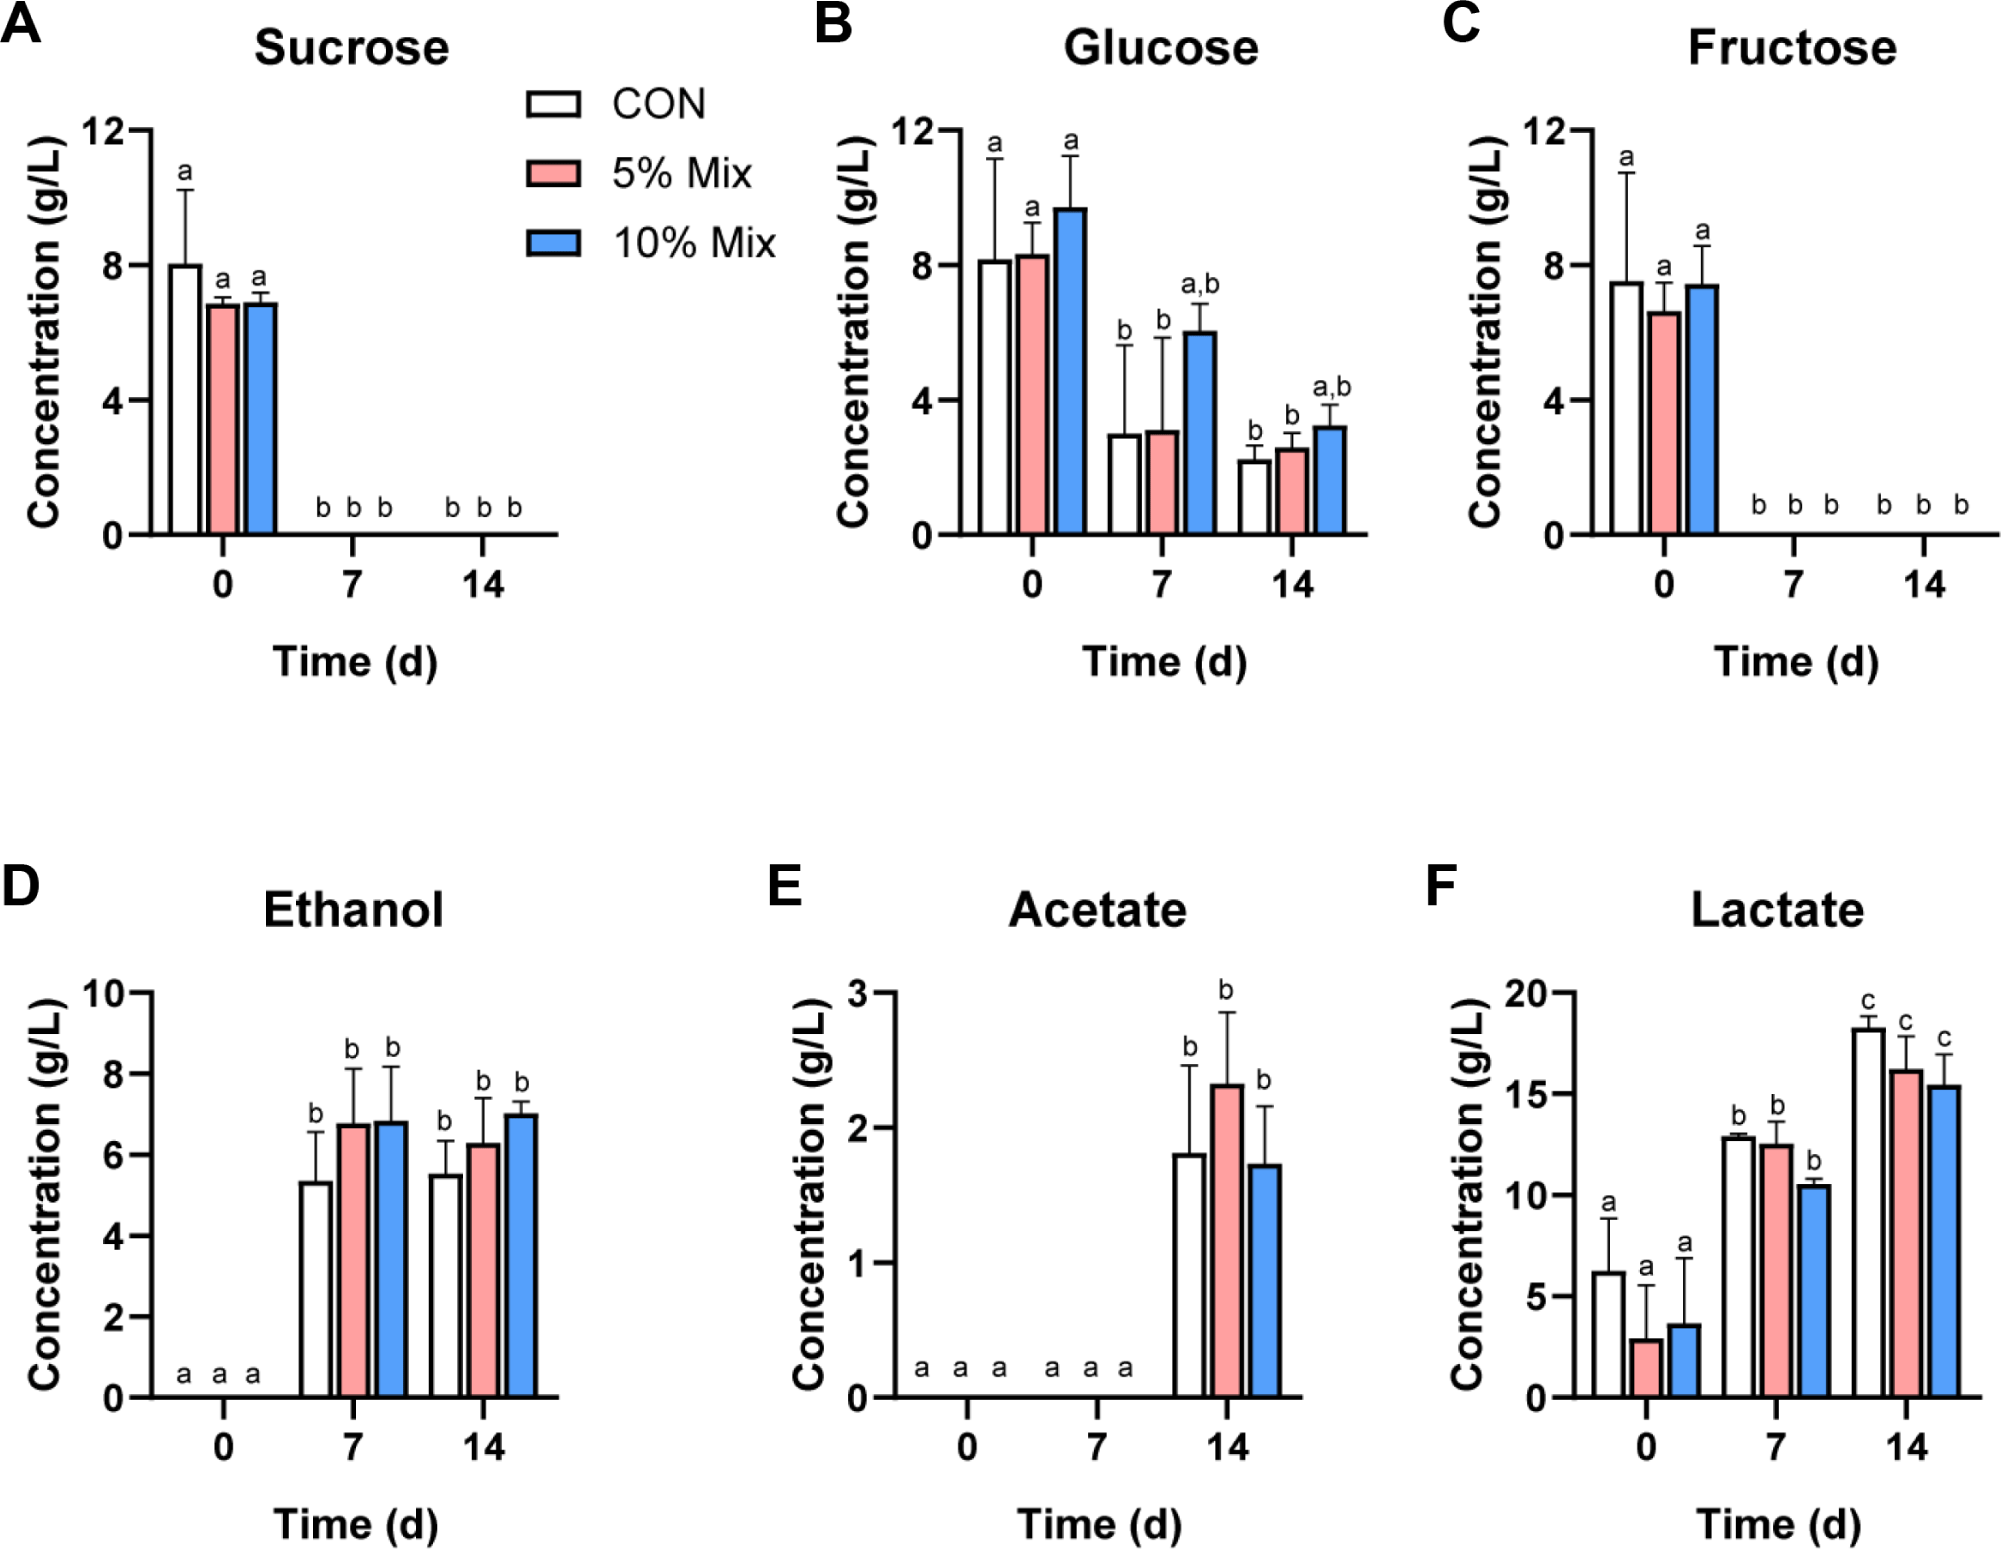
Organic acids and ethanol were also measured. Acetate concentrations remained low during the first 7 d but increased significantly by day 14. The levels in the 5% Mix group (2.33 g/L) tended to be higher than those in the controls (1.84 g/L) and 10% Mix (1.73 g/L), although the differences were not statistically significant. Lactate concentrations steadily increased across all groups, with no significant treatment differences. Ethanol levels significantly increased over time, peaking in the 10% Mix group (7.25 g/L) at day 14. These findings suggest that synbiotic supplementation modulated carbon metabolism and microbial activity during anaerobic storage.
Viable counts of bacteria and fungi were monitored over 14 d (Fig. 5). At day 0, bacterial and fungal counts did not differ among controls, 5% Mix, and 10% Mix (p > 0.05).
By day 7, bacterial populations increased significantly in all groups (Log CFU/g, p < 0.05), with the 10% Mix group showing the greatest increase throughout fermentation. The 5% Mix group displayed moderately higher counts at day 7, but by day 14, levels were lower than those of the 10% Mix group.
Fungal populations followed a similar pattern: all groups showed significant increases from day 0 to day 7 (p < 0.05). Beyond day 7, fungal counts plateaued, with no further differences among treatments at day 14. All groups maintained elevated fungal levels during later fermentation stages. Overall, synbiotic supplementation, particularly at the highest concentration, significantly stimulated bacterial growth throughout fermentation, while fungal populations increased early and stabilized regardless of treatment.
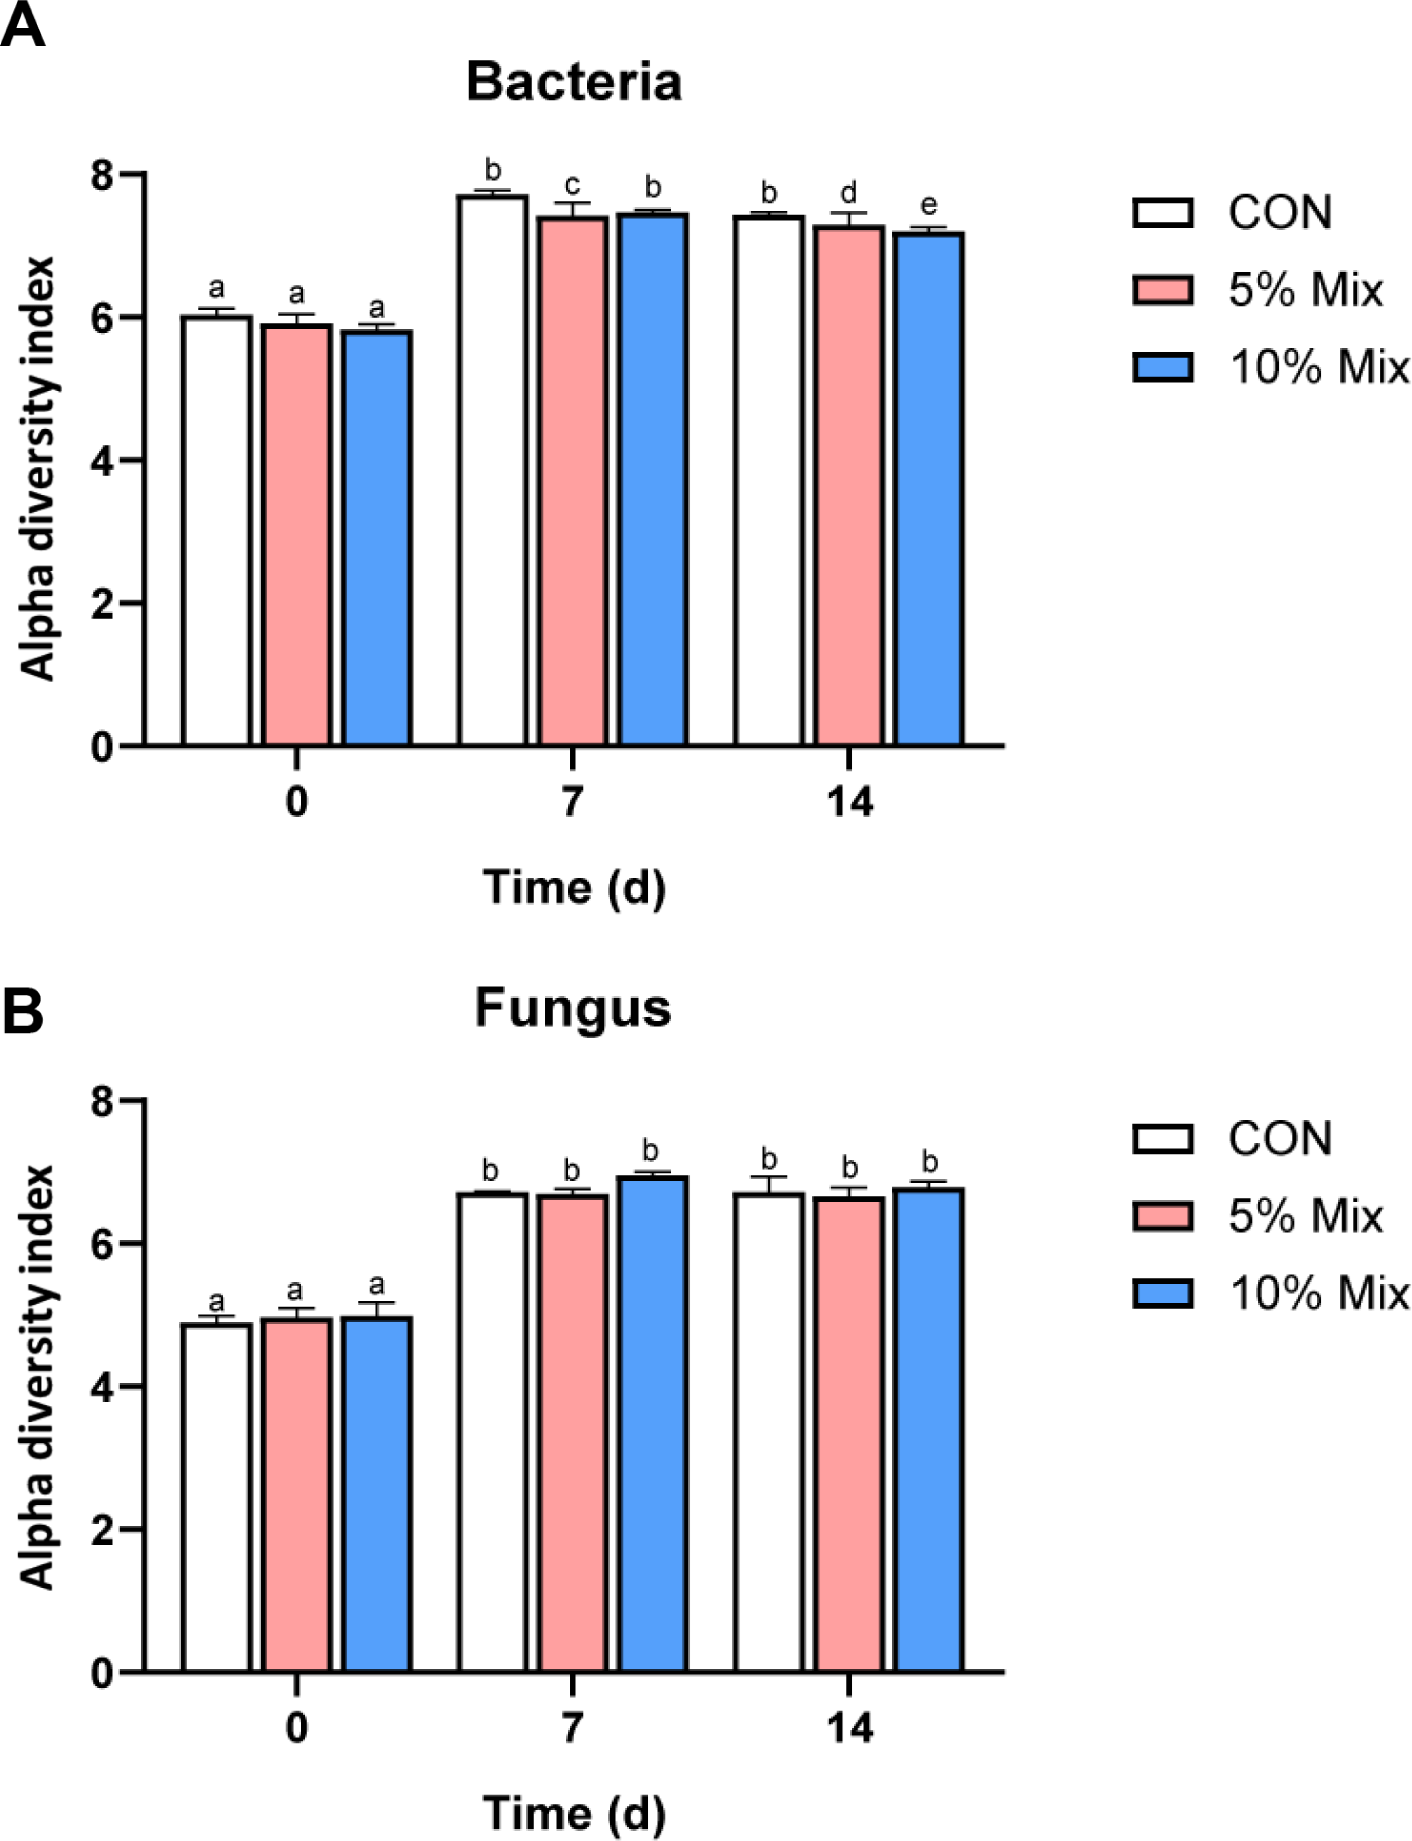
The α-diversity of bacterial and fungal communities was assessed using the Shannon and Gini-Simpson indices, which revealed temporal variation associated with fermentation time and synbiotic supplementation (Table 6). Across the fermentation period, the diversity of both bacteria and fungi decreased, indicating ecological succession from an initially heterogeneous community to a more specialized consortium adapted to prolonged anaerobic conditions. The control group generally exhibited lower diversity, whereas the 10% Mix group tended to maintain higher diversity throughout fermentation. Although the differences were not statistically significant, the trends implied that synbiotic supplementation may support a more diverse and stable microbial network through enhanced trophic and metabolic interactions.
| Index | Days of ensiling | Treatment1) | ||
|---|---|---|---|---|
| CON | 5% Mix | 10% Mix | ||
| Shannon | 0 | 6.13 | 6.27 | 6.49 |
| 7 | 2.04 | 2.38 | 3.24 | |
| 14 | 2.68 | 3.08 | 3.15 | |
| Gini-Simpson | 0 | 0.93 | 0.95 | 0.96 |
| 7 | 0.61 | 0.67 | 0.79 | |
| 14 | 0.71 | 0.80 | 0.82 | |
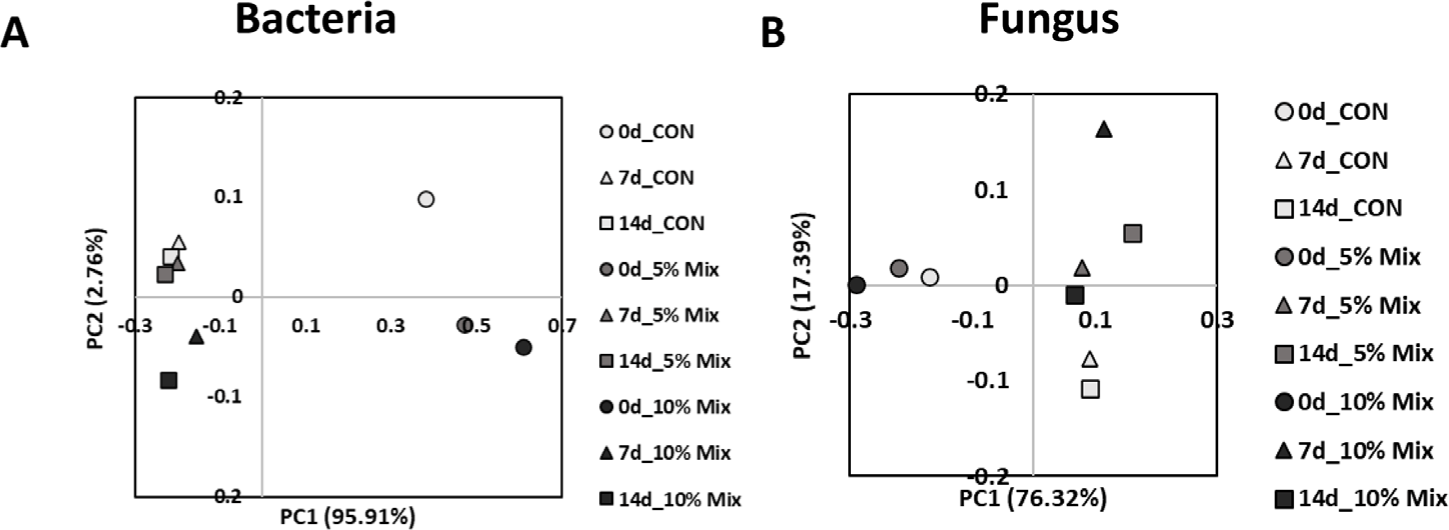
β-diversity, assessed using principal coordinate analysis (PCoA; Fig. 6), revealed distinct trajectories for bacterial and fungal communities. For bacteria, Principal Component 1 (PC1) explained 95.91% of the variance, separating samples primarily by fermentation stage rather than treatment. The 10% Mix group had the highest PC1 score at day 0, reflecting a more heterogeneous and metabolically active bacterial composition early in fermentation. Over time, bacterial communities shifted toward negative PC1 values. Fungal communities (PC1 = 76.32%) displayed the opposite trend, clustering at negative PC1 initially but progressing toward positive PC1 by day 14. This pattern implies replacement of early facultative yeasts by stress-tolerant taxa. The 10% Mix group showed the largest displacement along PC2 at day 7, indicating pronounced fungal restructuring, likely driven by synergistic bacterial–fungal interactions that enhanced carbon metabolism and fermentation stability.
At the phylum level (Fig. 7A), bacterial communities initially included Bacillota (formerly Firmicutes), Actinomycetota, Cyanobacteriota, and Pseudomonadota. The 10% Mix group exhibited high baseline abundances of Cyanobacteriota (29.9%) and Pseudomonadota (32.9%). As fermentation progressed, Bacillota rapidly increased, becoming dominant (> 90%) in all groups by day 14. In fungal communities (Fig. 7B), Ascomycota was dominant at baseline, but unclassified fungal taxa increased significantly in synbiotic-treated groups. By day 7, the 10% Mix group reached 40.9% unclassified taxa, while the 5% Mix group peaked at 43.0% by day 14.
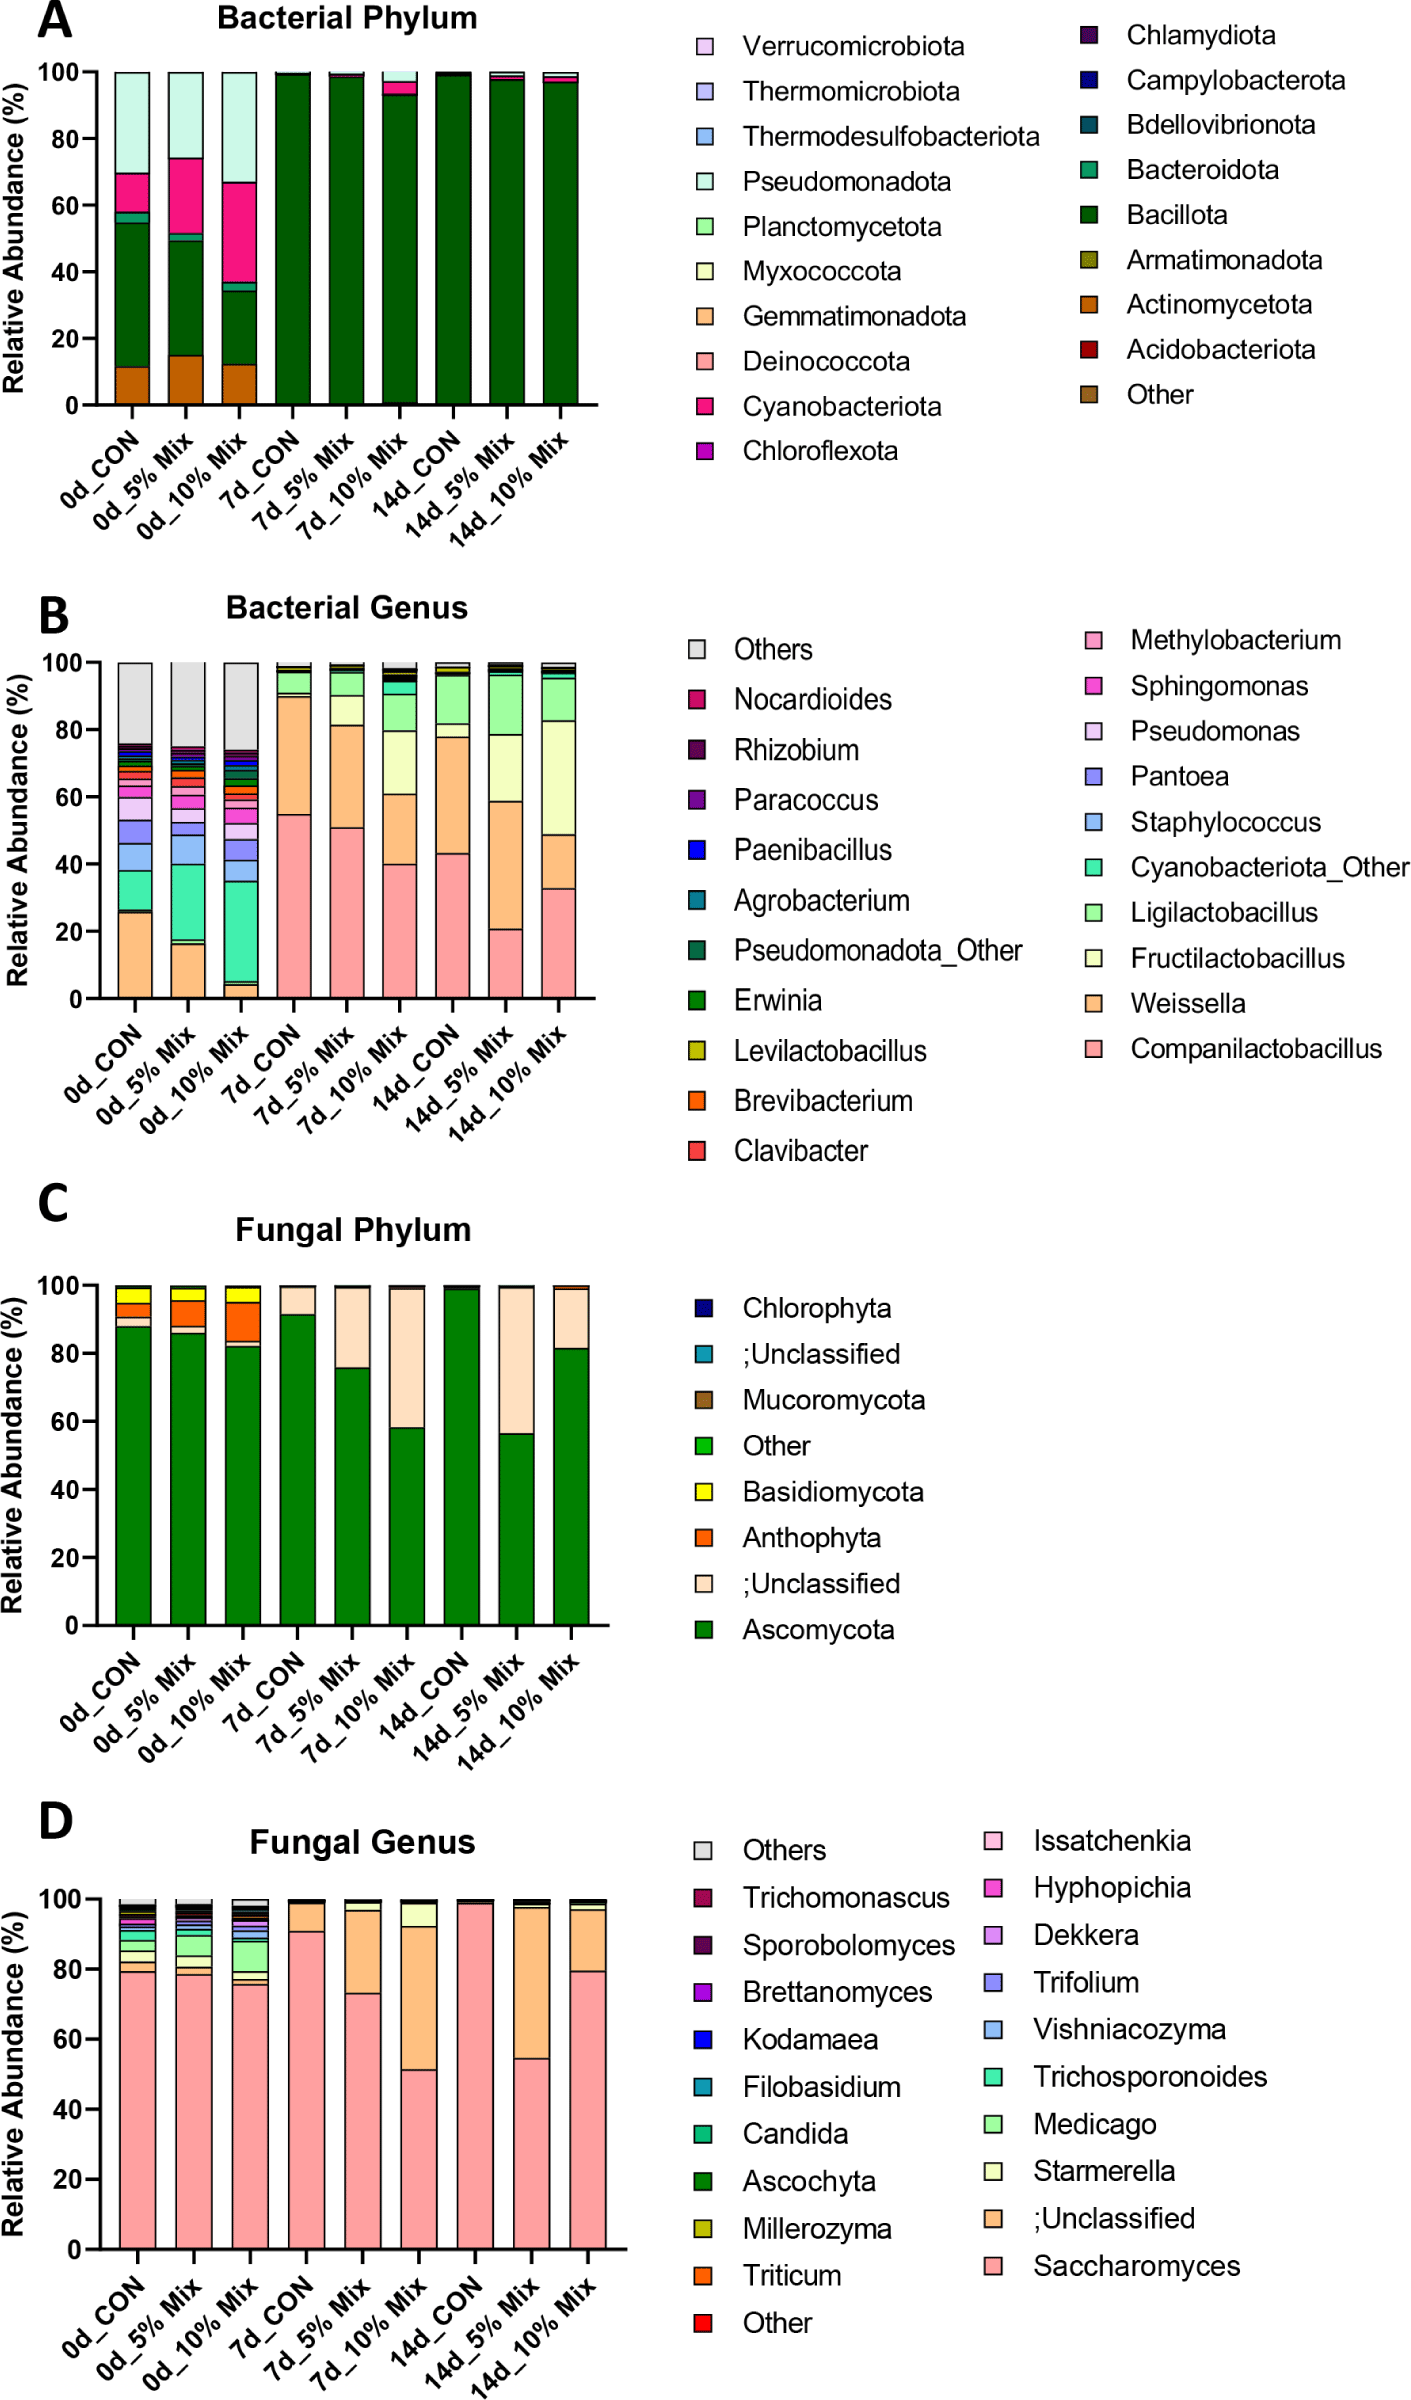
At the genus level (Fig. 7C), bacterial communities before fermentation included Weissella, Staphylococcus, Pantoea, and Pseudomonas. During fermentation, the levels of LAB such as Companilactobacillus, Fructilactobacillus, Ligilactobacillus, and Levilactobacillus increased markedly. By day 14, Fructilactobacillus dominated the 10% Mix group (33.9%, Fig. 6E). At the species level, early communities were dominated by Weissella jogaejeotgali and unclassified Cyanophyceae species, particularly in the 10% Mix group. These taxa were gradually replaced by LAB species such as Companilactobacillus nuruki and Fructilactobacillus fructivorans. Spoilage-associated species, including Staphylococcus saprophyticus and Pantoea agglomerans, decreased markedly over time.
Among fungal communities (Fig. 7D), Saccharomyces initially dominated all groups (75%–79%). While Saccharomyces remained dominant in the control group, the 5% and 10% Mix groups developed more diverse fungal profiles. Non-Saccharomyces genera such as Starmerella, Trichosporonoides, and Brettanomyces were consistently detected in synbiotic-treated groups, indicating broader and more diverse fungal compositions compared to the controls.
DISCUSSION
Methane is one of the most problematic greenhouse gases emitted by the livestock industry. Efforts to reduce methane emissions have been ongoing for decades and are essential for achieving sustainable livestock production. To this end, various compounds and probiotics have been incorporated into feed formulations to mitigate emissions. In this study, we propose synbiotics-based FTMR as a potential strategy for enteric methane reduction. GSM-based prebiotic prediction was used to compare the metabolic networks of methanogens, hydrogen-producing bacteria, and SCOBY (K. intermedius and Z. parabailii). We identified substrates that the SCOBY community (KZ strains) could selectively utilize, but which were not accessible to methanogens or hydrogen-producing bacteria, making them suitable as prebiotics. These candidates promoted the growth of target microorganisms with methane-mitigating potential, and their combination as synbiotics effectively reduced methane production in vitro. The compounds identified through GSM screening (glycerol, oleate, menaquinone-7, Gly-Leu, and Gly-Asn-L) enhanced the growth and metabolic activity of KZ, with combined treatments showing stronger growth-promoting effects than single substrates. This finding is consistent with recent studies demonstrating that GSM models can predict substrate utilization by specific microbial strains and selectively enhance their growth [20]. For example, one study predicted and experimentally validated four compounds (L-serine, L-threonine, D-mannitol, and γ-aminobutyric acid) specifically utilized by target Pseudomonas strains based on GSM [21]. This approach, however, has limitations. GSM predicts fluxes using static genome-based networks, and its accuracy depends on genome annotation quality, gap-filling, and environmental parameter settings [22]. In this study, the predicted uptake and metabolic profiles of candidate compounds were not experimentally validated, underscoring the need for recalibration and further testing, such as isotope tracing [23,24]. In addition, the experiment was conducted under static in vitro conditions (green tea-based medium, 25°C, 14 d of stationary incubation), which cannot fully replicate the dynamic rumen environment. Although the in vitro results demonstrated methane reduction, the stability and efficacy of this mitigation strategy must be confirmed in vivo.
The pH is a critical indicator of feed quality, as inappropriate values can affect stability, storability, and digestibility in ruminants. After 14 d of fermentation, the synbiotic-treated feed had a higher pH than that of the untreated control feed. A recent study similarly reported that the pH of silage containing yeast varied significantly with the yeast content and storage period. The addition of yeast and prebiotics to the FTMR can modulate fermentation dynamics, often stabilizing or elevating pH without compromising quality or aerobic stability. Importantly, excessively low pH (< 4.2) may indicate over-acidification and potential palatability issues [25], whereas moderately higher pH values (4.5–4.8) are generally associated with optimal lactic acid fermentation, improved aerobic stability, and reduced spoilage by undesirable microorganisms [26].
Furthermore, to investigate metabolic changes during fermentation, we analyzed metabolites in FTMR. We observed increased levels of acetic acid and ethanol accompanied by a decrease in lactic acid. The Z. parabailii strain used in this study is resistant to lactic acid and versatile in carbohydrate metabolism, enabling ethanol production under variable conditions. This observation is consistent with reports that K. intermedius strains efficiently oxidize ethanol to acetate [27]. It should be noted that methane production was not directly measured in the FTMR experiment; therefore, a direct causal link between FTMR fermentation and methane reduction cannot be established. To date, direct evidence linking SCOBY or kombucha-derived microbial consortia to enteric methane mitigation remains limited. Nevertheless, the functional characteristics of SCOBY- particularly the synergistic interaction between yeasts and acetic acid bacteria – suggest potential relevance to methane reduction mechanisms. Our findings further support this notion, as the synbiotic intervention reshaped the fermentation profile by increasing ethanol and acetate concentrations. From a thermodynamic perspective, ethanol functions as an electron carrier serving as an alternative metabolic hydrogen (H2) sink, diverting reducing equivalents away from the CO2 reduction pathway utilized by hydrogenotrophic methanogens [8,28]. Furthermore, yeast supplementation has been shown to stimulate acetate-producing bacteria that competitively consume H2, thereby suppressing methanogenesis [29]. Within this context, competition among functional microbial groups for shared substrates such as H2 can lead to competitive exclusion between methanogens and alternative hydrogenotrophs [30], suggesting that the yeast-LAB consortium introduced via FTMR may limit substrate availability for hydrogenotrophic methanogens, thereby indirectly restricting methanogenic proliferation through multi-layered microbial interactions [31,32].
The impact of synbiotic treatment on microbial community structure in fermented feed was also evident. Integrated multi-omics analyses have shown that the emergence and persistence of specific beneficial bacteria are critical for maintaining fermentation quality and stability, underscoring the functional importance of core microbiomes [33]. Bacterial and fungal populations play complementary roles in fiber degradation, substrate transformation, and the modulation of rumen fermentation dynamics. Dominant bacterial taxa such as Fructilactobacillus, Companilactobacillus, and Weissella primarily drive lactic acid production and contribute to pH stabilization. Fungal members, particularly yeasts, including Zygosaccharomyces, Starmerella, Brettanomyces, and filamentous forms, are pivotal in depolymerizing complex polysaccharides and generating growth factors or cross-feeding metabolites such as ethanol, CO2, and vitamins that sustain bacterial growth through syntrophic interactions [34]. This consortium mirrors the native rumen ecosystem, in which anaerobic fungi (e.g., Neocallimastrix spp.) and yeasts act synergistically with prokaryotes to optimize fiber degradation and harvest energy [35].
In this study, the early stage of fermentation was characterized by diverse genera, including Weissella, Pantoea, and Staphylococcus. As fermentation progressed, communities became increasingly dominated by LAB, particularly Companilactobacillus and Fructilactobacillus. This succession reflects established trends in silage and fermentation research: heterogeneous early populations transition into LAB-centered communities under selective fermentation conditions [36]. The accelerated proliferation of LAB in synbiotic treatments may stem from their competitive advantage under the prevailing substrate composition. Notably, Fructilactobacillus exhibits high fermentation efficiency on fructose- and sucrose-rich substrates, supporting its late-stage dominance in the 10% Mix group [37]. Non-Saccharomyces yeasts such as Starmerella and Brettanomyces also contributed to ethanol and acetic acid production, influencing overall metabolic flux through cross-feeding interactions with LAB. Previous studies on kombucha fermentation have shown that yeast–acetic acid bacteria interactions underpin the pH and organic acid balances that drive microbial succession and metabolic outcomes [38].
Our findings imply that synbiotic intervention not only promotes the predominance of beneficial LAB strains but also reorganizes complex interdomain microbial networks, ultimately improving fermentation quality under the present in vitro conditions.
While the in vitro results provide mechanistic insight into the synbiotic’s potential, several limitations must be acknowledged. Batch culture systems cannot fully replicate the dynamic rumen environment, including continuous digesta passage, salivary buffering, and complex host-microbe interactions. Consequently, the observed reductions in methane production and shifts in fermentation profiles should not be directly extrapolated to in vivo conditions without further validation. Future research should therefore prioritize longitudinal in vivo trials to confirm the sustained efficacy of synbiotic FTMR on methane yield and animal performance, ensuring the practical applicability of this approach in commercial livestock production. The present study was intentionally scoped to fermentation quality characterization, and the direct evaluation of FTMR-associated methane mitigation in vitro and in vivo is reserved for future investigation.
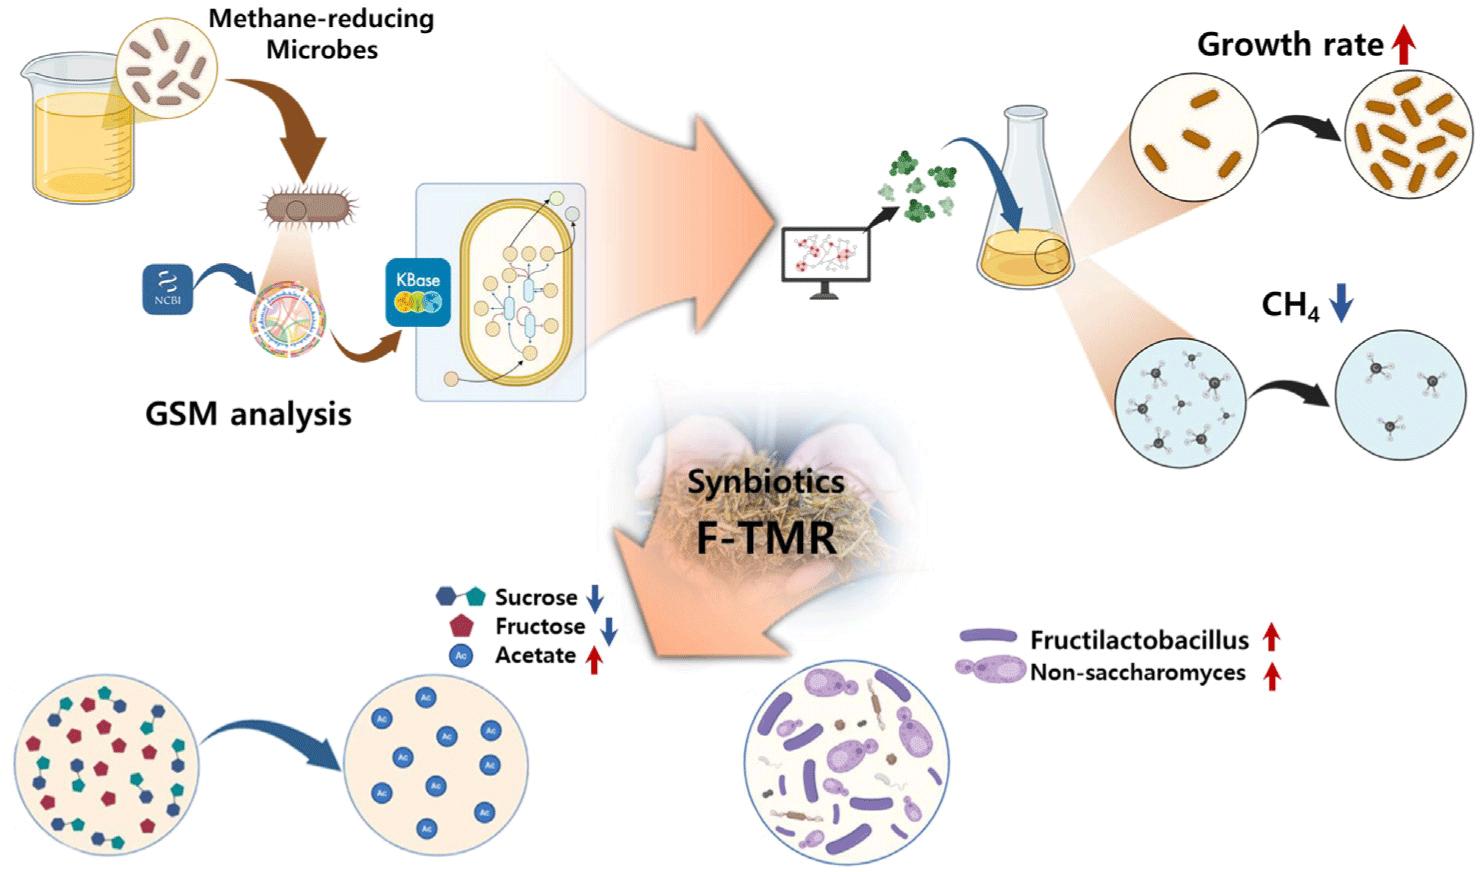
In summary, synbiotic supplementation enhanced fermentation quality, as evidenced by stabilized pH, distinctive organic acid profiles, and marked shifts in microbial community structure. Synergistic interactions between LAB and yeasts contributed to a more stable fermentation environment and facilitated the predominance of beneficial microorganisms. These findings suggest that strategic reconstitution of the microbial community through synbiotics holds promise as an approach to mitigate enteric methane emissions (Fig. 8), though further in vivo validation is needed to confirm these promising findings.