
Background
Poultry producers face serious losses when chickens are exposed to adverse environmental conditions such as the presence of infectious agents, extreme temperature (heat or cold), poor air quality, environmental contaminants, and other conditions such as light and diet also may influence the health status of poultry [1]. Low ambient temperature is one of the most significant environmental stressors and can significantly affect the health and welfare of poultry [2]. Low ambient temperature occurs when the surrounding temperature falls below 8°C to 12°C [3,4]. The body may not be able to warm itself, and serious cold-related illnesses, permanent tissue damage, and death may occur as a result of low ambient temperature [4]. Low ambient temperatures increase feed intake, but decrease the growth potential of laying hens and Japanese quails [5-8]. Similar to cold stress, serum corticosterone, blood glucose and cholesterol levels increased significantly [9,10]. Insulin and corticosterone are well known to be temperature-sensitive and important hormones that control nutrient metabolism [11]. Voluntary feed intake and the consequent productivity of animals depends largely on various animal and environmental factors, and feed energy density is considered as the most important factor that influences voluntary feed intake [12]. Moreover, from an economic standpoint feed represents the largest portion of total animal production costs; therefore, the accurate estimation of feed energy values is crucial for realizing optimal animal production [12]. Animals are known to adjust the daily feed intake containing various concentrations of energy to maintain a constant daily energy intake [13-14]. Current metabolizing energy dietary requirements for ducks are estimated to be 3,000 kcal AME/kg [15]. One of the limitations of elucidating the relationship between low ambient temperature and duck growth performance is how to express dietary energy concentrations. The objective of this study, therefore, was to investigate whether level of dietary energy would counter the positive effects of cold stress on growth performance, plasma corticosterone, and intestinal morphology.
Methods
The protocol for this experiment was reviewed and approved by the Institutional Animal Care and Welfare Committee of the National Institute of Animal Science, Rural Development Administration, Korea.
A total of 500, 21-day-old Pekin Ducks (initial BW [body weight] = 1,089 ± 5.21 g) were evenly assigned to five dietary treatments (2,950, 3,000, 3,050, 3,100, or 3,100 kcal AME/kg). There were four replicates of each treatment, each consisting of 25 ducks in a pen. All birds were fed a common starter diet from 0 to 20 d of age and an experimental diet during the experimental period from 21 to 42 d. A commercial type basal diet was formulated to meet or exceed the nutrient recommendations of the National Research Council [15] for ducks (Table 1). Till the end of this experiment, the average ambient temperature and relative humidity inside the house were recorded 8 ± 2.1°C and 62.35 ± 2.7%. A 24-h light schedule was used throughout the entire experiment. Diet samples were analyzed for dry matter (DM, Method 930.15), ash (Method 942.05), ether extract (EE, Method 2003.03), and crude protein (CP, Method 990.03) [16]. Diet samples were also analyzed for apparent metabolizable energy (AME) using bomb calorimetry (Model 6400, Parr Instruments Co., Moline, IL, USA) with benzoic acid as the standard for calibration.
1) Provided per kilogram of the complete diet: vitamin A (vitamin A acetate), 12,500 IU; vitamin D3, 2,500 IU; vitamin E (DL-α-tocopheryl acetate), 20 IU; vitamin K3, 2 mg; vitamin B1, 2 mg; vitamin B2, 5 mg; vitamin B6, 3 mg; vitamin B12, 18 μg; calcium pantotenate, 8 mg; folic acid, 1 mg; biotin 50 μg; niacin, 24 mg.
Body weight gain (g; BWG) and feed intake (g; FI) were measured weekly. The feed conversion ratio (FCR) was calculated as the ratio of BWG to FI. BWG, FI, and FCR were corrected for dead birds.
Blood samples were collected from wing vein of randomly selected eight birds in each treatment using EDTA-treated BD Vacutainer® tubes and non EDTA-treated BD Vacutainer® tubes (Becton Dickinson, Franklin Lakes, NJ, USA). The whole blood samples were kept on ice and used for immediate analysis of hematology. Leukocytes (white blood cells, heterophils, lymphocytes, monocytes, eosinophils, basophils) were analyzed using Hemavet® Multispecies Hematology System (Drew Scientific Inc., Oxford, CT, USA). The H/L ratios were determined by dividing the number of heterophils by that of lymphocytes. Serum samples were obtained by centrifuging the samples for 20 min at 25,000 ×g and 4°C and were stored at -15°C. Total cholesterol, triglyceride, asperate aminotransferase (AST), alanine aminotransferase (ALT), and calcium in the serum were quantified using an ADVIA® 1650 chemistry system (Bayer Diagnostic, Puteaux, France).
Blood samples (Serum corticosterone) were collected from wing vein of randomly selected eight birds in each treatment using Vacutainer® tubes (Becton Dickinson, Franklin Lakes, NJ, USA) before morning feeding on d 0, 2, 4, 7, 14, and 21 of the experiment. Serum corticosterone was determined by enzyme-linked immunoassay (EIA). The EIA kits (Corticosterone EIA Kit, Assay Designs, Inc., Ann Arbor, MI, USA) were based on a sheep polyclonal antibody raised against corticosterone. This assay method has been compared directly with radioimmunoassay procedures (RIA), and precision and accuracy of the EIA assay have been shown to exceed that of RIA. The EIA procedure involved pipetting 10 μL of each serum sample into an Eppendorf tube® and adding 10 μL of steroid inhibitor buffer. The solution was then vortexed and all samples were brought to a 1:40 dilution using Tris buffer solution with sodium azide. An aliquot of each sample (100 μL) was pipetted into microtiter plate wells (coated with donkey-anti-sheep IgG) in duplicate. In addition, 50 μL of alkaline phosphatase conjugated with corticosterone and sheep polyclonal antibody was added to each well. After 2 h of incubation on a shaker (4,200 × g) at room temperature, plates were washed 3 times in Tris buffer solution containing detergents and sodium azide. A solution of o-nitrophenyl phosphate (200 μL) was added to each well and the plate was incubated for another hour (without shaking) at room temperature. The stop the reaction, 50 μL of trisodium phosphate solution, was added and absorbance was read spectrophotometrically (μQuant™ Microplate spectrophotometer, Bio-Tek Instruments, Inc., Winooski, VT, USA) at 450 nm. Standard curves and sample concentrations were calculated using KC junior Software (Bio-Tek Instruments, Inc.).
On d 7, d 14, and d 21, four birds (one bird per pen) were randomly selected from each treatment. Carcasses of the sacrificed birds were immediately opened and the entire intestine was removed aseptically. A 2-cm sample of the jejunum (midpoint between the bile duct entry and Meckel’s diverticulum) was collected. Each of these intestinal segments was flushed with physiological saline solution (0.9% NaCl) to remove intestinal contents, fixed in 10% neutral buffered formalin, and kept at 4°C prior to the microscopic assessment of intestinal morphology [17]. Formalin-fixed intestinal tissues were processed, embedded in paraffin wax, sectioned at 3 μm, and stained using the hematoxylin-eosin method. Histological sections were examined with a Nikon phase contrast microscope coupled with a Microcomp integrated digital imaging analysis system (Nikon Eclipse 80i, Nikon Co., Tokyo, Japan). Images were viewed using a 4x Eplan objective lens (40×) to measure morphometric parameters of intestinal architecture.
For this purpose, three favorably oriented sections cut perpendicularly from the villus enterocytes to the muscularis mucosa were selected from each animal, and two measurements were made of these sections. Villus height was estimated by measuring the vertical distance from the villus tip to the villus-crypt junction level for 10 villi per section. Crypt depth (the vertical distance from the villus-crypt junction to the lower limit of the crypt) was estimated for 10 corresponding crypts per section.
Differences in variables between ducks fed increasing amounts of AME were analyzed by ANOVA for completely randomized designs using the Proc MIXED procedure of SAS (SAS Institute, Inc., Cary, NC, USA). The UNIVARIATE procedure of SAS was used to identify outliers but none was found. The experimental unit for all data was the replicate, and dietary treatment was a fixed effect in the models. The LSMEANS procedure was used to calculate mean values. An orthogonal polynomial contrast test was performed to determine linear and quadratic effects of increasing AME concentrations in the diets. Significance and tendency for statistical tests were set at p < 0.05 and 0.05 ≤ p ≤ 0.10, respectively.
Results
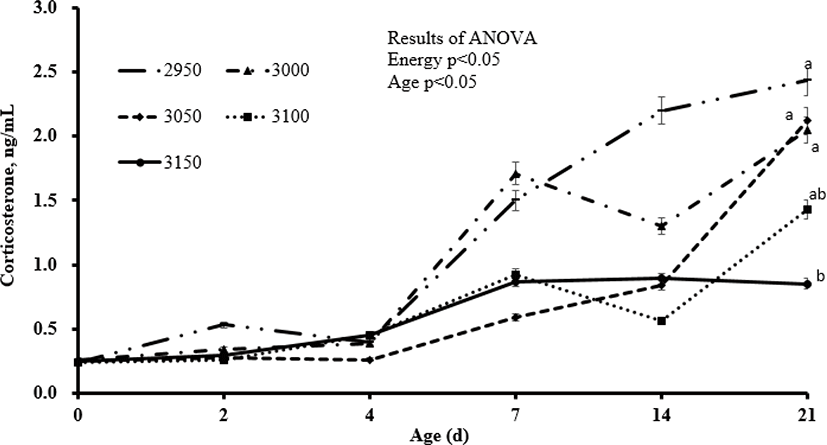
Overall, increasing inclusion of energy in the diets increased final body weight and body weight gain (linear, p < 0.01). Body weight gain was 2,182, 2,295, 2,362, 2,395, and 2,434 g for the respective increasing dietary energy levels from 2,950 to 3,150 kcal/kg hens, and these differences were statistically significant. Further, body weight of the 3,000, 3,050, 3,100, and 3,150 kcal/kg groups compared to the 2,950 kcal/kg group increased by 5.2%, 8.2%, 9.7%, and 11.5%, respectively. Correspondingly, feed intake decreased (linear, p < 0.01) with increasing inclusion level of dietary energy, and the FCR improved (linear, p < 0.01). The FCR of the other groups improved by 6.6%, 11.8%, 13.3%, and 15.1%, respectively, compared to the 2,950 kcal/kg group (Table 2). There were no significant differences in the level of leukocytes between different dietary groups (Table 3). Heterophils decreased (quadratic, p < 0.05) and lymphocytes increased (linear, p < 0.01) with increasing inclusion of energy in the diets. The H/L ratio also increased (linear, p < 0.01) as dietary energy was increased, and the mean H/L ratio was 0.99, 0.82, 0.71, 0.77, and 0.72 for the 2,950 to 3,150 kcal AME/kg groups, respectively. When compared to the 2,950 kcal ME/kg treatment, the H/L ratio of the other groups improved by 17.7%, 28.8%, 22.2%, and 27.3%, respectively. As expected, corticosterone values measured in the serum increased from 0 to 21 d, regardless of dietary treatments (Fig. 1). Increasing inclusion level of dietary energy corresponded to decreases (linear) in corticosterone in the serum of ducks exposed to low ambient temperature at 2 (p < 0.01), 7 (p < 0.05), 14 (p < 0.01), and 21 (p < 0.01) d. There were no significant differences in blood biochemistry (total cholesterol, glucose, calcium, AST, and ALT; Table 4) between groups. However, triglycerides increased (linear and quadratic, p < 0.05) with increasing inclusion level of energy in duck diets (258.0, 280.6, 273.3, 304.3, and 396.1 mg/dL for 2,950 to 3,150 kcal ME/kg, respectively). Compared to the 2,950 kcal ME/kg treatment, triglycerides increased by 8.8%, 5.9%, 17.9%, and 53.5%, respectively, for the 3,000-3,150 kcal AME/kg groups. There were no significant changes in villus height or crypt depth in the jejunum at 7, 14, or 21 d in the intestines of ducks exposed to low ambient temperature (Table 5).
Discussion
Results of feed intake are in agreement with [5] who have reported that low ambient temperatures (10.47±3.3°C) cause an increase in feed intake. Since low ambient temperature stress causes an increase in feed intake it is difficult to further increase feed intake at the dietary energy level as an index to improve the positive effect of cold stress. Therefore, under unfavorable causes such as paying excessive energy demand at low temperature. According to reports, weight gain is positively correlated with feed intake. Birds consumed more feed, resulting in higher weight gain and proved our observation [8]. Dietary fat supplementation has been shown to improve feed conversion and decrease feed intake of broiler chickens [18-23]. Doizer et al. [22] evaluated responses of broilers fed diets varying in AMEn from 3,175 to 3,310 kcal/kg during 30 to 59 d of age. It was determined that feed intake and feed conversion decreased linearly with AMEn content in these diets. Also, previous research has established that feeding broilers diets containing AMEn concentrations improved body weight [19-21,24]. These results agree with the results of Jensen et al. [25] who found an “extra caloric” effect for supplemented fat and suggested that wide caloric/protein ratios in poultry rations with additional fat can be used for maximum gain and feed efficiency. In concordance with other studies, in this study there were no significant differences in energy intake between the groups due to the decrease in feed intake with increasing dietary energy.
The H/L ratio has proved to be a valuable measurement in stress-related research in poultry [26-28], and it has been shown to be highly heritable [29] and a reliable index for determining stress in these birds [30]. Physiological and physical stressors increase the H/L ratio [31]. Hangalapura et al. [32] found a significant enhancing effect of low ambient temperature on in vitro lymphocyte proliferation. With respect to the H/L ratio, Hester et al. [33] also found that caged white leghorn hens exposed to a cold environment had a higher H/L ratio than those of the control hens. In relation to plasma corticosterone concentration (another stress indicator), Buckland et al. [34] reported that the application of cold stress resulted in significant increases in plasma corticosterone levels in chicks. Thus, blood parameters are good indicators of the physiological, pathological, and nutritional status of a bird, and changes in hematological parameters have the potential of being used to elucidate the impact of nutritional factors and additives supplied in diet on any living creature. Leukocyte counts also have been used as a measure of immune function in birds [35]. Many factors such as exposure to various microbes and chemicals substances can cause change in leukocytes [35]. The lack of adequate data on the influence of dietary level of energy of ducks exposed to low ambient temperature in altering blood parameters in poultry requires further research. Triglycerides are hydrophobic and can be stored in a very compact form [36]. In poultry, triglyceride are derived from exogenous de novo sources or from the conversion of glucose to fat. Therefore, triglyceride content is strongly influenced by the proportion of carbohydrates in the diet and the species’ response to lipolytic hormones, which affects the balance between lipolysis and esterification [37]. The marked increase in the percentage of triglycerides and phospholipids in the serum of ducks fed diets with an increasing amount of energy is thus likely caused by the high-energy diets suggesting a direct relationship between triglycerides and dietary energy content.
Crypth depth and villus height: crypth depth ratio was not influenced by increasing level of dietary energy. Development of intestinal morphology could reflect the health status of the GI tract of an animal. New epithelial cells are produced in the intestinal mucosal crypts and migrate along with the villus to the top [38]. As the intestines are a major site of enzymatic digestion and absorption of nutrients, absorption efficiency, and therefore FCR, is highly dependent on intestinal morphology [39]. The deeper the crypts, the faster the tissue rotates and the more likely the villus is renewed. This suggests that the host intestinal response mechanism attempts to compensate for the normal loss or atrophy of the villi due to inflammation by pathogens and their toxins [40]. Previous research have shown that the intestinal morphology, specifically structures such as villus, crypts and the thickness of mucosa, were altered by the composition of diet [41]. The increase in villus height and crypt depth is associated with healthy turnover of epithelial cell and active cell mitosis [42].
The results and ongoing discussion suggested that dietary increasing level of energy supplementation alleviates the adverse effect of cold induced stress and improved the production performance in pekin ducks. Additionally, 3,150 kcal/kg dietary energy had been revealed more beneficial and could be practiced as protective management for the pekin ducks reared under low ambient temperature.