RESEARCH ARTICLE

Signatures of positive selection underlying beef production traits in Korean cattle breeds

Zewdu Edea1https://orcid.org/0000-0003-2343-4832, Kyoung Sub Jung2https://orcid.org/0000-0002-9145-9794, Sung-Sub Shin3https://orcid.org/0000-0001-5684-6636, Song-Won Yoo3https://orcid.org/0000-0002-7650-0779, Jae Won Choi2https://orcid.org/0000-0002-9632-8179, Kwan-Suk Kim1,*https://orcid.org/0000-0002-5895-4398
Author Information & Copyright
1Department of Animal Science, Chungbuk National University, Cheongju 28644, Korea
2Institute of Livestock and Veterinary Research, Cheongju 28153, Korea
3Korea Institute for Animal Products Quality Evaluation, Sejong 30100, Korea
*Corresponding author: Kwan-Suk Kim, Department of Animal Science, Chungbuk National University, Cheongju 28644, Korea. Tel: +82-43-261-2547 E-mail: kwanskim@chungbuk.ac.kr

© Copyright 2020 Korean Society of Animal Science and Technology. This is an Open-Access article distributed under the terms of the Creative Commons Attribution Non-Commercial License (http://creativecommons.org/licenses/by-nc/4.0/) which permits unrestricted non-commercial use, distribution, and reproduction in any medium, provided the original work is properly cited.

Received: Oct 24, 2019; Revised: Mar 04, 2020; Accepted: Mar 15, 2020

Published Online: May 31, 2020

Abstract

The difference in the breeding programs and population history may have diversely shaped the genomes of Korean native cattle breeds. In the absence of phenotypic data, comparisons of breeds that have been subjected to different selective pressures can aid to identify genomic regions and genes controlling qualitative and complex traits. In this study to decipher genetic variation and identify evidence of divergent selection, 3 Korean cattle breeds were genotyped using the recently developed high-density GeneSeek Genomic Profiler F250 (GGP-F250) array. The three Korean cattle breeds clustered according to their coat color phenotypes and breeding programs. The Heugu breed reliably showed smaller effective population size at all generations considered. Across the autosomal chromosomes, 113 and 83 annotated genes were identified from Hanwoo-Chikso and Hanwoo-Heugu comparisons, respectively of which 16 genes were shared between the two pairwise comparisons. The most important signals of selection were detected on bovine chromosomes 14 (24.39–25.13 Mb) and 18 (13.34–15.07 Mb), containing genes related to body size, and coat color (XKR4, LYN, PLAG1, SDR16C5, TMEM68, CDH15, MC1R, and GALNS). Some of the candidate genes are also associated with meat quality traits (ACSF3, EIF2B1, BANP, APCDD1, and GALM) and harbor quantitative trait locus (QTL) for beef production traits. Further functional analysis revealed that the candidate genes (DBI, ACSF3, HINT2, GBA2, AGPAT5, SCAP, ELP6, APOB, and RBL1) were involved in gene ontology (GO) terms relevant to meat quality including fatty acid oxidation, biosynthesis, and lipid storage. Candidate genes previously known to affect beef production and quality traits could be used in the beef cattle selection strategies.

Keywords: Candidate genes; Korean cattle; Selection signatures; GGP-F250

INTRODUCTION

Cattle production in the Korean Peninsula has a long history, dates back to over 5,000 years [1]. Evidence on the origin and domestication of Korean cattle has been debatable. Genetic evidence based on mtDNA analysis has shown that Korean cattle are maternally traced back to taurine [2]. A genome-wide study using nuclear single nucleotide polymorphism (SNP) markers, however, have detected a substantial indicine introgression in Korean Hanwoo and Japanese Black cattle [3]. Korean indigenous cattle are characterized by different phenotypes and based on coat color phenotypes, which are broadly grouped into four sub-populations or breeds: Brown Hanwoo, Jeju Black, Black cattle (Heugu), and Brindle Hanwoo [1]. Of the four cattle breeds, the Brown Hanwoo is the predominant breed in terms of population size (3,000,000) and geographical distribution, whereas the population sizes of Chikso and Heugu were recently declined [4,5].

The national level genetic improvement program for carcass weight and marbling has been implemented for the Brown Hanwoo cattle for the few decades [1,6]. In line with the measurable changes achieved in growth traits over the last few decades, genome-wide selection scans and association studies of Korean cattle (Hanwoo) did detect putative candidate genes and quantitative trait locus (QTL) associated with carcass weight. For instance, QTL for carcass weight was reported on BTA4 and BTA14 (23–25 Mb) [79].

Unlike the Brown Hanwoo, the Black and Brindle cattle breeds have not been targets of strong artificial selection and improvement for specific beef traits; rather a selection against certain phenotypes (e.g., coat color) has led to a steep decline in their effective population sizes. The difference in the breeding programs and population history may have diversely shaped the genomes of Korean native cattle breeds. Assessment of the possible impacts of demographic events on the landscape of genetic diversity and population structure is of particular importance for the ongoing conservation program.

In the absence of phenotypic data, comparisons of breeds that have been subjected to different selective pressures can aid to identify genomic regions and genes controlling qualitative and complex traits. The commercial availability of a wide range of genome-wide SNP panels has been facilitated the fine mapping and detection of genes controlling complex quantitative traits. Previously selection signature scans and genome-wide association studies of Korean cattle have been employed Bovine SNP50 and high-density 777 K chips. In an attempt to identify signatures of divergent selection, we have genotyped three Korean cattle populations showing distinct phenotypes and subjected to different breeding programs using the recently developed GeneSeek Profiler F250 (GGP-F250) array [10].

MATERIALS AND METHODS

Three native Korean cattle breeds Brown Hanwoo (n = 24), Chikso (Brindle Hanwoo, n = 24) and Heugu (Black Hanwoo, n = 24) were sampled and genotyped with the GGP-F250 array, which contains 214677 SNPs. A GGP-F250 Bead Chip was built from diverse Bos taurus and Bos indicus breeds. The SNP markers were screened for the call rate > 90%, minor allele frequency (MAF) > 0.01 and call rate by sample > 90%. Following the application of the above quality control criteria, 108675 autosomal SNP markers were retained and used for downstream analysis.

Genetic diversity was estimated for each breed using PLINK [11]. Inbreeding coefficient and animal relatedness were estimated as the proportion identity-by-decent (IBD) between sample pairs within the breed as a PI_HAT value using the same package. A principal component analysis (PCA) was also performed on 108,675 SNPs using SNP and Variation Suite v8.5.0 (Golden Helix, Bozeman, MT, www.goldenhelix.com). Linkage disequilibrium (LD) was estimated between adjacent SNPs. Inter-SNP distances were binned into different categories and estimates of r2 were averaged for each inter-SNP distance category. Effective population size (Ne) in each breed was estimated from linkage disequilibrium using SNEP tool [12] with the default settings. Based on the population structure and PCA results, FST values were calculated between Hanwoo-Chikso, Hanwoo-Heugu, and Chikso-Heugu according to [13] in sliding windows of 20 SNPs. Windows of the SNP were used to minimize the stochastic effect of single SNP. Fst values were converted to a standard normal distribution (ZFst). The SNP windows that display high genetic differentiations (ZFst ≥ 5) were considered as candidates. Candidate genes within the top ZFst values were annotated using the Bovine UMD.3.1 genome assembly. QTL regions that overlapped with the identified candidate regions were searched from the cattle QTLdb (http://www.animalgenome.org/cgi-bin/QTLdb/BT/index).

RESULTS AND DISCUSSION

Genetic diversity, population structure, and demographic history

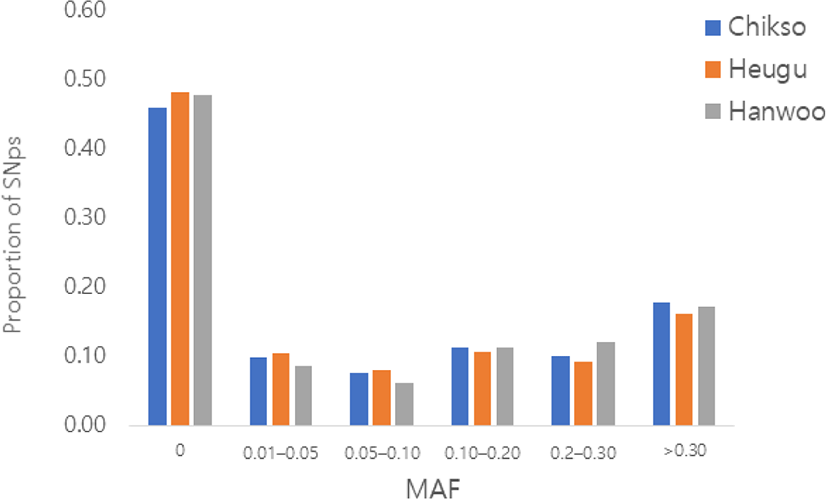
Of the total autosomal SNPs (191,789), 47% were found to be fixed across the three breeds. The percentage of SNPs with MAF > 5% was 44%, 41%, and 44% in Hanwoo, Heugu, and Chikso, respectively. The proportion of polymorphic SNPs observed in the Korean cattle is nearly similar to the figure observed on GGP-F250 (https://genomics.neogen.com/pdf/slicks/ag229_ggp_f250_array_flyer.pdf) for diverse cattle breeds (Fig. 1). This higher proportion of fixed SNPs in our study cattle breed could be explained by the fact that the GGPF-250 array largely contained functional variants (non-synonymous, frameshift and premature stop) having a functional effect or causative polymorphism and subject to selection. Previous studies have shown that functional SNPs (non-synonymous) had lower minor allele frequencies [14,15]. The SNP was considered as breed-specific when it was polymorphic (MAF > 0.05) in the particular breed, but fixed in the other breeds [16]. The highest number of breed-specific SNPs (1784) was found in the Korean black cattle, while the Hanwoo breed had a lower number of breeds specific SNPs (925). The average MAF of breed-specific SNPs ranged from 0.09 in Chikso to 0.14 in Heugu. The SNPs identified as specific to one breed can be used for product traceability and breed discrimination/assignment.

jast-62-3-293-g1
Fig. 1. Distribution of minor allele frequencies in the three Korean cattle breeds. MAF, minor allele frequency; SNP, single nucleotide polymorphism.
Download Original Figure

To assess the consequences of artificial selection and demographic events in shaping the genetic constitution of Korean native cattle breeds, level of within breed genetic variability was assessed based on observed and expected heterozygosity. Results show that a deficiency of heterozygosity was detected in the three cattle populations. Specifically, the Korean black (Heugu) cattle retained the lowest level of within-breed genetic variation (Table 1). The observed heterozygosity in Hanwoo and Chikso are higher than the values (0.26–0.29) estimates from high-density SNPs [17], but far lower than the microsatellite (0.67) [5] and Bovine SNP50 BeadChip based estimates (0.38–0.44) [18]. The low level of genetic variability obtained from Heugu is possibly attributed to genetic drift associated with low effective population and geographical isolation [4]. The estimated inbreeding coefficients were –0.041, –0.069, and –0.045 in Chikso, Heugu, and Hanwoo, respectively. The estimated average relatedness was highest for Heigu (0.155) followed by Hanwoo (0.12).

Table 1. Genetic parameters in three Korean native cattle breeds
Parameter Chikso Hanwoo Heugu
HO 0.30 0.30 0.28
HE 0.28 0.28 0.26
F −0.041 −0.045 −0.069
PI_HAT (IBS) 0.096 0.115 0.155
MAF 0.12 0.12 0.11
Number of breed specific SNPs 1,491 925 1,784
MAF
 Minimum 0.06 0.06 0.02
 Maximum 0.46 0.30 0.48
 Average 0.09 0.10 0.14
Ne 13 generations ago 94 88 57

MAF, minor allele frequency; SNP, single nucleotide polymorphism; Ne, effective population size.

Download Excel Table

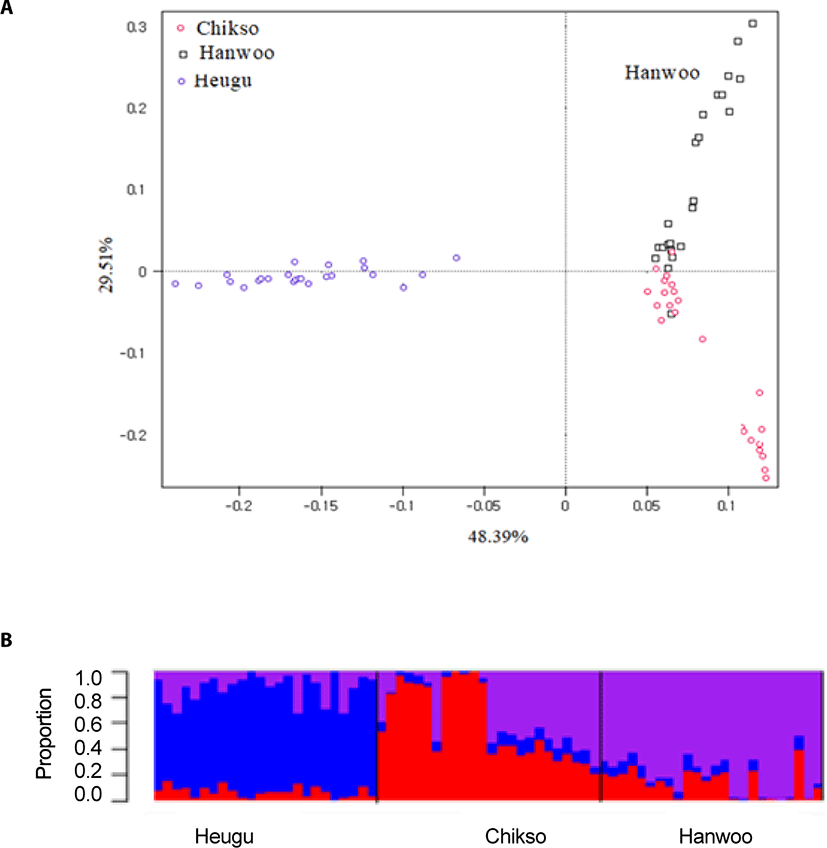
To portray population structure, a principal component was carried out and results showed that the three breeds were clustered based on their coat color phenotypes and breeding histories. As well depicted in Fig. 2, the PC1 accounted for about 48.39% of the variation and prominently separated Hanwoo and Chikso from the Korean Black cattle with a lower level of variation in Heugu. The PC2 segregated Brown Hanwoo population from the Brindle Hanwoo (Chikso) with some individuals from both breeds clustered closely (Fig. 3). In addition, Heugu breed was far separated from the two mainland cattle breeds, possibly due to geographical isolation and genetic drift associated with small effective population size. The PCA results further supported by a model-based population structure (Fig. 2).

jast-62-3-293-g2
Fig. 2. Individual animals clustering based on principal component analysis (A) and model-based population structure analysis results (K = 3) (B).
Download Original Figure
jast-62-3-293-g3
Fig. 3. Genetic relationships among three Korean cattle breeds.
Download Original Figure
Linkage disequilibrium and demographic history

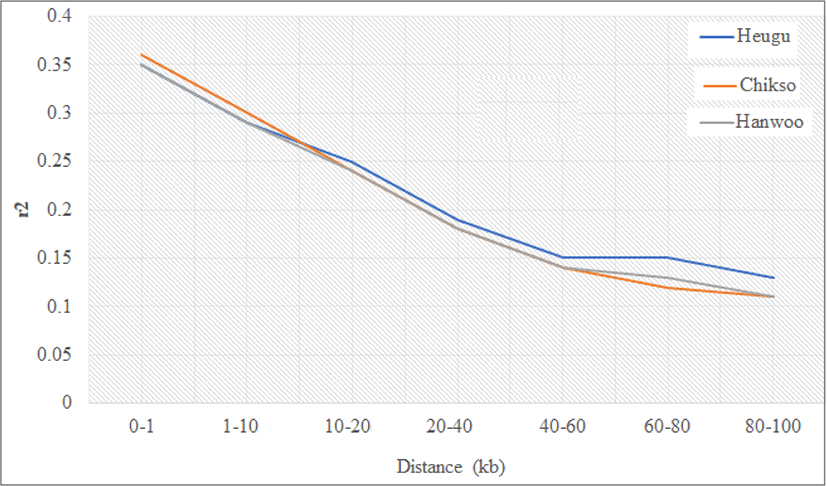
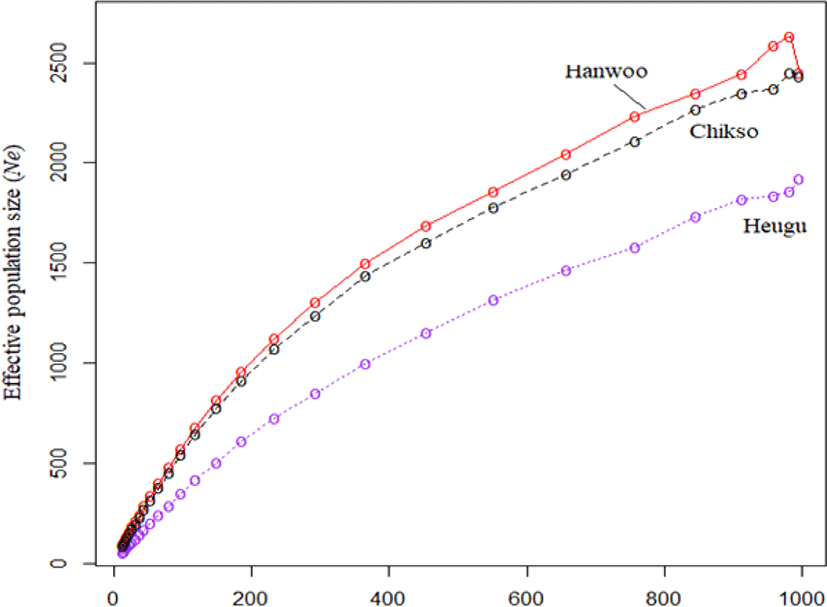
Linkage disequilibrium as estimated by r2 were found to be 0.25 ± 0.34, 0.26 ± 0.35 and 0.26 ± 0.35 in Hanwoo, Chikso, and Heugu, respectively. These estimates were higher than the reported 0.1, 0.13, and 0.12 values in Hanwoo, Chikso, and Heugu based on 50 K chip analysis [18]. Across the three breeds, r2 values decreased steeply as the distance between markers increased. For instance, in the Hanwoo cattle, r2 values dropped from 0.35 to 0.11 when the inter-marker distance increased from 0–10 to 80–100 b (Fig. 4). The higher LD at a shorter distance in the three Korean cattle breeds could be attributed to a reduction in their effective population sizes across generations. The effective population size (Ne) during the last 13 generations (~65 years) in Hanwoo, Chikso, and Heugu were 88, 94, and 57, respectively. Overall, the studied breeds showed a consistent decline in Ne across all generations. Of the three Korean native cattle breeds, Heugu had smaller Ne values at all generations considered (Fig. 5). These smaller Ne values obtained from Heugu are in concurrent with the estimated lower within-breed genetic diversity. The Ne values obtained in this study for the last 13 generations are far lower than those reported for Hanwoo (260) and Chikso (202) [17], but higher than the values estimated for Hanwoo (83) and Chikso (59) [18]. This difference can be attributed to the difference in genotyping arrays, Bovine HD and SNP50, respectively.

jast-62-3-293-g4
Fig. 4. Linkage disequilibrium (r2) decay in three Korean cattle breeds.
Download Original Figure
jast-62-3-293-g5
Fig. 5. Effective population size across generations in the three Korean cattle breeds.
Download Original Figure
Candidate regions and genes under positive selection

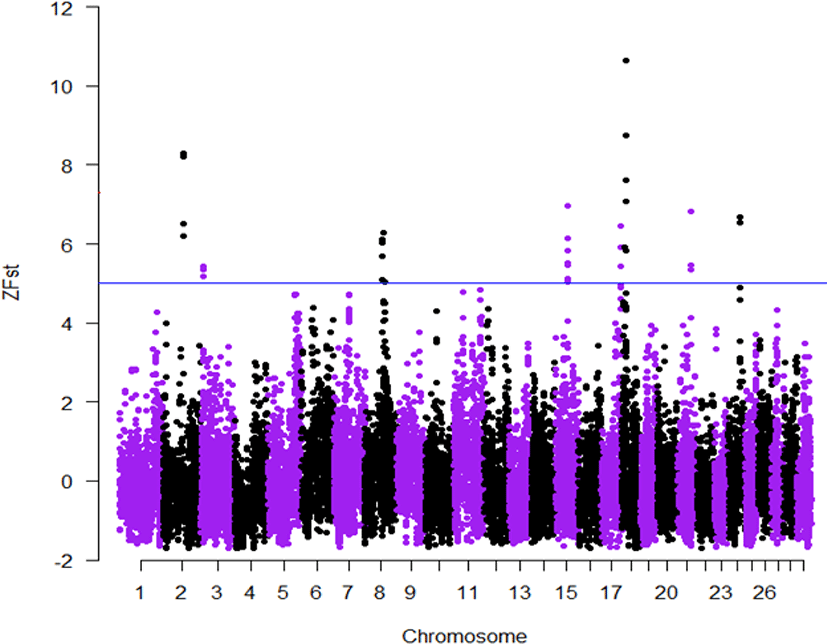
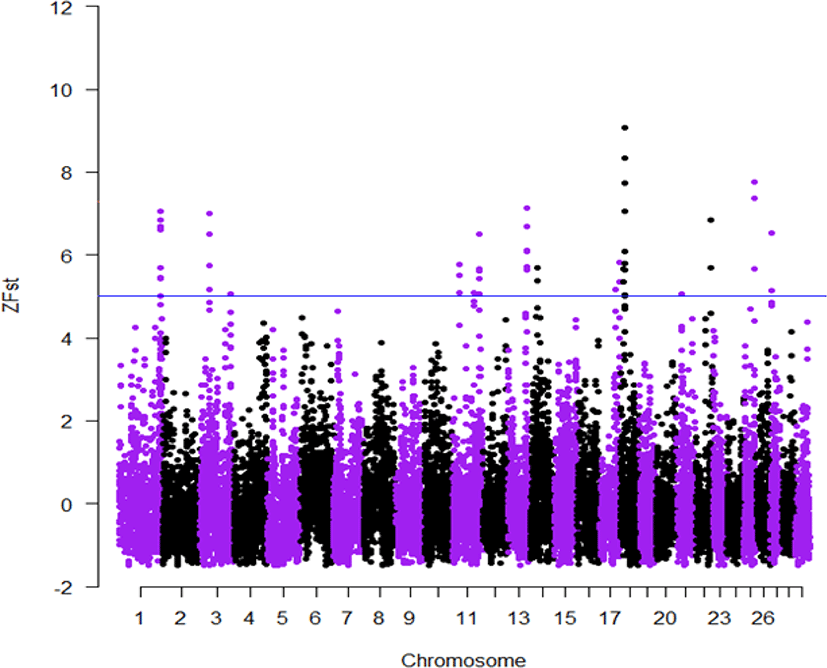
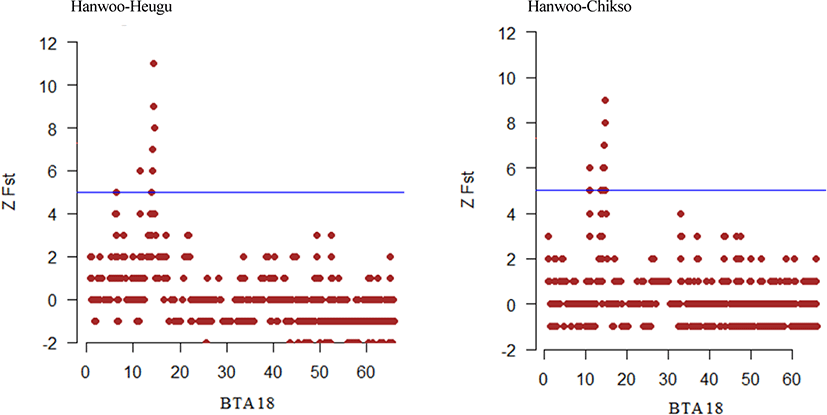
Here for the first time, we employed the GGP-F250 chip primarily built from functional variants to investigate how selection and genetic drift have shaped the genetic variation of Korean native cattle breeds displaying distinct phenotypic traits. Tables 2 and 3, present candidate regions and genes identified in the comparisons of Hanwoo-Heugu and Hanwoo-Chikso, respectively. Across the bovine autosomal chromosomes, 113 and 84 genes were detected for Hanwoo-Chikso and Hanwoo-Heugu pairs analyses, respectively. For the two pairs of comparisons, the strongest signals of selection were detected on BTA18 (12.51–14.57 Mb; ZFst = 11). The largest numbers of candidate genes were also located on BTA18 followed on BTA8 and BTA11. Specifically, the region on BTA18 between 13.34 and 15.06 Mb includes 25 genes in Hanwoo-Chikso pair. For Heugu-Hanwoo group, the candidate regions on BTA18 (13.93–14.68 Mb) contained 18 genes. The strong signals of selection on BTA18 also had strong linkage disequilibrium and diverse haplotypes in the three cattle breeds analysed (Figs. 68). In addition to variation in production traits, the studied breeds or breeds under study also exhibit distinct coat colors and patterns. The Heugu cattle display a solid black coat color, whereas Hanwoo shows brown coat color. Interestingly, the region on BTA18 (14.32–14.68 Mb; ZFst = 8) showing strong divergent selection signals was only 19 kb away from the MC1R gene (14,705,093–14,706,843 [Figs. 68]).

jast-62-3-293-g6
Fig. 6. Manhattan plots of genome-wide distribution of ZFst values for the comparison of Hanwoo and Heugu. The solid blue line indicates ZFst values ≥ 5.
Download Original Figure
jast-62-3-293-g7
Fig. 7. Manhattan plots of genome wide distribution of ZFst values for the comparison of Hanwoo and Chikso. The solid blue line indicates ZFst values ≥ 5.
Download Original Figure
jast-62-3-293-g8
Fig. 8. Signatures of strong selection spotted on BTA18 at 14.00–15.03 Mb.
Download Original Figure
Table 2. Selection regions and genes identified from Heugu and Hanwoo cattle comparison
Chr Start position End position Candidate genes QTL
2 71023597 71882569 MARCO, STEAP3, C2H2orf76, DBI, SCTR Body weight
3 8684364 8879299 ITLN2, ENSBTAG0000046236, ENSBTAG00000040437, CD244, LY9, ENSBTAG00000010458 Marbling score
5 100367546 101298140 CLEC12B, KLRF2, RF00026, ENSBTAG00000038461, A2M Scrotal circumference, yearling weight
7 54109476 54190447 PCDHGA2, PCDHGA3, PCDHGB1, PCDHGB2, PCDHGA5, PCDHGC3
8 60317329 60596717 GBA2, MSMP, RGP1, NPR2, ENSBTAG00000047598, SPAG8, HNT2, FMA221B, TMEM8B, ENSBTAG00000026123 Height, body weight
8 67030265 67241125 ENSBTAG00000005966, ENSBTAG00000005966 Body weight gain
8 72477349 72949048 ADAM28, ADAMDEC1, ADAM7
11 34583714 34813659 -
11 93787137 93853093 OR1L1, OR1L3
15 47043175 47908687 DCHS1, TPP1, TAF10, RRP8, DNHD1, APBB1, OR52E4, ENAG00000037505, ENSBTAG0000000118, ENSBTAG00000038452, ENSBTAG00000027949, ENSBTAG00000040480, ENSBTAG00000036326 Body weight gain, yearling weight, average daily gain, feed conversion ratio, dry matter intake, residual feed intake
17 72962185 73021410 IGLL1, ZNF280B, ZNF280A
18 6301968 6481097 -
18 11406268 11581262 -
18 13933911 14685758 CYBA, RNF166, CTU2, PIEZO1, bta-mir-2327, CDT1, APRT, GALNS, TRAPPC2L, CBFA2T3, ACSF3, CDH15, SLC22A31, ANKRD11, SPG7, CPNE7, ZNF276, FANCA Residual feed intake, calf size
21 49597943 49738155 TRAPPC6B, ENSBTAG00000045986, ENSBTAG0000006819 Bone quality
24 41976143 42597651 RALBP1, RAB31, TXNDC2, VAPA, APCDD1 Average daily gain, age at puberty

chr, chromosome; QTL, quantitative trait locus.

Download Excel Table
Table 3. Candidate regions and genes associated with beef production and carcass quality traits identified from Chikso and Hanwoo cattle comparison
Chr Start position End position Genes QTL
1 148072449 151166757 PRMT2, FBXO25, ENSBTAG00000046447, SIM2, HLCS, RIPPLY3, RF00026, TTC3, VPS26C Body weight gain, weaning weight, muscularity, marbling score, fat thickness, lean meat yield
3 32873828 33033967 KCNA2, KCNA10
3 110766510 111381801 TFAP2E, KIAA0319L, ZMYM4, ZMYM1, ZMYM6, DLGAP3 Lean meat yield, marbling score, longissimus muscle area, yearling weight, body weight gain, average daily gain
7 14999658 15045085 ENSBTAG00000046982, ENSBTAG00000047921, ENSBTAG0000004369
11 21010489 21606892 GALM, SRSF7, GEMIN6, DHX57, MORN2, ARHGEF33, CDKL4, MAP4K3 Body weight
11 77076811 78031240 APOB Yearling weight, body weight gain, intramuscular fat
11 93692524 93809101 ENSBTAG00000045545, ENSBTAG00000038551, OR1Q1, OR1B1, OR1L1, OR1L3
13 66660916 66868249 RBL1, SOGA1, MROH8, RPN2, GHRH Body weight gain
13 71333012 71723514 PTPRT Weaning weight
14 20596116 20987173 ENSBTAG00000009474, ENSBTAG000000040351, SPIDR
14 24396553 25135691 XKR4, TMEM68, LYN, PLAG1, RF00003, SDR16C5 Weaning weight, yearling weight, scrotal circumference, stature, body weight gain, subcutaneous rump fat thickness, Intramuscular fat, average daily gain, growth index, carcass weight
17 54274325 54408888 TCTN2, GTF2H3, EIF2B1, DDX55, TMED2, RILPL1
17 73002611 73020126 IGLL1, ZNF280B, ZNF280A
18 10853886 11102972 KLHL36, USP10, CRISPLD2 Residual feed intake, cold tolerance
18 13343265 15070445 SLC7A5, CA5A, BANP, ZNF469, CDT1, APRT, GALNS, TRAPPC2L, CBFA2T3, ACSF3, CDH15, SLC22A31, ANKRD11, SPG7, CPNEP1, ZNF276, FANCA, SPIRE2, TCF25, DEF8, ENSBTAG00000038051, GAS8, SHCBP1, VPS35, ORC6 Residual feed intake, feed conversion ratio, conception rate
21 20178170 20346289 ENSBTAG00000001308, ENSBTAG00000002786, ENSBTAG00000012326
22 52187729 52768833 ENSBTAG00000047174, MAP4, CATHL6, DHX30, SMARCC1, CSPG5, ELP6, RF00026, SCAP, CDC25A
25 21352460 21458166 COG7, GGA2, EARS2
25 36085282 36169022 ENSBTAG000000020157, ENSBTAG000000047767
27 4657588 5041722 ENSBTAG00000007477, ENSBTAG00000008519, AGPAT5, XKR5, TAP, SPAG11B, ZNF705A, ENSBTAG00000007340

chr, chromosome; QTL, quantitative trait locus.

Download Excel Table

As compared with the two Korean native cattle breeds, the Brown Hanwoo cattle breed has been phenotypically subjected to selection for beef production and quality traits, including carcass weight, eye muscle area, backfat thickness, and marbling score for the past 30 years [6]. The list of our candidate genes includes genes affecting body size, growth, stature, and carcass quality traits (Table 2 and 3). More importantly, the region between 24.67 Mb and 25.65 Mb on BTA 14 includes XKR4, PLAG1, LYN, DPEP1, SDR16C5, and TMEM68 genes that have been previously well known to affect several traits including height, carcass weight, and stature. This region also overlapped with several known QTL for stature, yearling weight, weaning weight, body weight gain, subcutaneous rump fat thickness, intramuscular fat, average daily gain, and carcass weight. The XKR4 gene has been reported to be associated with the backfat thickness [19,20], feed intake, and average daily gain [21,22]. PLAG1 and LYN gene were associated with variation in stature in cattle and humans [23,24], associated with feed intake and growth in beef cattle [25]. TMEM68 is associated with several production traits including growth, birth weight, feed intake, meat tenderness, and growth/yearling weight in cattle [22,26]. SDR16C5 is associated with birth weight, body weight, and differences in body stature in beef and dairy cattle breeds [24,27]. Additionally, this gene influences human height [23,28,29]. In agreement with our results, a genome-wide association study of Korean cattle (Hanwoo) did detect QTL for carcass weight on BTA14 at 23–25 Mb [8,9].

We further assessed selective signals between the two pairwise comparisons. Common signals of selection between Hanwoo-Heugu and Hanwoo-Chikso pairs were identified on 3 autosomal chromosomes including on BTA11 (93.79–93.80 Mb), BTA17(73.00–73.02 Mb), and BTA18 (14.06–14.68 Mb). Of these candidate regions, the strongest shared selection signals were observed on BTA18 (13.34–15.07 Mb) that covered 1,727 kb. This region includes 18 genes (ACSF3, ANKRD11, APRT, CBFA2T3, CDH15, CDT1, CPNE7, FANCA, GALNS, IGLL1, OR1L1, OR1L3, RF00026, SLC22A31, SPG7, TRAPPC2L, ZNF276, ZNF280A [Table 3; Figs. 6 and 7]). The ACSF3 gene has been identified as a novel candidate for intramuscular fat (IMF) [30] and gene activates fatty acids [31]. Two of the candidate genes (CDH15 and GALNS) have reported to be associated with meat production and stature in cattle [32]. Our LD and haplotype analysis did detect strong LD and haplotype block in the GALNS, CDH15, and APRT gene regions. In their expression analysis, [33] demonstrated that the expression of DPEP1 gene was increased in cattle with greater average daily gain. CPNE7, FANCA, and SPG7 all located on BTA18 between 13.93 and 14.68 Mb were identified as being under selection in European taurine breeds and linked to reproduction, lipid metabolism process, and nervous system development [34]. These shared signals of selection in genes associated with beef traits could imply that Hanwoo cattle are selected for growth and carcass quality traits.

Several earlier and recent studies have clearly shown that growth hormone (GH) plays an important role in controlling growth rate, feed intake, lactation, and carcass traits [3537]. GH levels are regulated by the release of GHRH [38]. Coincidentally, a region on BTA13 (66.66–66.86 Mb) spanning 5 genes, including RBL1, SOGA1, MROH8, RPN2, and GHRH. Mutations in this GHRH gene are linked to carcass yield in cattle [39]. Previous studies have shown that SOGA1 gene affects average daily gain [40,41] and residual feed intake [40]. A region spanning 4.65–5.04 Mb on BTA27 harbored candidate gene for abiogenesis and fatty acid oxidation [42]. Another potential region of interest is flagged on BTA22 (52.18–52.76 Mb) containing the CDC25A which underlines body size variation and under strong selection in beef cattle [43]. Another candidate region is BTA5:100.36–101.29 Mb, which spanned the CLEC12B gene. The CLEC family genes such as CLEC12A and CLEC4G are highly expressed in tender meat and associated with meat tenderness [44,45]. Another gene also within the BTA17 (54.27–54.40 Mb), EIF2B1, was identified as a potential candidate for beef tenderness [46]. BANP is associated with preadipocyte proliferation [47]. Following the association of several of our candidate genes with meat quality traits, further functional analysis of the divergently selected genes (DBI, ACSF3, HINT2, GBA2, AGPAT5, SCAP, ELP6, APOB, and RBL1) was associated with relevant gene ontology (GO) terms including fatty oxidation, metabolism, biosynthesis, and storage.

The expression of DPEP1 gene was increased in cattle with greater average daily gain [33], expression of GALM is lower in cattle showing lower IMF [33,48]. Several of the candidate genes found in this study were previously reported QTL regions on beef production traits (Tables 2 and 3).

In summary, based on the results of the present study, the genetic diversity and population structure of Korean cattle breeds can be revealed by population demographic events and selective breeding. The smallest effective population size obtained in particular for Heugu over generations pledges further strengthening of the ongoing conservation program. The candidate genes detected in the present study are previously known to affect beef production and quality traits and could be used in the beef cattle breeding strategies.

Competing interests

No potential conflict of interest relevant to this article was reported.

Funding sources

This work was supported by Korea Institute of Planning and Evaluation for Technology in Food, Agriculture, Forestry (IPET) through “Development of on-site verification system and device for Identifying Hanwoo beef” Project, funded by Ministry of Agriculture, Food and Rural Affairs, Korea (318015-3).

Acknowledgements

The authors are grateful to the anonymous reviewers for their useful suggestions and Dr. Rasel Uzzaman for technical assistance for manuscript revision.

Availability of data and material

Upon reasonable request, the datasets of this study can be available from the corresponding author.

Authors’ contributions

Conceptualization: Edea Z, Kim KS.

Data curation: Jung KS, Shin SS, You SW.

Formal analysis: Edea Z, Choi JW, Kim KS.

Methodology: Edea Z.

Software: Edea Z.

Validation: Edea Z, Kim KS.

Investigation: Edea Z, Kim KS.

Writing - original draft: Edea Z.

Writing - review & editing: Kim KS.

Ethics approval and consent to participate

This article does not require IRB/IACUC approval because there are no human and animal participants.

REFERENCES

1.

Lee SH, Park BH, Sharma A, Dang CG, Lee SS, Choi TJ, et al. Hanwoo cattle: origin, domestication, breeding strategies and genomic selection. J Anim Sci Technol. 2014; 56:2

2.

Dadi H, Lee SH, Lee SS, Park C, Kim KS. Inter-and intra-population genetic divergence of East Asian cattle populations: focusing on Korean cattle. Genes Genom. 2014; 36:261-5

3.

Decker JE, McKay SD, Rolf MM, Kim J, Alcalá AM, Sonstegard TS, et al. Worldwide patterns of ancestry, divergence, and admixture in domesticated cattle. PLoS Genet. 2014; 10:e1004254

4.

Dadi H, Lee SH, Jung KS, Choi JW, Ko MS, Han YJ, et al. Effect of population reduction on mtDNA and demographic history of Korean cattle populations. Asian-Australas J Anim Sci. 2012; 25:1223-8

5.

Suh S, Kim YS, Cho CY, Byun MJ, Choi SB, Ko YG, et al. Assessment of genetic diversity, relationships and structure among Korean native cattle breeds using microsatellite markers. Asian-Australas J Anim Sci. 2014; 27:1548-53

6.

Park B, Choi T, Kim S, Oh SH. National genetic evaluation (system) of Hanwoo (Korean native cattle). Asian-Australas J Anim Sci. 2013; 26:151-6

7.

Edea Z, Jeoung YH, Shin SS, Ku J, Seo S, Kim IH, et al. Genome-wide association study of carcass weight in commercial Hanwoo cattle. Asian-Australas J Anim Sci. 2018; 31:327-34

8.

Lee SH, Choi BH, Lim D, Gondro C, Cho YM, Dang CG, et al. Genome-wide association study identifies major loci for carcass weight on BTA14 in Hanwoo (Korean cattle). PLOS ONE. 2013; 8:e74677

9.

Lee SH, van der Werf J, Lee SH, Lim DJ, Park EW, Gondro C, et al. Genome wide QTL mapping to identify candidate genes for carcass traits in Hanwoo (Korean Cattle). Genes Genom. 2012; 34:43-9

10.

Rowan TN, Hoff JL, Crum TE, Taylor JF, Schnabel RD, Decker JE. A multi-breed reference panel and additional rare variants maximize imputation accuracy in cattle. Genet Sel Evol. 2019; 51:66

11.

Purcell S, Neale B, Todd-Brown K, Thomas L, Ferreira MA, Bender D, et al. PLINK: a tool set for whole-genome association and population based linkage analyses. Am J Hum Genet. 2007; 81:559-75

12.

Barbato M, Orozco-terWengel P, Tapio M, Bruford MW. SNeP: a tool to estimate trends in recent effective population size trajectories using genome-wide SNP data. Front Genet. 2015; 6:109

13.

Weir BS, Cockerham CC. Estimating F-statistics for the analysis of population structure. Evolution. 1984; 38:1358-70

14.

Halushka MK, Fan JB, Bentley K, Hsie L, Shen N, Weder A, et al. Patterns of single nucleotide polymorphisms in candidate genes for blood pressure homeostasis. Nat Genet. 1999; 22:239-47

15.

Cargill M, Altshuler D, Ireland J, Sklar P, Ardlie K, Patil N, et al. Characterization of single-nucleotide polymorphisms in coding regions of human genes. Nat Genet. 1999; 22:231-8

16.

Czech B, Frąszczak M, Mielczarek M, Szyda J. Identification and annotation of breed-specific single nucleotide polymorphisms in Bos taurus genomes. PLOS ONE. 2018; 13:e0198419

17.

Kim S, Cheong HS, Shin HD, Lee SS, Roh HJ, Jeon DY, et al. Genetic diversity and divergence among Korean cattle breeds assessed using a BovineHD single-nucleotide polymorphism chip. Asian-Australs J Anim Sci. 2018; 31:1691-9

18.

Sharma A, Lee SH, Lim D, Chai HH, Choi BH, Cho Y. A genome-wide assessment of genetic diversity and population structure of Korean native cattle breeds. BMC Genet. 2016; 17:139

19.

Porto Neto LR, Bunch RJ, Harrison BE, Barendse W. Variation in the XKR4 gene was significantly associated with subcutaneous rump fat thickness in indicine and composite cattle. Anim Genet. 2012; 43:785-9

20.

Bolormaa S, Porto Neto LR, Zhang YD, Bunch RJ, Harrison BE, Goddard ME, et al. A genome-wide association study of meat and carcass traits in Australian cattle. J Anim Sci. 2011; 89:2297-309

21.

Medeiros de Oliveira Silva R, Bonvino Stafuzza N, de Oliveira Fragomeni B, Miguel Ferreira de Camargo G, Matos Ceacero T, Noely dos Santos Gonçalves Cyrillo J, et al. Genome-wide association study for carcass traits in an experimental nelore cattle population. PLOS ONE. 2017; 12:e0169860

22.

Lindholm-Perry AK, Kuehn LA, Smith TPL, Ferrell CL, Jenkins TG, Freetly HC, et al. A region on BTA14 that includes the positional candidate genes LYPLA1, XKR4 and TMEM68 is associated with feed intake and growth phenotypes in cattle. Anim Genet. 2012; 43:216-9

23.

Gudbjartsson DF, Walters GB, Thorleifsson G, Stefansson H, Halldorsson BV, Zusmanovich P, et al. Many sequence variants affecting diversity of adult human height. Nat Genet. 2008; 40:609-15

24.

Utsunomiya YT, do Carmo AS, Carvalheiro R, Neves HRH, Matos MC, Zavarez LB, et al. Genome-wide association study for birth weight in Nellore cattle points to previously described orthologous genes affecting human and bovine height. BMC Genet. 2013; 14:52

25.

Hay EH, Roberts A. Genome-wide association study for carcass traits in a composite beef cattle breed. Livest Sci. 2018; 213:35-43

26.

Terakado PN, Costa RB, de Camargo GMF, Irano N, Bresolin T, Takada L, et al. Genome-wide association study for growth traits in Nelore cattle. Animal. 2018; 12:1358-62

27.

Xiong X, Yang H, Yang B, Chen C, Huang L. Identification of quantitative trait transcripts for growth traits in the large scales of liver and muscle samples. Physiol Genomics. 2015; 47:274-80

28.

Lettre G, Jackson AU, Gieger C, Schumacher FR, Berndt SI, Sanna S, et al. Identification of ten loci associated with height highlights new biological pathways in human growth. Nat Genet. 2008; 40:584-91

29.

Weedon MN, Lango H, Lindgren CM, Wallace C, Evans DM, Mangino M, et al. Genome wide association analysis identifies 20 loci that influence adult height. Nat Genet. 2008; 40:575-83

30.

Rubio YLB, Duarte JLG, Bates RO, Ernst CW, Nonneman D, Rohrer GA, et al. Implementing meta-analysis from genome-wide association studies for pork quality traits. J Anim Sci. 2015; 93:5607-17

31.

Bovo S, Bertolini F, Schiavo G, Mazzoni G, Dall’Olio S, Fontanesi L. Reduced representation libraries from DNA pools analysed with next generation semiconductor based-sequencing to identify SNPs in extreme and divergent pigs for back fat thickness. Int J Genomics. 2015; 2015:950737

32.

Gutiérrez-Gil B, Arranz JJ, Wiener P. An interpretive review of selective sweep studies in Bos taurus cattle populations: identification of unique and shared selection signals across breeds. Front Genet. 2015; 6:167

33.

Foote AP, Keel BN, Zarek CM, Lindholm-Perry AK. Beef steers with average dry matter intake and divergent average daily gain have altered gene expression in the jejunum. J Anim Sci. 2017; 95:4430-9

34.

Zhao F, McParland S, Kearney F, Du L, Berry DP. Detection of selection signatures in dairy and beef cattle using high-density genomic information. Genet Sel Evol. 2015; 47:49

35.

Burton JL, McBride BW, Block E, Glimm DR, Kennelly JJ. A review of bovine growth hormone. Can J Anim Sci. 1994; 74:167-201

36.

Kopchick JJ, Cioffi JA. Exogenous and endogenous effects of growth hormone in animals. Livest Prod Sci. 1991; 27:61-75

37.

Brumby PJ. The influence of growth hormone on growth in young cattle. N Z J Agric Res. 1959; 2:683-9

38.

Vance ML. Growth-hormone-releasing hormone. Clin Chem. 1990; 36:415-20

39.

Cheong HS, Yoon DH, Kim LH, Park BL, Choi YH, Chung ER, et al. Growth hormone-releasing hormone (GHRH) polymorphisms associated with carcass traits of meat in Korean cattle. BMC Genet. 2006; 7:35

40.

Do DN, Strathe AB, Ostersen T, Pant SD, Kadarmideen HN. Genome-wide association and pathway analysis of feed efficiency in pigs reveal candidate genes and pathways for residual feed intake. Front Genet. 2014; 5:307

41.

Meng Q, Wang K, Liu X, Zhou H, Xu L, Wang Z, et al. Identification of growth trait related genes in a Yorkshire purebred pig population by genome-wide association studies. Asian-Australas J Anim Sci. 2017; 30:462-9

42.

Zhang YY, Wang HB, Wang YN, Wang HC, Zang S, Hong JY, et al. Transcriptome analysis of mRNA and microRNAs in intramuscular fat tissues of castrated and intact male Chinese Qinchuan cattle. PLOS ONE. 2017; 12:e0185961

43.

Wang X, Liu J, Zhou G, Guo J, Yan H, Niu Y, et al. Whole-genome sequencing of eight goat populations for the detection of selection signatures underlying production and adaptive traits. Sci Rep. 2016; 6:38932

44.

Fonseca LFS, Gimenez DFJ, Silva DB, Barthelson R, Baldi F, Ferro JA, et al. Differences in global gene expression in muscle tissue of Nellore cattle with divergent meat tenderness. BMC Genomics. 2017; 18:945

45.

Tizioto PC, Decker JE, Taylor JF, Schnabel RD, Mudadu MA, Silva FL, et al. Genome scan for meat quality traits in Nelore beef cattle. Physiol Genomics. 2013; 45:1012-20

46.

Gonçalves TM, de Almeida Regitano LC, Koltes JE, Cesar ASM, da Silva Andrade SC, Mourão GB, et al. Expression analysis indicates potential pathways and regulators of beef tenderness in Nellore cattle. Front Genet. 2018; 9:441

47.

Liu M, Huang HY. Identification and validation of novel C/EBPbeta-regulated genes in preadipocyte proliferation. Chin Med J. 2010; 123:1190-4

48.

Zhang HM, Xia HL, Jiang HR, Mao YJ, Qu KX, Huang BZ, et al. Longissimus dorsi muscle transcriptomic analysis of Yunling and Chinese simmental cattle differing in intramuscular fat content and fatty acid composition. Genome. 2018; 61:549-58