INTRODUCTION
Knowledge of population genetic diversity is important for effective management and the development of sustainable conservation and improvement strategies. DNA polymorphism analysis is a powerful tool for analyzing genetic variation within and among individuals, families, populations, and other taxa. Various types of molecular genetic markers can find in the eukaryotic genome, such as microsatellite (MS), single-nucleotide polymorphism (SNP), restriction fragment length polymorphism (RFLP), and amplified fragment length polymorphism (AFLP) markers have been developed and utilized in population genetic studies. In addition, DNA profiling methods, which are based on the polymerase chain reaction (PCR) [1] are independent with environmental factors, can provide more accurate and useful information for the genomic evidence.
MS markers are typically genotyped by PCR amplification, followed by the determination of allele size by either gel electrophoresis or capillary electrophoresis, which involves laser-based detection of fluorescence dye modified oligonucleotides [2]. MS markers have also been demonstrated to be useful for estimating genetic relatedness and diversity in several livestock species including, cattle, sheep, and chickens, particularly in indigenous breeds, inbred strains, and commercial lines [3–6]. Based on their degree of polymorphism and genome coverage, several MS markers have been recommended by the Measurement of Domestic Animal Diversity (MoDAD) for application in diversity studies [7]. Various population genetic parameters have been described to measure genetic variation within and among populations using MS markers, including observed (Ho) and expected heterozygosity (He), polymorphic information content (PIC), number of alleles (Na) and allele richness per locus, genetic distance, and phylogeny. Simple and affordable genotyping methods and analytical tools offering easy interpretation have led to the extensive application of MS markers in genetic diversity studies to implements the conservation program for various native chicken breeds.
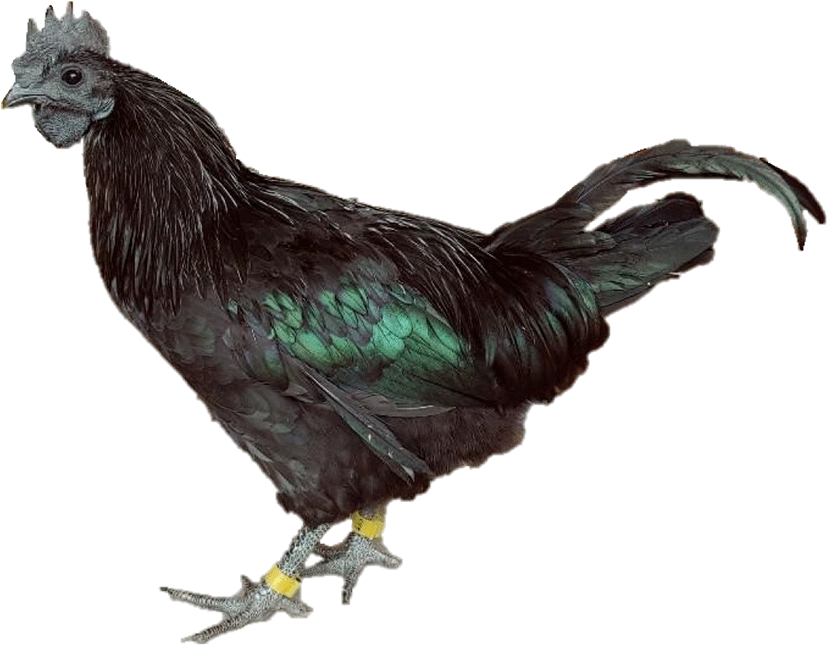
In 1980, the Yeonsan Ogye (YO) chicken was designated a natural monument of Korea (no. 265). YO is characterized by black feathers, skin, bones, eyes, and crest. Among native chicken breeds in South Korea, YO has very low economic value, owing to its slow breeding potential and hatching rate. However, the importance of YO as a natural cultural asset must be considered. Korea’s Cultural Heritage Administration has established guidelines to maintain a population of at least 1,000 YO chickens to prevent its extinction. To maintain genetic heterogeneity, it is essential to prevent inbreeding depression. Previous genomic analyses have shown that the YO population has maintained its genetic diversity and a suitable inbreeding coefficient despite the absence of a systematic management system. However, the current YO breeding group possesses no pedigree information to maintain a conservation population of over 1,000 animals via natural mating and artificial hatching. In each generation, male and female birds were selected based on the phenotypic traits (qualitative measures) such as completely black color for feather, comb, and shank, without considering their genetic diversity or the inbreeding ratio. Therefore, it is necessary to establish a breeding system for YO population that prevents inbreeding depression likely happen in the future and to maintain genetic diversity. Such efforts may prevent the loss of this nationally important YO genetic resource. This study aimed to assess the genetic diversity of current YO population and find the optimal number of clusters (the groups of birds that differ by genetic distance, and have low relatedness) using 19 polymorphic microsatellite (MS) markers and to construct a pedigree-based breeding plan for the YO population.
MATERIALS AND METHODS
In the present study, a complete sample strategy was implemented to collect the sample of YO population maintained at a private farm in Nonsan city, Korea. Approximately, 2 mL of whole blood samples were collected from 509 birds (> 5 months old males and females) and were stored in tubes containing ethylenediaminetetraacetic acid (EDTA) to prevent coagulation before DNA extraction step. At the same time, all the birds were tagged with unique electronic radio-frequency identification (RFID) tags and recorded to facilitate the identification of each individual (Fig. 1). Blood samples were subjected to genomic DNA (gDNA) extraction using the PrimePrep Genomic DNA Extraction Kit from Blood (Genet Bio, Daejeon, Korea). To assess the quality of the extracted gDNA, its concentration and purity were measured using a NanoDrop 2000c spectrophotometer. The extracted gDNA samples were stored at –20°C until the experiment began.
Initially, a total of 19 highly polymorphic MS markers were tested to investigate their polymorphic status in the YO breed. This set of markers were selected from the list of MS markers recommended by Food and Agriculture Organization of the United Nations (FAO) and a previous study of Seo et al. [8]. Polymorphism level of 19 markers was initially evaluated using single-plex PCR and agarose gel electrophoresis. Of these, 12 highly polymorphic markers were selected for multiplex PCR and genotyping. The 3’ end of each marker was modified to add four types of fluorescent substances (FAM, NED, VIC, and PET) for multiplex PCR and fragment analysis. To confirm the genotype (Table 1), a single PCR was also performed using HS Prime Taq Premix (Genet Bio) on YO test samples. The following amplification conditions were used in each PCR amplification: pre-denaturation at 95°C for 10 min, followed by denaturation, annealing, and extension processes repeated 30 times at 95°C for 30 s, 60°C for 30 s, and 72°C for 1 min, respectively, followed by a final extension at 72°C for 60 min. Fragment sizes of the PCR amplification products was then obtained by fragment analysis using the GeneScan-500 LIZ (Applied Biosystems, Foster City, CA, USA) size standard marker and Genetic Analyzer (GA)3730xl (Applied Biosystems). Allele size was assigned using the GeneMapper ver. 3.7 software (Applied Biosystems).
To obtain the genetic parameter for 12 MS markers, we performed basic population-level statistical and genetic diversity analyses using the ‘adegenet’ package in the R software [9]. The total number of alleles, polymorphic information content (PIC), Ho and He were calculated.
Multi-dimensional scaling (MDS) plot and phylogenetic tree analyses were performed using individual genetic distance information derived using the Euclidean distance method and genetic distances between clustered groups were identified based on Nei’s standard genetic distance values obtained using the ‘poppr’ R package [10], which can be represented as follows:
Where pop1i and pop2i are the allele frequencies at the ith locus in populations 1 and 2, respectively.
To obtain the genetic structure in current YO population (i.e., for optimal YO group division), k-means clustering was performed using the ‘NbClust’ R software package, and the obtained grouping information, and was heatmap analyzed using the ‘pheatmap’ R software package to visualize the genetic distance between identified groups.
To prepare a mating plan that will minimizes the inbreeding within the YO group, the possible breeding groups were identify by cluster analysis and genetic distance data.
RESULTS AND DISCUSSION
For effective management and conservation of YO chicken as a natural heritage, it is necessary to separate breeding groups and maintain the pedigree by establishing an all-in-all-out system for generation replacement. However, due to the lack of pedigree and breeding record information of current YO population, we have distinguished several groups of YO based on their genetic distance using genotype information from 12 MS markers to establish an initial breeding plan.
A total of 19 MS markers were tested to identify highly polymorphic marker combinations in YO chicken population. The 12 selected MS markers (ADL0259, ADL0268, ADL017, LEI0074, LEI0094, LEI0141, MCW0029, MCW0087, MCW0127, MCW0264, MCW0330, and ROS0083) contained an average of five alleles per locus. The Ho, He, and PIC of each marker in the YO population are listed in Table 2.
The average PIC of the selected markers was 0.586, and the average He was 0.642. Hinderbrand et al. [11] reported that MS markers with PIC > 0.5 and He > 0.6 are suitable for population genetic studies. Thus, all the selected markers except ADL0317 (PIC ≥ 0.4) had sufficient PIC for individual identification and lineage classification in the YO population. Two markers, ADL0268 and MCW0087 had exceptionally high PIC levels, of 7.0 or higher.
The markers selected in this study had higher Ho and He values than those identified in a previous study that have used 25 MS markers [12]. However, these results may have caused by the relatively large number of samples used (509 samples), compared with the previous study (27 samples). Notably, the combination of markers selected in this study provides sufficient polymorphism to distinguish individuals and breeds with a relatively small number of markers. Since all 12 markers were included in previous genetic diversity analysis of eight chicken varieties [13], we can indirectly infer the genetic distance and relationship between Ogye and various other chicken breeds in Korea. Choi et al. [13] analyzed the genotypes of 20–30 chickens in different chicken groups including hybrid population to obtain a combination of 12 markers with PIC > 0.7 and a very low probability of identity (PI). These results are consistent with the findings of the present study, suggesting that our 12 selected markers may be sufficient for explaining genetic diversity and distances within the YO population.
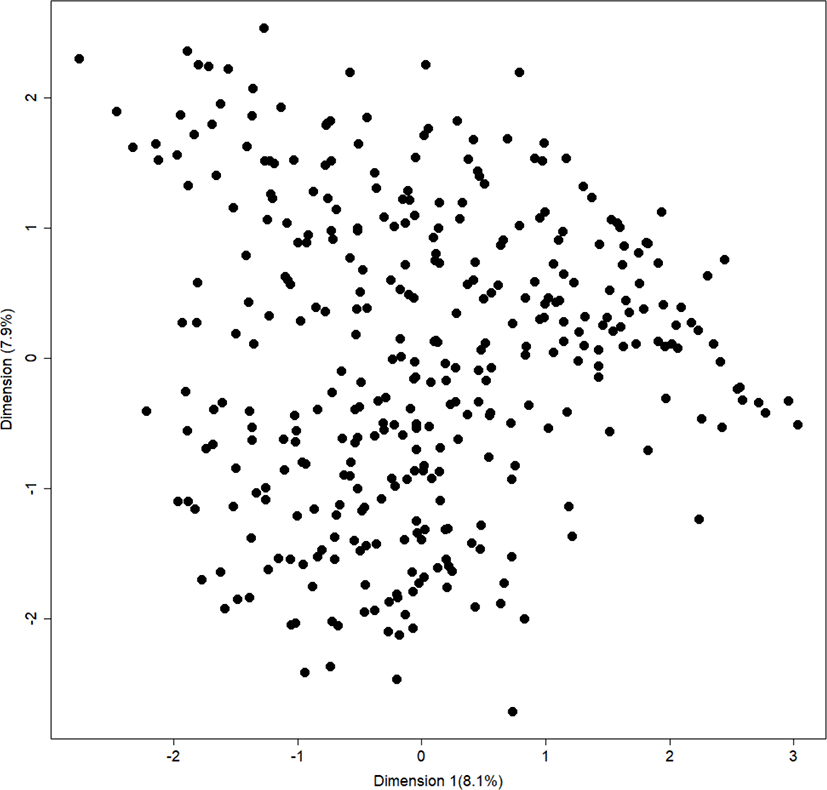
The result of MDS analysis confirmed that all birds were evenly distributed, without bias. This finding was expected because the samples used in this study were obtained exclusively from one large population. Therefore, these chickens have shared the common alleles (Fig. 2).
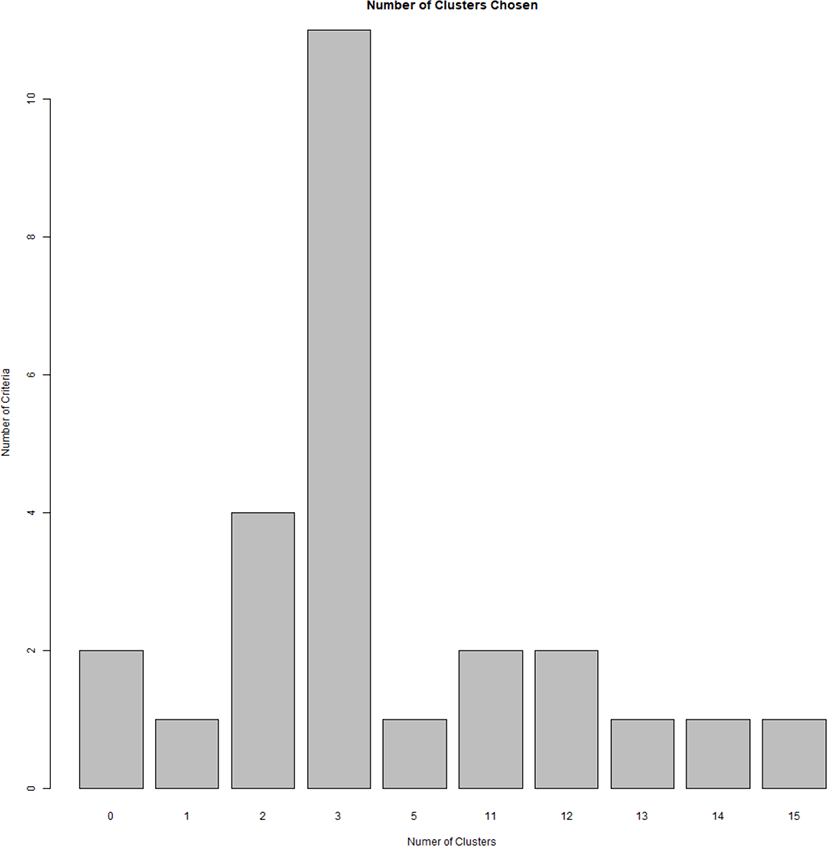
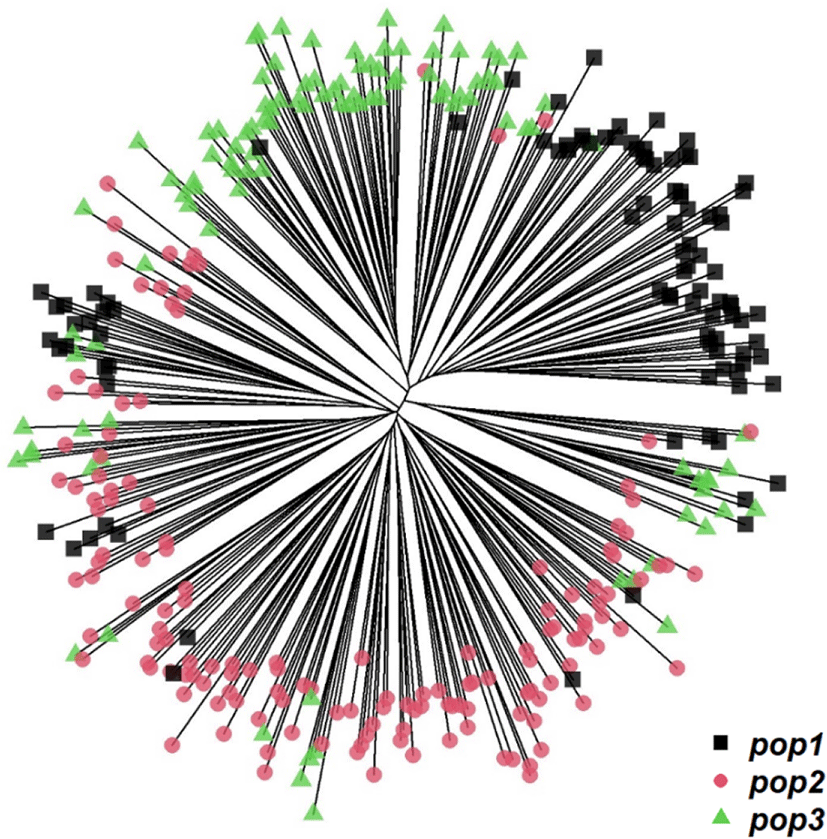
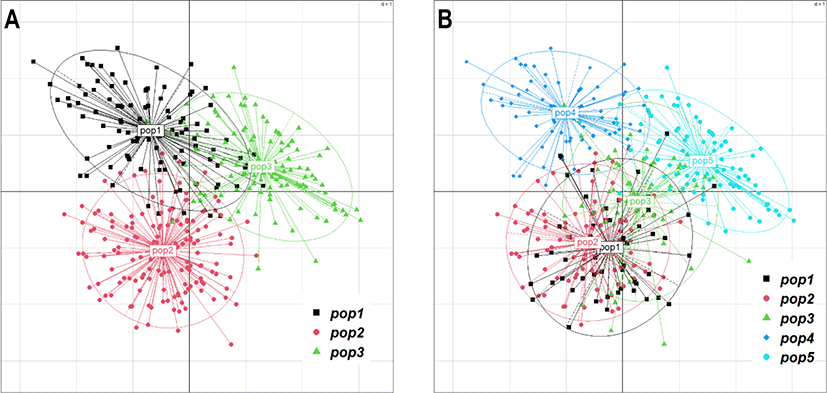
To design a breeding plan that minimizes inbreeding in a population without existing lineage information, it is important to calculate genetic distances using genotype information, and mating birds from different groups that identified to have relatively far genetic distance, while maintaining a new lineage record. Allele frequency for each bird and group is calculated to determine the genetic distance among each bird and group [14]. We performed a k-means clustering analysis to determine the optimal number of YO groups using genotype information obtained from the selected MS markers. By gradually increasing the number of clusters from 2 to 15, we determined the optimal number of groups with the smallest within-group variance and the largest between-group variance. This analysis results showed that the optimal k-value of YO groups was three (Fig. 3). In addition, based on the MDS, and phylogenetic tree analysis results, we further determined that the YO population could be separated into three groups (Figs. 4 and 5). These results imply that the YO chicken population is maintained as three ancestral groups. However, each group maintained a similar and close genetic distance from 0.16 to 0.17, and within the group, the genetic distance was very close with an average of 0.694, confirmed that their genetic similarities were high.
If the YO population is divided based on the three suggested groups (with lowest within-group variance and highest between-group variance), the genetic distance between the suggested groups did not much differ as indicated in the Fig. 6A, suggest that mating among three-ancestry groups would not be effective and sustainable. Furthermore, it is very difficult to maintain a sufficient number of generations for future replacement by keeping only three groups which may also lead to high inbreeding and low genetic diversity in the future.
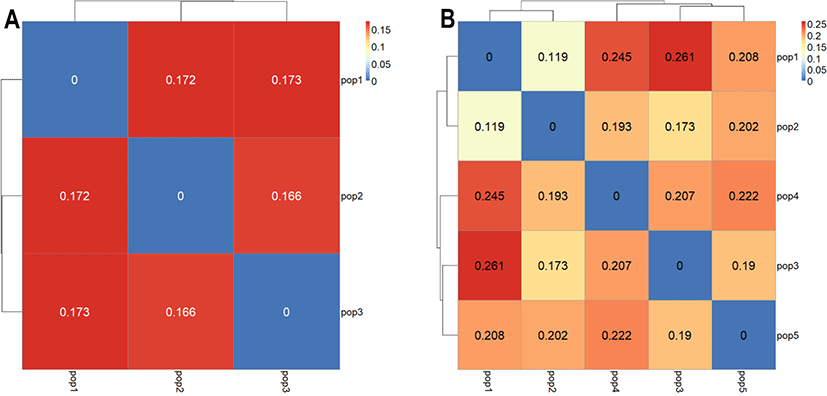
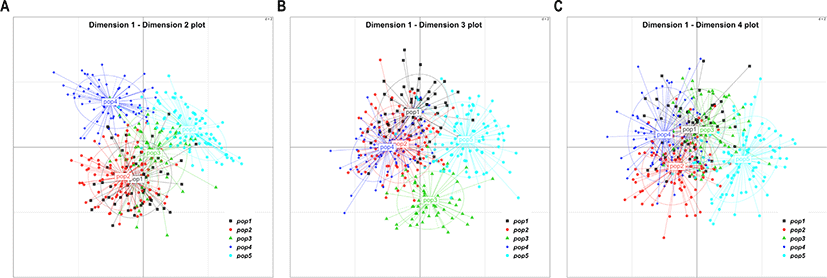
These limitations can be overcome by either increasing number of ancestry group or immigration. In the context of increasing ancestry group, we try to increase the number of ancestry groups up to 5 (k = 5) and analyses the genetic distance between groups. As summarized in heatmap in Figs. 5B, 6B, and 7 the genetic distance between groups was varied and range between 0.119 (pop1 vs pop2) and 0.261 (pop1 vs pop3). It was clear that the increasing number of groups possibly result in more genetically distant ancestry populations. Maintaining a sufficient number of the breeding groups at the initial stage is more important as it provides several options to decide the breeding groups to maintain the effective breeding plan. Having five base populations would be sufficient to increase the number of breeding groups that possess genetically distal birds. Rotational breeding among these five groups is more effective instead of keeping only three groups with low genetic distance.
In general, inbreeding has been reported to have a greater impact on population extinct than natural selection. In addition, inbreeding reduces the heterogeneity of the population and increases homozygosity, making it susceptible to recessive genetic diseases. The heterogeneity of a specific population becomes a measure of genetic diversity, and it is essential to maintain the population by adapting to various environmental changes and hereditary diseases. However, YO has been continued strong selection to maintain its unique appearance as a natural monument while maintaining a closed chicken population. In an environment where pedigrees are not recorded, the influence of phenotypic selections can have a great influence on the gene pool, and there is a possibility that the appearance selection of a certain standard may cause inbreeding by selecting only a single ancestry group. Our recent study of Major Histocompatibility Complex B region variation showed that YO population maintain in National Institute of Animal Science (NIAS) has unique genetic variation compare to other chicken populations [15]. MHC-B linked microsatellite marker LEI0258 diversity in the present study population showed that they have 9 alleles with varied frequencies (unpublished data). Keeping a diverse population will be improved the adaptive genetic variation and benefits their immunogenetic capacity to respond to the diseases in a free-range production system.
Therefore, this study provided sufficient information to understand the current genetic diversity of the YO population and the number of ancestry groups that can be used to increase or maintain the diverse population for future improvement.
Fortunately, 20–30 years ago, when the restoration project of Korean native chicken was being carried out, some groups of YO were delivered to Seoul National University and the National Institute of Animal Science in Chungbuk, Chungnam, and Gyeongbuk to maintain the purebred population. According to Roh et al. [12], each of these Ogye populations has the same phenotypic characteristics but different genetic diversity due to different population size and breeding strategies. Whereas the Gyeongbuk population is different from the other three populations because this population might be maintained as a crossbred despite their similar phenotypic characteristics. In particular, there is a difference between the four groups of YO that was not strongly selected by their appearance. Investigating the genetic diversity of these populations may find new ancestry groups to find clues that could increase genetic diversity. In addition, It has been reported that crossbreeding between genetically close lineages can alleviate the increase in effective population size and inbreeding [16]. Thus, as a second strategy, mutual exchange of population for breeding and effectively population management would be a successful conservation strategy for the YO chicken population.
CONCLUSION
The results of this study indicate that 12 MS markers represent a viable approach for determining genetic diversity and provide basic information for preparing a pedigree to establish an appropriate YO breeding plan. Based on genetic distances, we have identified three clusters of YO chickens and further divided into five clusters to implement the systematic breeding plan, in which rotational mating between these clusters is considered more favorable due to their different genetic distance. To sustain the unique phenotypic characteristics of YO chickens as a national monument of Korea, it also is necessary to consider the genetic information of individual birds in each breeding group and possible exchange of breeding materials among the available resource populations.


