RESEARCH ARTICLE

Prediction of calcium and phosphorus requirements for pigs in different bodyweight ranges using a meta-analysis

Se Min Jeon1,#https://orcid.org/0000-0001-5944-8844, Abdolreza Hosseindoust1,#https://orcid.org/0000-0001-9191-0613, Sang Hun Ha2https://orcid.org/0000-0003-3779-1144, Tae Gyun Kim2https://orcid.org/0000-0002-9772-080X, Jun Yong Mun2https://orcid.org/0000-0002-3075-7157, Joseph Moturi1,2https://orcid.org/0000-0002-0626-0255, SuHyup Lee3https://orcid.org/0000-0001-8996-3740, Yo Han Choi4https://orcid.org/0000-0003-4710-4731, Sang Deok Lee5https://orcid.org/0000-0001-7314-7271, Soo Jin Sa3https://orcid.org/0000-0002-2634-5109, Jin Soo Kim1,2,*https://orcid.org/0000-0002-9518-7917
Author Information & Copyright
1Department of Animal Industry Convergence, Kangwon National University, Chuncheon 24341, Korea
2Department of Bio-Health Convergence, Kangwon National University, Chuncheon 24341, Korea
3Department of Swine Science, Korea National College of Agriculture and Fisheries, Jeonju 54874, Korea
4Swine Division, National Institute of Animal Science, Rural Development Administration, Cheonan 31000, Korea
5Division of Forest Science, Kangwon National University, Chuncheon 24341, Korea
*Corresponding author: Jin Soo Kim, Department of Animal Industry Convergence, Kangwon National University, Chuncheon 24341, Korea. Tel: +82-33-250-8614, E-mail: Kjs896@kangwon.ac.kr

#These authors contributed equally to this work.

© Copyright 2021 Korean Society of Animal Science and Technology. This is an Open-Access article distributed under the terms of the Creative Commons Attribution Non-Commercial License (http://creativecommons.org/licenses/by-nc/4.0/) which permits unrestricted non-commercial use, distribution, and reproduction in any medium, provided the original work is properly cited.

Received: Mar 18, 2021; Revised: Apr 23, 2021; Accepted: May 01, 2021

Published Online: Jul 31, 2021

Abstract

Several studies have focused on Ca and P requirements for pigs. These requirements are estimated from their retention and bone formation. However, modern pig breeds have different responses to dietary Ca and P than traditional breeds, and their requirements are expected to change on an annual basis. Besides individual Ca and P needs, the Ca to P ratio (Ca/P) is an important factor in determining requirements. This study aimed to implement a linear and quadratic regression analysis to estimate Ca and P requirements based on average daily gain (ADG), apparent total tract digestibility (ATTD) of Ca (ATTD-Ca), ATTD of P (ATTD-P), and crude protein (CP) digestibility. Results show that Ca/P had linear and quadratic effects on ADG in the phytase-supplemented (PS) group in both the 6–11 kg and 11–25 kg categories. In the latter category, the CP digestibility was linearly increased in response to increasing Ca/P in the without-phytase (WP) group. In the 25–50 kg category, there was a linear response of ADG and linear and quadratic responses of CP digestibility to Ca/P in the PS group, while a linear and quadratic increase in CP digestibility and a quadratic effect on ATTD-Ca were observed in the WP group. In the 50–75 kg category, Ca/P had significant quadratic effects on ADG in the PS and WP groups, along with significant linear and quadratic effects on ATTD-Ca. In addition, Ca/P had significant quadratic effects on ATTD-P and led to a significant linear and quadratic increase in the CP digestibility in the WP group. In the 75–100 kg category, analysis showed a significant decrease in ATTD-Ca and ATTD-P in the PS and WP groups; in the latter, ATTD-P and ATTD-Ca were linearly decreased by increasing Ca/P. In conclusion, our equations predicted a higher Ca/P in the 6–25 kg bodyweight categories and a lower Ca/P in the 50-100 kg category than that recommended in the literature.

Keywords: Phytase; Weanling; Growing; Crude protein; Digestibility; Meta-analysis

INTRODUCTION

In recent decades, the growth performance of commercial pigs has increased. This may suggest that higher levels of Ca and P supplements are being provided in diets than are currently recommended [1,2] for optimization of skeletal integrity and growth performance [3,4]. Calcium and P are the first limiting minerals in commercial swine nutrition and are commonly supplemented in all diets apart from those tailored to the growth stage. In recent decades, there has been a controversial discussion regarding the effects of the dietary content of Ca and P, and their relative ratio, on biological efficiency, growth performance, and bone mineralization [5,6]. In diets with inadequate levels of P, low bone mineralization and energy metabolism can become growth-limiting factors [7,8] and therefore, high P levels are common in pig diets. However, the dietary requirement of P for pigs has not been well studied.

It is well known that high dietary Ca improves bone formation and bone ash content [1,8,9]; however, increased Ca in the diet has also been associated with decreased growth performance due to interactions with other absorbed minerals [10,11]. Ca interacts with inorganic P and phytate and decreases the activity of exogenous phytase [12]. Limestone, an important Ca source, has high acid-binding capacity, which can decrease the solubility of protein and P, subsequently reducing N and P digestibility [7,13]. Therefore, there is a negative correlation between dietary Ca levels and P utilization. Moreover, high doses of dietary Ca decrease the digestibility of food by forming soap with free saturated fatty acids [8,14]. High Ca and P dietary supplementation has increased environmental problems linked to the excessive excretion of manure in intensive pig production. In recent years, supplementation with phytase enzymes has been one of the most commonly used strategies to control environmental contamination and increase P utilization in farm animals. This meta-analysis aimed at developing a new feeding strategy based on the Ca to P ratio (Ca/P) and phytase enzyme supplementation through evaluating their effects on average daily gain (ADG), apparent total tract digestibility (ATTD) of Ca (ATTD-Ca), ATTD of P (ATTD-P), and crude protein (CP) digestibility in pigs from different bodyweight (BW) ranges.

MATERIALS AND METHODS

Literature search and database recording

For the meta-analysis, data sets were collected from the literature (ISI Web of Science and PubMed) by searching keywords. Recent papers published between 2010 and 2021 were considered for data analysis. Keywords selected were as follows: pigs, calcium, phosphate, feed, phytase, CP, and digestibility. Papers were screened for suitability before performing statistical analysis. First, research papers relating to gilt, sows, and cannula experiments were excluded, as were conference proceedings without clear results. Then, screened research papers that included information regarding dietary Ca and P contents, presence of phytase, and growth performance, were selected to set up the database. The results of literature screening are presented in Table 1. In total, 76 research papers with 296 to 372 data points per trait were selected. The BW range of the database was set to 6–100 kg. This range was divided into the following five BW categories: 6–11 kg, 11–25 kg, 25–50 kg, 50–75 kg, and 75–100 kg. All BW categories were then classified by the presence or absence of phytase in diets.

Table 1. Descriptive statistics in the databases
Weight (kg) Variable With phytase Without phytase
N Mean SD Min Max N Mean SD Min Max
7–11 Ca/P ratio 80 1.24 0.17 0.92 1.63 135 1.30 0.18 0.94 1.67
ADG 62 289.41 41.72 195.00 377.01 75 265.41 34.80 191.50 351.01
ATTD Ca 25 63.20 8.33 42.69 77.58 23 58.11 9.17 33.10 77.30
ATTD P 25 57.08 9.22 39.85 79.30 23 50.76 10.03 24.20 75.80
CP 48 79.07 1.58 71.22 80.75 63 74.62 2.83 70.36 79.97
11–25 Ca/P ratio 118 1.29 0.27 0.73 1.90 150 1.25 0.25 0.64 1.90
ADG 103 418.80 79.42 256.04 577.00 72 411.22 54.31 295.02 543.30
ATTD Ca 114 72.10 9.94 43.00 90.00 76 56.05 9.32 35.00 72.50
ATTD P 117 63.76 10.84 30.30 86.00 78 48.34 7.52 30.74 63.19
CP 109 79.40 1.03 74.10 81.25 99 73.35 2.72 66.55 79.50
25–50 Ca/P ratio 54 1.35 0.19 1.00 1.79 105 1.29 0.20 0.83 1.68
ADG 53 733.22 74.10 540.30 860.90 53 686.60 98.33 412.01 819.00
ATTD Ca 49 67.79 11.44 45.60 85.60 56 53.56 9.50 35.40 73.80
ATTD P 49 61.70 8.39 45.80 78.20 56 46.35 9.81 24.80 72.90
CP 51 79.46 3.73 70.19 88.60 62 73.19 2.49 69.50 78.75
50–75 Ca/P ratio 52 1.21 0.15 0.92 1.61 63 1.29 0.21 0.94 1.83
ADG 61 927.21 70.62 746.03 1,070.02 59 900.2 61.41 757.02 1,050.01
ATTD Ca 52 69.96 6.88 58.52 82.36 42 62.87 7.08 49.00 79.80
ATTD P 52 57.72 6.04 42.30 68.50 42 49.92 9.02 33.46 71.90
CP 60 78.57 2.68 71.25 83.21 47 74.65 5.07 61.28 82.47
75–100 Ca/P ratio 68 1.34 0.12 1.14 1.70 67 1.29 0.25 1.00 2.19
ADG 59 993.51 70.90 859.03 1,170.03 64 920.31 81.52 710.01 1,120.03
ATTD Ca 56 70.58 3.53 61.28 78.69 60 61.42 3.95 52.96 69.68
ATTD P 56 60.08 3.65 50.19 66.99 60 52.55 5.50 31.30 61.75
CP 59 78.85 3.87 70.62 86.28 67 74.18 2.95 65.25 79.33
Overall Ca/P ratio 372 1.28 0.20 0.73 1.90 520 1.28 0.22 0.64 2.19
ADG 338 623.72 297.41 195.04 1,170.00 323 605.41 284.03 191.52 1,120.01
ATTD Ca 296 69.14 9.01 42.69 90.00 257 58.34 8.64 33.10 79.80
ATTD P 299 60.55 8.71 30.30 86.00 259 49.61 8.64 24.20 75.80
CP 327 79.09 2.68 70.19 88.60 338 74.00 3.22 61.28 82.47

Ca/P, calcium to phosphorus ratio; ADG, average daily gain; ATTD, apparent total digestibility, Ca, calcium; P, phosphorus; CP, crude protein.

Download Excel Table
Statistical analysis

All statistical analyses were performed using SAS software (SAS ver. 9.0, SAS Institute, Cary, NC, USA). In order to determine the optimal dietary Ca/P for each of the five BW categories (with and without dietary phytase), we performed a secondary regression analysis of dietary Ca/P to estimate the optimal ADG, ATTD-Ca, ATTD-P, and CP digestibility. The quadratic regression equation used was as follows:

D i e t a r y C a / P = a X 2 + b X + c ,

where X includes ADG, ATTD-Ca, ATTD-P, and CP digestibility.

The regression models were estimated for the prediction of dietary Ca/P. The predictors of the secondary regression models were ADG (kg/d), ATTD-Ca (%), ATTD-P (%), and CP digestibility (%). The optimal value for Ca/P in diets was estimated as per the following formula:

O p t i m a l d i e t a r y C / P = a 2 b ,

where a is the coefficient of the quadratic term in the regression equation and b is the coefficient of the first term in the regression equation.

Bootstrapping was used to estimate the mean and standard error of the optimal value for Ca/P in diets. The results of the estimated regression models for each of the five BW categories (with two phytase classifications) are presented in Table 1. The prediction model for each category included ADG (kg/d), ATTD-Ca (%), ATTD-P (%), and CP digestibility (%).

RESULT

The 6–11 kg bodyweight category

Linear and quadratic regression analysis was used to predict the effects of Ca/P with or without phytase supplementation on ADG, ATTD-Ca, ATTD-P, and CP digestibility. A summary of parameter estimates and accuracy indices (root mean square error [RMSE]) is provided in Table 2. As this table shows, the intercepts of ADG and CP in the phytase-supplemented (PS) group, and the intercept of CP in the without-phytase (WP) group were significant in the 6–11 kg category. Additionally, Ca/P had linear and quadratic effects on ADG in the PS group (Fig. 1). In contrast, no Ca/P effects were observed for ATTD-Ca, ATTD-P, and CP digestibility in both the PS and WP groups.
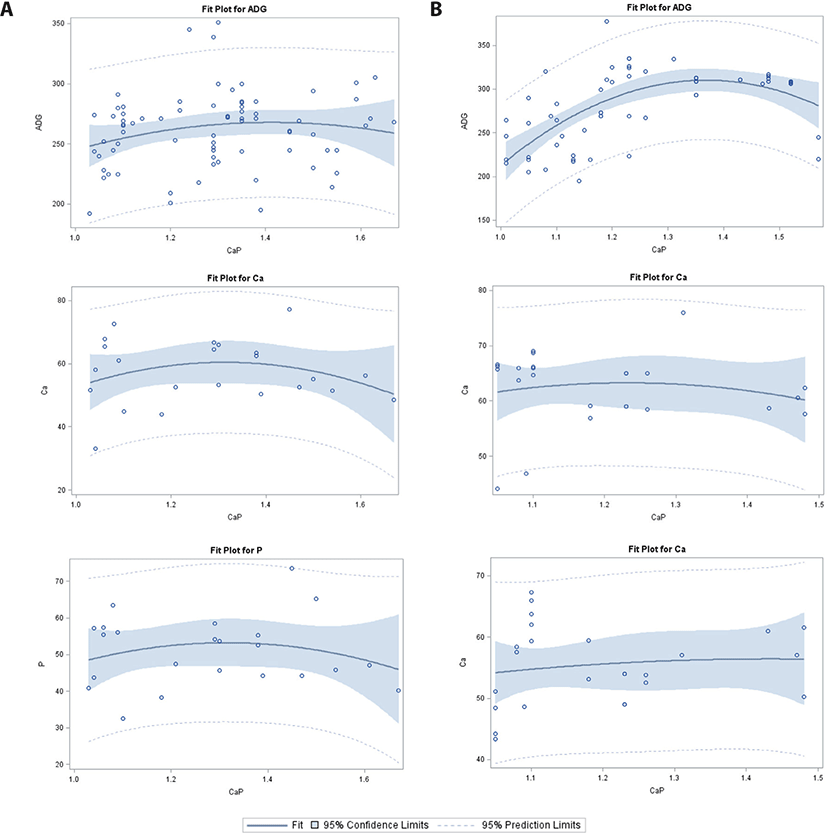
Table 2. Responses of pigs to calcium and phosphorus ratio to variations in ADG, ATTD of Ca, ATTD of P, and CP in different body weight categories
Weight (kg) Independent variable With phytase Without phytase
Obs Estimates SE t-value p-value Obs Estimates SE t-value p-value
6–11 Intercept 62 –1,034.10 281.20 –3.68 < 0.001 75 –2.19 197.40 –0.01 0.991
ADG 1,964.20 443.60 4.43 < 0.001 382.40 303.40 1.26 0.216
ADG2 –717.50 172.50 –4.16 0.001 –135.40 115.10 –1.18 0.243
Intercept 25 –13.06 122.80 –0.11 0.916 23 –76.59 104.60 –0.73 0.472
ATTD Ca 124.01 197.60 0.63 0.536 208.81 162.40 1.29 0.213
ATTD Ca2 –50.30 78.50 –0.64 0.527 –79.53 61.87 –1.29 0.213
Intercept 25 25.27 119.00 0.21 0.833 23 –46.58 100.60 –0.46 0.648
ATTD P 43.45 191.4 0.23 0.822 151.84 156.10 0.97 0.342
ATTD P2 –15.14 76.03 –0.20 0.843 –57.73 59.49 –0.97 0.343
Intercept 48 83.55 11.94 6.99 < 0.001 63 71.27 19.37 3.68 < 0.001
CP –4.13 19.05 –0.22 0.829 4.90 29.83 0.16 0.869
CP2 0.58 7.49 0.08 0.938 –1.72 11.30 –0.15 0.879
11–25 Intercept 103 –272.40 219.30 –1.24 0.217 72 19.90 445.50 0.04 0.964
ADG 965.40 334.60 2.86 0.005 540.80 704.50 0.77 0.445
ADG2 –338.27 125.50 –2.69 0.008 –198.10 274.40 –0.72 0.472
Intercept 114 58.70 22.60 2.60 0.010 76 22.14 31.14 0.71 0.479
ATTD Ca 26.10 34.90 0.75 0.456 63.74 46.17 1.38 0.171
ATTD Ca2 –13.00 13.10 –0.99 0.323 –27.76 16.65 –1.67 0.099
Intercept 117 66.28 26.98 2.46 0.015 78 35.27 31.43 1.12 0.265
ATTD P –2.22 41.45 –0.05 0.957 33.48 46.65 0.72 0.475
ATTD P2 –0.34 15.52 –0.02 0.982 –18.54 16.83 –1.1 0.274
Intercept 109 80.05 3.04 26.28 < 0.001 99 55.98 8.22 6.81 < 0.001
CP –1.37 4.67 –0.29 0.769 25.77 12.40 2.06 0.042
CP2 0.52 1.75 0.30 0.767 –9.01 4.61 –1.95 0.053
25–50 Intercept 53 –288.20 460.10 –0.63 0.533 53 –443.20 590.40 –0.75 0.456
ADG 1,413.20 685.70 2.06 0.044 1,721.30 903.80 1.9 0.063
ADG2 –482.10 252.90 –1.91 0.062 –642.00 340.90 –1.88 0.065
Intercept 49 –41.50 95.10 –0.44 0.665 56 –117.40 59.10 –1.99 0.052
ATTD Ca 161.00 147.50 1.09 0.28 262.80 91.50 2.87 0.066
ATTD Ca2 –58.80 56.50 –1.04 0.303 –99.10 34.90 –2.84 0.006
Intercept 49 –8.29 67.82 –0.12 0.903 56 –52.66 64.31 –0.82 0.416
ATTD P 102.74 105.10 0.98 0.333 154.10 99.40 1.55 0.127
ATTD P2 –37.30 40.28 –0.93 0.359 –58.84 37.95 –1.55 0.127
Intercept 51 24.99 18.89 1.32 0.192 62 42.04 13.910 3.02 0.004
CP 84.44 28.20 2.99 0.004 48.21 21.20 2.28 0.026
CP2 –32.06 10.44 –3.07 0.003 –18.25 7.92.00 –2.30 0.024
50–75 Intercept 61 –83.50 455.60 –0.18 0.855 59 –176.80 444.90 –0.40 0.692
ADG 1,592.90 700.00 2.28 0.056 1,823.90 717.30 2.54 0.014
ADG2 –608.20 265.20 –2.29 0.025 –761.00 286.90 –2.65 0.011
Intercept 52 –16.72 36.70 –0.46 0.65 42 2.33 24.00 0.10 0.923
ATTD Ca 131.20 55.70 2.36 0.022 88.50 32.70 2.70 0.010
ATTD Ca2 –50.91 20.80 –2.45 0.047 –31.50 10.70 –2.93 0.006
Intercept 52 6.75 39.86 0.17 0.866 42 –13.84 29.90 –0.46 0.646
ATTD P 85.17 60.46 1.41 0.165 93.44 40.78 2.29 0.057
ATTD P2 –34.76 22.58 –1.54 0.13 –32.76 13.33 –2.46 0.018
50–75 Intercept 60 48.74 15.20 3.20 0.002 47 –3.51 19.95 –0.18 0.861
CP 44.30 23.37 1.90 0.063 108.80 27.18 4.00 < 0.001
CP2 –16.11 8.85 –1.82 0.074 –34.65 8.88 –3.90 < 0.001
75–100 Intercept 59 1,460.80 1,371.00 1.07 0.291 64 83.80 426.10 0.20 0.844
ADG –680.20 2,046.00 –0.33 0.74 1,299.40 651.40 1.99 0.056
ADG2 244.80 760.10 0.32 0.748 –490.50 245.20 –2.00 0.050
Intercept 56 –66.60 62.90 –1.06 0.294 60 6.52 21.70 0.30 0.765
ATTD Ca 193.70 93.80 2.06 0.043 75.20 33.20 2.26 0.027
ATTD Ca2 –67.50 34.80 –1.94 0.048 –24.40 12.50 –1.95 0.036
Intercept 56 –117.27 70.72 –1.66 0.103 60 –14.94 31.50 –0.47 0.637
ATTD P 260.55 105.50 2.47 0.017 108.04 48.28 2.24 0.029
ATTD P2 –95.05 39.19 –2.43 0.019 –42.45 18.22 –2.33 0.023
Intercept 59 –17.04 82.14 –0.21 0.836 67 57.08 8.40 6.79 < 0.001
CP 143.14 122.50 1.17 0.247 24.49 11.59 2.11 0.038
CP2 –52.99 45.52 –1.16 0.249 –8.47 3.84 –2.20 0.031
Overall Intercept 338 –2,141.40 581.60 –3.68 < 0.001 323 –76.60 765.50 –0.10 0.920
ADG 41,110.10 887.70 4.63 < 0.001 1,188.80 1,187.00 1.00 0.317
ADG2 –1,493.70 335.00 –4.46 < 0.001 –503.60 454.80 –1.11 0.269
Intercept 296 48.60 16.50 2.94 0.004 257 12.23 14.83 0.82 0.410
ATTD Ca 33.40 25.29 1.32 0.187 71.70 21.58 3.32 0.001
ATTD Ca2 –13.65 9.57 –1.43 0.154 –27.20 7.69 –3.54 < 0.001
Intercept 299 66.32 17.04 3.89 < 0.001 259 14.85 15.19 0.98 0.329
ATTD P –8.47 26.02 –0.33 0.745 58.12 22.12 2.63 0.009
ATTD P2 3.05 9.81 0.31 0.755 –23.90 7.88 –3.03 0.003
Intercept 327 71.90 4.59 15.64 < 0.001 338 52.79 5.03 10.50 < 0.001
CP 11.19 7.01 1.60 0.112 30.61 7.25 4.22 < 0.001
CP2 –4.26 2.64 –1.61 0.108 –10.45 2.56 –4.09 < 0.001

ADG, average daily gain; ATTD, apparent total digestibility, Ca, calcium; P, phosphorus; CP, crude protein; Obs, number of observations.

Download Excel Table
jast-63-4-827-g1
Fig. 1. Fit plot of 6–11 kg body weight category. (A) without phytase, (B) with phytase.
Download Original Figure
The 11–25 kg bodyweight category

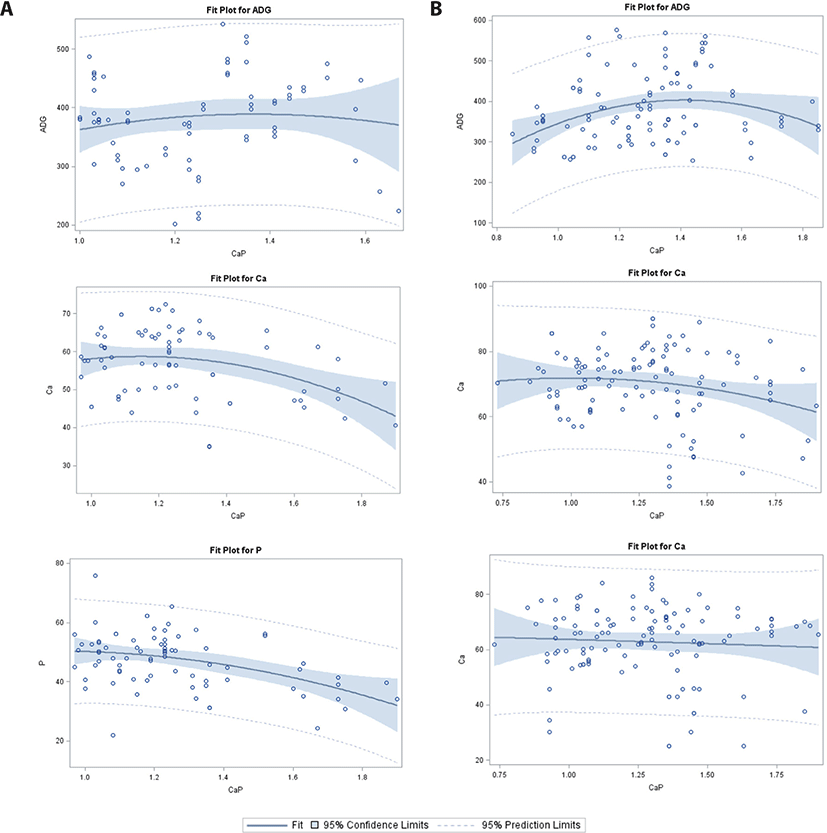
For changing Ca/P in the 11–25 kg BW category (Table 2; Fig. 2), intercepts of ATTD-Ca, ATTD-P, and CP in the PS group, and digestibility of CP in the WP group were significant. A significant linear and quadratic response to Ca/P was observed for ADG in the PS group; however, no effects were detected for ATTD-Ca and ATTD-P in the PS or WP group. The CP digestibility increased linearly in response to increasing Ca/P in the WP group.
jast-63-4-827-g2
Fig. 2. Fit plot of 11–25 kg body weight category. (A) without phytase, (B) with phytase.
Download Original Figure
The 25–50 kg bodyweight category

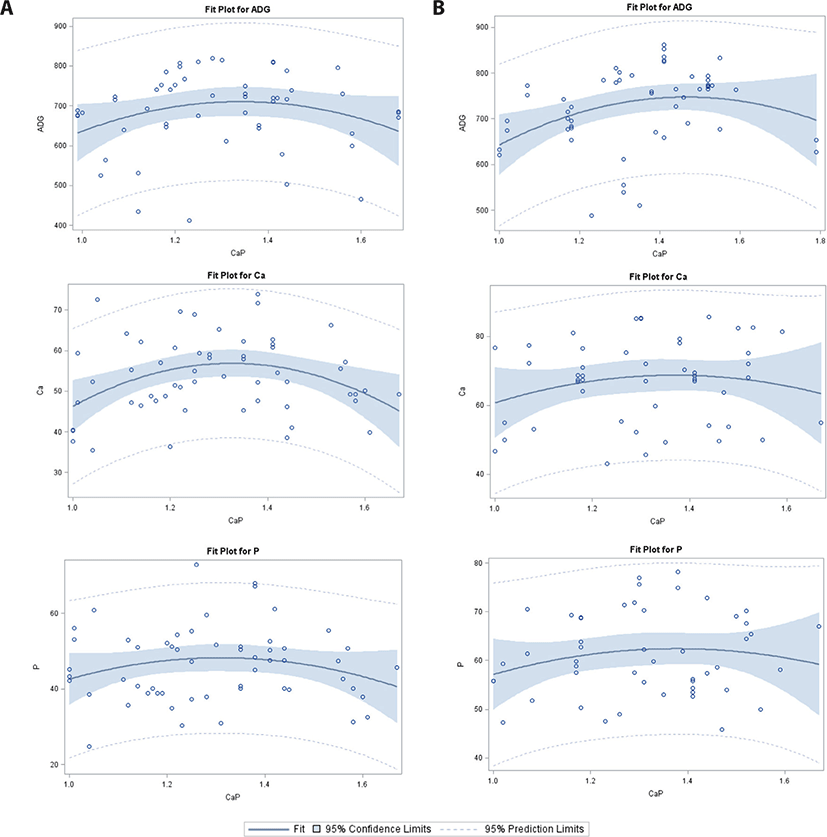
For Ca/P in the 25–50 kg category (Table 2; Fig. 3), significant intercepts were observed for ATTD-Ca and CP digestibility in the WP group; however, no significant intercepts were observed for ADG, ATTD-Ca, ATTD-P, and CP digestibility in the PS group. There was a linear response of ADG and linear and quadratic responses of CP digestibility in the PS group. However, no regression response was observed for ATTD-P in the PS or WP group. A linear and quadratic increase in CP digestibility and a quadratic effect on ATTD-Ca were observed in the WP group.
jast-63-4-827-g3
Fig. 3. Fit plot of 25–50 kg body weight category. (A) without phytase, (B) with phytase.
Download Original Figure
The 50–75 kg bodyweight category

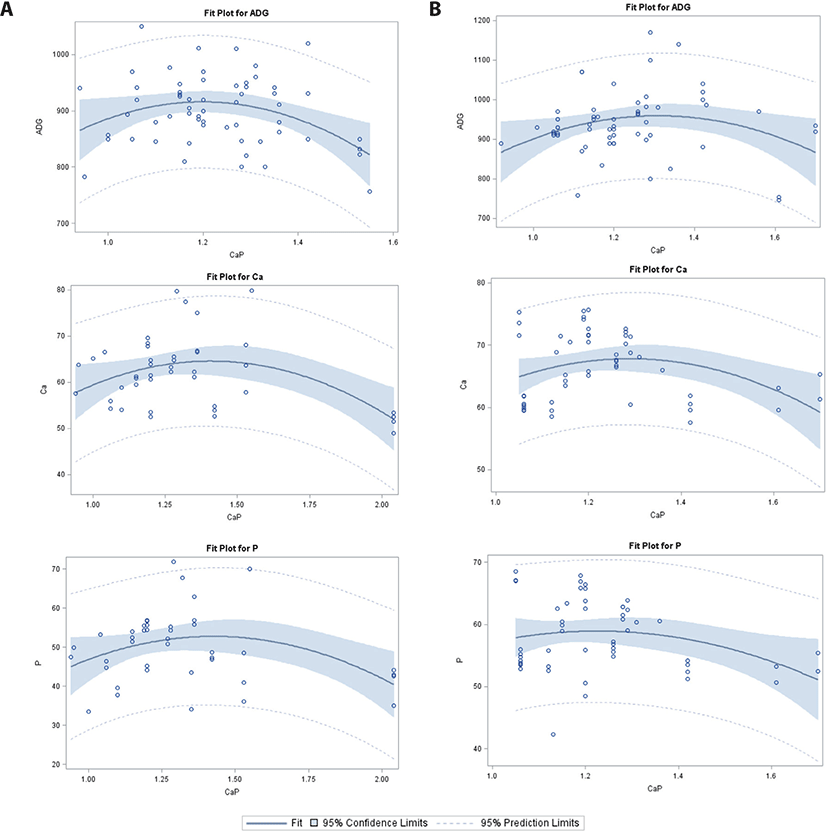
In the 50–75 kg BW category (Table 2; Fig. 4), there were significant intercepts for CP digestibility in the PS group, but no significant intercepts for ADG, ATTD-Ca, and ATTD-P in the PS or WP group. Using our equations, four different Ca/P effects were detected: 1) significant quadratic effects on ADG (PS and WP), 2) significant linear and quadratic effects on ATTD-Ca (PS and WP), 3) significant quadratic effects on ATTD-P (WP), and 4) a significant linear and quadratic increase in CP digestibility (WP).
jast-63-4-827-g4
Fig. 4. Fit plot of 50–75 kg body weight category. (A) without phytase, (B) with phytase.
Download Original Figure
The 75–100 kg bodyweight category

In the 75–100 kg category (Table 2, Fig. 5), there was a significant intercept for ADG in the PS group, and CP digestibility in the WP group. The linear and quadratic regression analysis showed a significant decrease in ATTD-Ca and ATTD-P in the PS and WP groups. No effects of Ca/P were observed for ADG in the PS or WP group, or for CP digestibility in the PS group; however, in the WP group, a linear and quadratic increase in ADG was detected as Ca/P increased.
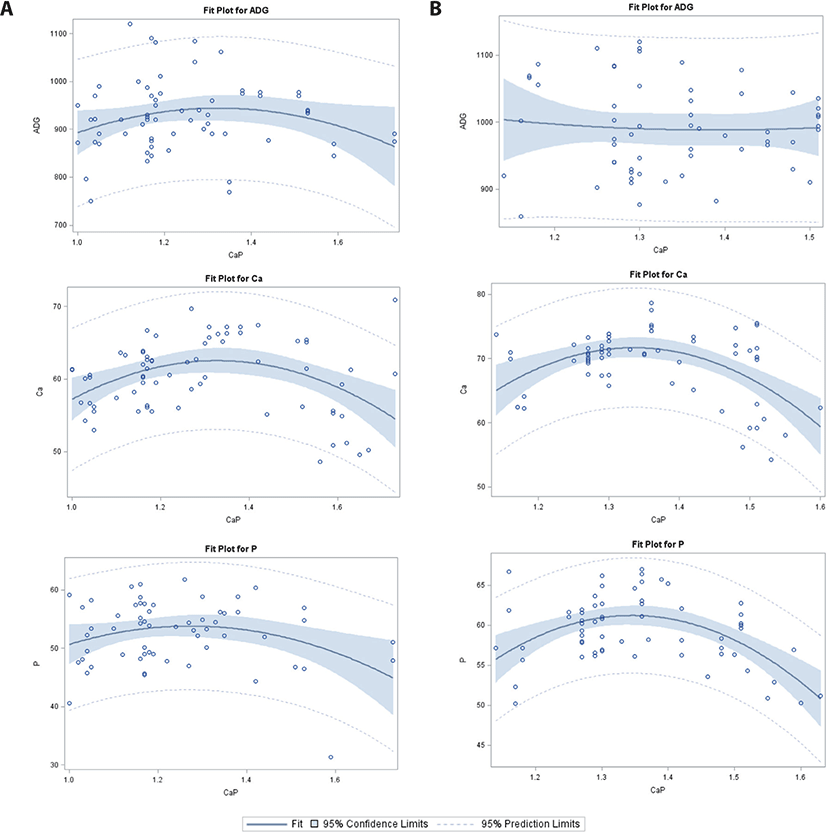
jast-63-4-827-g5
Fig. 5. Fit plot of 75–100 kg body weight category. (A) without phytase, (B) with phytase.
Download Original Figure
All bodyweights

Overall, the analysis showed significant intercept differences for ADG, ATTD-Ca, ATTD-P, and CP digestibility in the PS and WP groups. The independent variables, Ca/P and phytase addition, led to a linear and quadratic increase in ADG in the PS group. In the WP group, ATTP-P and ATTD-Ca decreased linearly as Ca/P increased; however, CP digestibility had positive linear and quadratic responses to increased Ca/P.

DISCUSSION

Due to the importance of growth performance and environmental issues, various meta-analyses or reviews dealing with the influence of Ca/P or phytase supplementation on P or Ca utilization and growth performance in pigs have been reported previously [1,2,8,9]. However, genetic improvements have the potential to change the response of pigs to Ca and P supplementation; to the best of our knowledge, no meta-analysis has reviewed dietary Ca/P requirements in pigs. The current meta-analysis focuses on published data from 2010 onwards and offers a potential method for evaluating Ca and P requirements and their interactions with phytase supplementation. Pig Ca and P requirements were analyzed according to BW. A multi-criteria procedure, including available P, bone mineralization, and BW gain should be considered for balancing diets based on new recommendations regarding Ca and P levels, as should dietary phytase supplementation. We found that increasing Ca/P in the PS group increased the growth performance of pigs in the 6–11 and 11–25 kg BW categories. Despite the positive role of low dietary Ca in growth performance [2], there are some limitations associated with reduced Ca depending on growth stage. Low dietary Ca compromises bone mineralization when dietary P is high. Therefore, Ca supplementation is associated with phytase because of the significant increase in P availability that occurs when phytate bonds are broken [1,2,15]. Low bioavailability of Ca compromises the deposition of P in bone, increasing loss of P through urine [9]. Low bone mass during skeletal development is known as osteoporosis, which is characterized by low Ca and P deposition [16,17]. Ca absence is considered an important factor in the development of skeletal disorders and decreased growth performance [5,6]. Importantly, Ca and P retention was not decreased by Ca/P in the 6–11, 11–25, and 25–50 kg BW categories; this explains the linear increase in ADG with increasing Ca/P.

Digestibility of Ca in pig production is not only affected by Ca level, but also by the exogenous phytase and Ca/P to which the pigs are subjected, as well as the growth stage [5,18]. For pigs, the aim is to optimize BW while decreasing Ca excretion. Optimum growth performance and bone formation with minimum P excretion is also a target. No differences in ATTD-P and ATTD-Ca were observed as a result of phytase supplementation in low-weight categories. This may be due to the diets provided after weaning, which are based primarily on highly digestible ingredients; in these conditions, changes in the Ca level did not affect the efficiency of the phytase enzyme. In high-weight categories (50–75 and 75–100 kg) ATTD was decreased by increasing Ca/P. It is likely that the high Ca content in diets compromises the absorption of Ca. Importantly, the formation of Ca-phytate complexes varies based on pH; as the pH increases, the solubility of Ca-phytate decreases [2,3,8]. Limestone, as the main Ca source in diets, increases the buffering capacity of digestion [16], resulting in increased Ca-phytate formation. It has been reported that a 0.5% increase in dietary Ca decreases the digestibility of P by 56% [19]. Therefore, to improve phytase activity, the level of Ca should be reduced in PS diets when considering skeletal formation or growth performance to increase the bioavailability of Ca. Quadratic responses have been identified for ATTD-Ca: the digestibility of Ca increased with increasing Ca/P until reaching a plateau; then, it linearly decreased, reaching the minimum digestibility. This may explain the quadratic result obtained in the 50–75 and 75–100 kg BW categories in the present study.

Digestibility represents the main factor in determining dietary P efficiency in farm animals. A considerable amount of P in grains is in the form of phytate; this is mostly unavailable or poorly absorbed by pigs, due to the lack of phytase in their intestine. Therefore, nutritional strategies for P addition in pig diets have been explored to reduce the excretion of P and improve growth performance, by fitting linear and quadratic regression models containing the explanatory variable of the P digestibility coefficient. Our results show that the effects of Ca/P on ATTD-P are significant in the 75–100 kg category, resulting in decreased digestibility of P through increased Ca/P. P bioavailability is regarded as one of the main factors adversely influencing bone mineralization and pig performance in the swine industry [3]. The results of the current study show the importance of Ca/P in the 75–100 kg BW category in phytase-supplemented diets. Supplementation with exogenous phytase enzyme to reduce P excretion has become a common practice in swine nutrition because excreted P has several adverse effects on the environment. This is especially the case when pigs are supplemented in excessive doses, as when trying to maintain growth requirements [12,20]. In our database, the P that represented the principal supplementary P source was mainly mono-calcium phosphate and di-calcium phosphate, being present in 94% of experimental diets evaluated. However, our analysis showed no difference between P sources. It is reported that Ca/P range commonly falls between 1:1 to 1.7:1; thus, it was expected that the target P requirement values must be within this range. The results also show that Ca/P is not an effective parameter in P absorption in younger pigs; this was the case in both the PS and WP groups. It is accepted that higher Ca or Ca/P will result in a decrease in the efficiency of phytase enzyme by forming insoluble Ca-phytate complexes [1,8,21]. Therefore, it is likely that phytate may not be entirely hydrolyzed in the intestine due to solubility limitations and interactions with Ca.

This study aimed to better predict the effect of Ca/P and exogenous phytase enzyme on protein digestibility. The model generated herein indicated that Ca/P affects protein digestibility of pigs in PS and WP groups in higher BW categories (50–100 kg). With the increase in Ca/P from 1:1 to 1:1.7, the digestibility of CP was increased. Although several hypotheses are available to explain the adverse effect of phytate on nutrient digestibility, there is still uncertainty shrouding the mode of action involved. Interactions between phytates and proteins may be determining factors in evaluating the effect of phytate on protein digestibility [7,13]. The structure of proteins can be changed through these interactions, thereby reducing the solubility of proteins and decreasing the accessibility of protease to accomplish the hydrolysis process [2]. However, interestingly, there appears to be a greater effect of exogenous phytase on CP digestibility in heavier pigs than in weanling pigs. This may be due to the types of diets utilized in weaning or growing periods. Although many hypotheses have been stated to evaluate the role of phytic acid in decreasing protein digestibility (by forming phytate-protein complexes) [1], our results indicate that CP digestibility improves when Ca/P is increased, regardless of exogenous phytase supplementation. However, these results are still in agreement with Humer et al. [2], who reported that increasing Ca/P leads to a decrease in dietary phytate. Therefore, low dietary phytate content may decrease protein interactions and facilitate their absorption. It should be noted that there are strong kosmotropic influences of anionic phosphoryl groups in phytate, which stabilize protein structures by affecting the aqueous medium around the molecule [7,22]. The total secretion of mucin in the intestine increases by interacting with phytase [12,23,24], resulting in an increased loss of endogenous amino acids due to the low digestibility of mucin structural proteins. Another effect of phytate on protein digestibility in the intestinal lumen is associated with the phytase interaction that increases sodium ion (Na+) influx into the intestine. The high buffering capacity of Na+, triggers the secretion of hydrochloric acid (HCL), which reduces the digestibility of proteins [1,25]. Therefore, when considering CP digestibility, a lower P and higher Ca/P are recommended in growing and finishing pigs.

CONCLUSION

Overall, the present meta-analysis showed that phytase supplementation and to a lesser extent, Ca/P are key factors in affecting the growth performance of pigs. Results demonstrated that increased Ca/P decreases Ca and P retention in pigs in heavier categories (50–100 kg); however, it is not a determinant factor in Ca and P retention in lower weight pigs (6–25 kg). Increased Ca/P can increase CP digestibility in a wide BW range (11–100 kg). Based on our results, we suggest that the best practice would be to increase Ca levels in weanling pig diets and reduce Ca levels in diets for finishing pigs.

Competing interests

No potential conflict of interest relevant to this article was reported.

Funding sources

This research was funded by Rural Development Administration, grant number “PJ01448503”.

Acknowledgements

Not applicable.

Availability of data and material

Upon reasonable request, the datasets of this study can be available from the corresponding author.

Authors’ contributions

Conceptualization: Jeon SM, Hosseindoust A, Lee SH, Kim JS.

Data curation: Jeon SM, Moturi J.

Formal analysis: Jeon SM, Hosseindoust A.

Methodology: Jeon SM, Hosseindoust A, Kim TG, Lee SD.

Software: Jeon SM, Hosseindoust A, Kim JS.

Validation: Jeon SM, Hosseindoust A, Ha SH.

Investigation: Jeon SM, Hosseindoust A, Mun JY, Sa SJ, Choi YH.

Writing - original draft: Jeon SM, Hosseindoust A, Kim JS.

Ethics approval and consent to participate

The project underwent proper ethical standards and the experiments (KW-170519-1) were approved by the Institutional Animal Care and Use Committee of Kangwon National University, Chuncheon, Korea.

REFERENCES

1.

Selle PH, Cowieson AJ, Cowieson NP, Ravindran V. Protein-phytate interactions in pig and poultry nutrition: a reappraisal. Nutr Res Rev. 2012; 25:1-17

2.

Humer E, Schwarz C, Schedle K. Phytate in pig and poultry nutrition. J Anim Physiol Anim Nutr. 2014; 99:605-25

3.

Dersjant-Li Y, Awati A, Schulze H, Partridge G. Phytase in non-ruminant animal nutrition: a critical review on phytase activities in the gastrointestinal tract and influencing factors. J Sci Food Agric. 2015; 95:878-96

4.

Mahajan A, Alexander LS, Seabolt BS, Catrambone DE, McClung JP, Odle J, et al. Dietary calcium restriction affects mesenchymal stem cell activity and bone development in neonatal pigs. J Nutr. 2011; 141:373-9

5.

Almeida FN, Sulabo RC, Stein HH. Effects of a novel bacterial phytase expressed in Aspergillus oryzae on digestibility of calcium and phosphorus in diets fed to weanling or growing pigs. J Anim Sci Biotechnol. 2013; 4:8

6.

Schlegel P, Gutzwiller A. Dietary calcium to digestible phosphorus ratio for optimal growth performance and bone mineralization in growing and finishing pigs. Animals. 2020; 10:178

7.

Zouaoui M, Létourneau-Montminy MP, Guay F. Effect of phytase on amino acid digestibility in pig: a meta-analysis. Anim Feed Sci Technol. 2018; 238:18-28

8.

Selle PH, Cowieson AJ, Ravindran V. Consequences of calcium interactions with phytate and phytase for poultry and pigs. Livest Sci. 2009; 124:126-41

9.

Spencer JD, Allee GL, Sauber TE. Phosphorus bioavailability and digestibility of normal and genetically modified low-phytate corn for pigs. J Anim Sci. 2000; 78:675-81

10.

González-Vega JC, Walk CL, Liu Y, Stein HH. The site of net absorption of Ca from the intestinal tract of growing pigs and effect of phytic acid, Ca level and Ca source on Ca digestibility. Arch Anim Nutr. 2014; 68:126-42

11.

Bradbury EJ, Wilkinson SJ, Cronin GM, Walk CL, Cowieson AJ. Effects of phytase, calcium source, calcium concentration and particle size on broiler performance, nutrient digestibility and skeletal integrity. Anim Prod Sci. 2016; 58:271-83

12.

Cowieson AJ, Bedford MR, Selle PH, Ravindran V. Phytate and microbial phytase: implications for endogenous nitrogen losses and nutrient availability. Worlds Poult Sci J. 2009; 65:401-18

13.

Cowieson AJ, Ruckebusch JP, Sorbara JOB, Wilson JW, Guggenbuhl P, Tanadini L, et al. A systematic view on the effect of microbial phytase on ileal amino acid digestibility in pigs. Anim Feed Sci Technol. 2017; 231:138-49

14.

Antezana W, Calvet S, Beccaccia A, Ferrer P, De Blas C, García-Rebollar P, et al. Effects of nutrition on digestion efficiency and gaseous emissions from slurry in growing pigs: III. influence of varying the dietary level of calcium soap of palm fatty acids distillate with or without orange pulp supplementation. Anim Feed Sci Technol. 2015; 209:128-36

15.

Woyengo TA, Nyachoti CM. Review: anti-nutritional effects of phytic acid in diets for pigs and poultry – current knowledge and directions for future research. Can J Anim Sci. 2013; 93:9-21

16.

Blavi L, Perez JF, Villodre C, López P, Martín-Orúe SM, Motta V, et al. Effects of limestone inclusion on growth performance, intestinal microbiota, and the jejunal transcriptomic profile when fed to weaning pigs. Anim Feed Sci Technol. 2018; 242:8-20

17.

Tatara MR, Śliwa E, Krupski W. Prenatal programming of skeletal development in the offspring: effects of maternal treatment with β-hydroxy-β-methylbutyrate (HMB) on femur properties in pigs at slaughter age. Bone. 2007; 40:1615-22

18.

An J, Cho J. Wheat phytase can alleviate the cellular toxic and inflammatory effects of lipopolysaccharide. J Anim Sci Technol. 2021; 63:114-24

19.

Tamim NM, Angel R, Christman M. Influence of dietary calcium and phytase on phytate phosphorus hydrolysis in broiler chickens. Poult Sci. 2004; 83:1358-67

20.

Akter M, Graham H, Iji PA. Response of broiler chickens to diets containing different levels of sodium with or without microbial phytase supplementation. J Anim Sci Technol. 2019; 61:87-97

21.

Lei XG, Ku PK, Miller ER, Yokoyama MT, Ullrey DE. Calcium level affects the efficacy of supplemental microbial phytase in corn–soybean meal diets of weanling pigs. J Anim Sci. 1994; 72:139-43

22.

Gemede HF. Potential health benefits and adverse effects associated with phytate in foods: a review. Glob J Med Res. 2014; 27:2224-6088

23.

Mesina VGR, Lagos LV, Sulabo RC, Walk CL, Stein HH. Effects of microbial phytase on mucin synthesis, gastric protein hydrolysis, and degradation of phytate along the gastrointestinal tract of growing pigs. J Anim Sci. 2019; 97:756-67

24.

Lu H, Shin S, Kuehn I, Bedford M, Rodehutscord M, Adeola O, et al. Effect of phytase on nutrient digestibility and expression of intestinal tight junction and nutrient transporter genes in pigs. J Anim Sci. 2020; 98:skaa206

25.

Dersjant-Li Y, Verstegen MWA, Schulze H, Zandstra T, Boer H, Schrama JW, et al. Performance, digesta characteristics, nutrient flux, plasma composition, and organ weight in pigs as affected by dietary cation anion difference and nonstarch polysaccharide. J Anim Sci. 2001; 79:1840-8