RESEARCH ARTICLE

Supplementation of protease with low protein diets improves incidence of frequency and nitrogen metabolism in weaned pigs

Jaewoo An1,#https://orcid.org/0000-0002-5602-5499, Jihwan Lee2,#https://orcid.org/0000-0001-8161-4853, Minho Song3,#https://orcid.org/0000-0002-4515-5212, Hanjin Oh1https://orcid.org/0000-0002-3396-483X, Seyeon Chang1https://orcid.org/0000-0002-5238-2982, Dongcheol Song1https://orcid.org/0000-0002-5704-603X, Hyunah Cho1https://orcid.org/0000-0003-3469-6715, Sehyun Park1https://orcid.org/0000-0002-6253-9496, Kyeongho Jeon1https://orcid.org/0000-0003-2321-3319, Hyeun Bum Kim4,*https://orcid.org/0000-0003-1366-6090, Jinho Cho1,*https://orcid.org/0000-0001-7151-0778
Author Information & Copyright
1Department of Animal Science, Chungbuk National University, Cheongju 28644, Korea
2Department of Poultry Science, University of Georgia (UGA), Athens, GA 30602, USA
3Department of Animal Science and Biotechnology, Chungnam National University, Daejeon 34134, Korea
4Department of Animal Biotechnology, Dankook University, Cheonan 31116, Korea

#These authors contributed equally to this work.

*Corresponding author: Hyeun Bum Kim, Department of Animal Biotechnology, Dankook University, Cheonan 31116, Korea, Tel: +82-41-550-3653, E-mail: hbkim@dankook.ac.kr
*Corresponding author: Jinho Cho, Division of Animal Science, Chungbuk National University, Cheongju 28644, Korea, Tel: +82-43-261-2544, E-mail: jinhcho@chungbuk.ac.kr

© Copyright 2025 Korean Society of Animal Science and Technology. This is an Open-Access article distributed under the terms of the Creative Commons Attribution Non-Commercial License (http://creativecommons.org/licenses/by-nc/4.0/) which permits unrestricted non-commercial use, distribution, and reproduction in any medium, provided the original work is properly cited.

Received: Aug 04, 2023; Revised: Dec 13, 2023; Accepted: Mar 10, 2024

Published Online: May 31, 2025

Abstract

The purpose of this study was to determine the effect of different crude protein (CP) levels and protease (PT) supplementation on effect in weaned pigs. A total of 24 barrow weaned pig, 7-week-old and with an initial weight of 10.94 ± 1.26 kg, were performed in the 2-week experiment. The experiment followed a 2 × 2 factorial design with two levels of CP (18.78% and 16.92%) and two levels of PT supplementation (0, 0.1%). No difference was observed in growth performance by the variations in CP and PT levels. In fecal score, the low CP (LP) diet showed an increased frequency of 0 scores compared to the high CP (HP) diet. The apparent total tract digestibility (ATTD) of dry matter (DM) increased during the first week in the LP diet compared to the HP diet. At second week, the ATTD of DM was increased in the LP diet compared to the HP diet and the ATTD of CP increased in the PT10 compared to the PT0. Also, DM had an interaction between CP and PT. In the ATTD of amino acids in the first week, the LP diet had a higher methionine digestibility than the HP diet, and the tryptophan digestibility was higher in the HP diet than the LP diet. In second week, the PT10 diet had a higher digestibility than the PT0 diet for indispensable amino acids excluding lysine and tryptophan, and for methionine, the LP diet had a higher digestibility than the HP diet. In the ATTD of indispensable amino acids, the digestibility of threonine, isoleucine, leucine, arginine, and methionine was higher in the PT10 diet compared to the PT0 diet. Blood urea nitrogen (BUN) and hydrogen sulfide (H2S) gas emissions were decreased in the LP diet and PT10 compared to HP and PT0. In the nitrogen utilization, total excretion decreased in the LP and PT10 compared to HP and PT0, and the nitrogen retention ratio increased at second week. In this study, supplementation of PT in the LP diet can improve weaned pig’s fecal score, nutrients digestibility, BUN, H2S emission, and nitrogen utilization in weaned pigs.

Keywords: Protease; Protein levels; Nutrients digestibility; Nitrogen utilization; Weaned pigs

INTRODUCTION

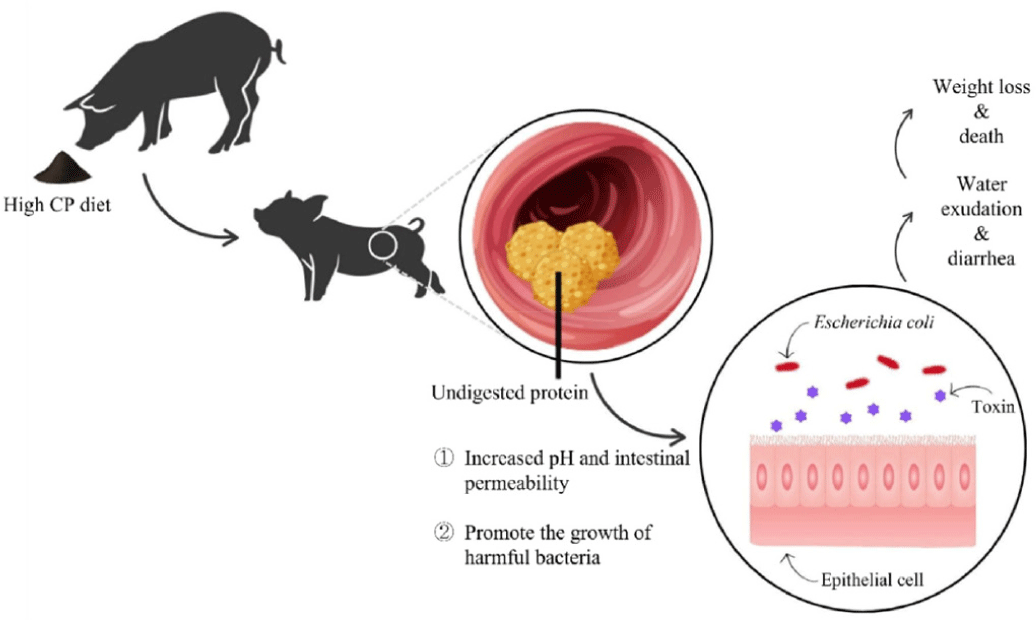
Post-weaning diarrhea (PWD) is a serious disease that causes low growth performance and mortality in weaned pig [1,2]. High concentrations of crude protein (CP) can cause undigested proteins to pass the gastrointestinal tract, increasing intestinal permeability and encouraging the growth of harmful bacteria due to an elevation in intestinal pH [3-5] (Fig. 1). Anti-nutritional factors (ANF) (e.g., trypsin inhibitor, antigens, lectins) present in soybean are sensitive factors causing diarrhea in weaned pigs [6].

jast-67-3-549-g1
Fig. 1. Effects of high crude protein diet on weaned pig. CP, crude protein.
Download Original Figure

The low CP (LP) diet reduces the incidence of diarrhea in weaned pigs due to its LP content and ANF contents [6,7]. According to the results of previous study, the LP diet reduced blood urea nitrogen (BUN) in pigs [8]. However, feeding a LP diet without any supplementation reduced the growth performance of weaned pigs [7,9]. Protease (PT) is an exogenous enzyme that helps in the digestion of proteins [10]. Exogenous PT improves intestinal villus height, crypt depth and increases digestive enzyme activity in weaned pigs, with these effects increasing digestibility, decreasing the incidence of diarrhea and finally improving growth performance [11]. Moreover, the supplementation of PT in the diet of weaned pigs increases protein utilization and reduces nitrogen excretion [12]. This study hypothesizes that the decrease in growth performance caused by the feeding of an LP diet will be improved by supplementing with PT, causing a greater expected effect on weaned pigs. Thus, the aim of this study was to determine whether PT supplementation in weaned pig diets at different protein levels could improve growth performance, fecal score, nutrients digestibility, blood characteristics, odor emission, bacteria count, and nitrogen utilization.

MATERIALS AND METHODS

Ethics

The experimental protocol was approved (CBNUA-2008-22-01) by the Institutional Animal Care and Use Committee of Chungbuk National University, Cheongju, Korea.

Animal and facilities

A total of 24 weaned pigs ([Yorkshire × Landrace] × Duroc), 7-week-old, with an initial weight of 10.94 ± 1.26 kg, were selected for the study. The metabolic experiment was conducted over a period of 14 days. Pigs were individually and completely randomized in metabolic cages of 45 × 55 × 45 cm, with 6 replicates per treatment and 1 pig per replicate based on the initial body weight (BW). The experiment was carried out in an environment with a temperature of 28 ± 1.5°C, a relative humidity of 72 ± 2.3% and a wind speed of 0.26 ± 0.04 m/s.

Dietary treatments

The nutrient composition of all diets is formulated to meet or exceed the requirements set by the National Research Council [13]. The nutrient composition of all diets (Table 1) is formulated. The analyzed nutrient levels in CP were determined using the AOAC method 988.05, as specified in the AOAC [14] method. Amino acids were assayed using ion-exchange chromatography with an automatic amino acid analyzer (L-8800 Hitachi Automatic Amino Acid Analyzer, Hitachi, Tokyo, Japan) following hydrolysis with 6 M HCl at 110°C for 24 hours. Cystine was quantified as cysteic acid, and methionine was measured as methionine sulphone, both after peroxidation with performic acid and pre-column derivatization using phenylisothiocyanate (L-8800 Hitachi Automatic Amino Acid Analyzer, Hitachi). Tryptophan analysis was performed by hydrolyzing the samples with 4 M NaOH at 110°C for 22 hours, followed by derivatization using phenylisothiocyanate (Model 76337, Agilent Technologics, Waldbronn, Germany). The experimental design employed a 2 × 2 factorial design based on the following factors: (1) CP content in the basal diet (18.78%) or a LP diet (16.92%) with a 10% reduction compared to the CP content in the basal diet, and (2) Non-supplementation of PT or supplementation of 0.1% PT. The PT was provided by a commercial company (Pearlzyme, Incheon, Korea). According to the supplier, the Bacillus sp. that produces alkaline PT was dried after fermentation, mixed with excipients, and quantified to an enzyme activity of 10,000 U/g.

Table 1. Compositions of the basal and low crude protein diets (as-fed basis).
Ingredient (%) Basal diet Low crude protein diet
Corn 60.81 66.12
Extruded corn 5.00 5.00
Lactose 3.00 3.00
Dehulled soybean meal (51% CP) 13.00 8.07
Soy protein concentrate (65% CP) 10.00 10.00
Plasma powder 3.00 2.50
Soy oil 2.00 2.00
Monocalcium phosphate 1.15 1.15
Limestone 0.99 0.99
L-Lysine-HCl (78%) 0.04 0.07
DL-Methionine (50%) 0.11 0.30
Choline chloride (25%) 0.10 0.10
Vitamin premix1) 0.20 0.20
Trace mineral premix2) 0.20 0.20
Salt 0.40 0.30
Total 100 100
Calculated nutrient levels
 ME (kcal/kg) 3,386 3,385
 CP (%) 18.78 16.92
 Lysine 1.23 1.23
 Methionine 0.36 0.36
 Ca (%) 0.70 0.70
 P (%) 0.60 0.60
Analyzed nutrient levels
 CP (%) 20.53 18.51
 Lysine 1.23 1.23
 Methionine 0.36 0.36
 Tryptophan 0.19 0.15
 Arginine 0.70 0.65
 Isoleucine 0.76 0.74
 Leucine 1.47 1.42
 Phenylalanine 0.86 0.81
 Threonine 0.78 0.74
 Valine 0.88 0.87
 Histidine 0.53 0.50

1) Provided per kg of complete diet: vitamin A, 11,025 IU; vitamin D3, 1,103 IU; vitamin E, 44 IU; vitamin K, 4.4 mg; riboflavin, 8.3 mg; niacin, 50 mg; thiamine, 4 mg; d-pantothenic, 29 mg; choline, 166 mg; vitamin B12, 33 μg.

2) Provided per kg of complete diet without Zinc: Cu (as CuSO4 · 5H2O), 12 mg; Mn (as MnO2), 8 mg; I (as KI), 0.28 mg; and Se (as Na2SeO3 · 5H2O), 0.15 mg.

CP, crude protein; ME, metabolizable energy.

Download Excel Table
Sampling and measurements
Growth performance and fecal score

BW was measured at the beginning of the experiment, as well as at 7 and 14 days. Feed intake (FI) was calculated by measuring the daily diet supply amount and residual amount. Average daily gain (ADG), average daily feed intake (ADFI), and feed efficiency (G:F) were calculated for each period: 0-7 days, 7–14 days, and 0–14 days. The fecal score was observed and recorded twice a day (at 8:00 and 17:00) by the same individual. The fecal score was assigned as follows: 0, normal feces; 1, soft feces; 2, mild diarrhea; 3, severe diarrhea.

Nutrients digestibility and nitrogen utilization

After the start of the experiment, chromium oxide (Cr2O3) was added to the diet at a rate of 0.2% on 5 and 12 days as a marker for a two-day period, and all feces and urine with the markers were collected. Urine was collected in a plate filled with 50 mL of 6 mol/L HCl under the metabolic cage. The total weight of the collected fresh diet, fecal, and urine samples were measured and stored at −20°C, and the collected samples were dried in a dryer at 60°C for 72 hours, then pulverized with a Wiley mill and used for analysis. Dry matter (DM) was determined using AOAC method 930.15 and CP and amino acids were determined using “Dietary treatments” were analyzed as described. Gross energy was measured with an adiabatic oxygen bomb calorimeter (Parr Isoperibol Bomb Calorimeter 6400, Parr Instrument, Moline, IL, USA).

For calculating the apparent total tract digestibility (ATTD) of the nutrients, we used the following equation: Digestibility = 1 − [(Nf × Cd)/(Nd × Cf)] × 100, where Nf = concentration of nutrient in fecal, Nd = concentration of nutrient in the diet, Cd = concentration of chromium in the diet, and Cf = concentration of chromium in the fecal.

Blood profiles

Blood was collected from the jugular veins of all pigs using serum separator tube, respectively, to collect of blood. Serum samples were centrifuged at 4°C at 3,000 rpm for 15 minutes after collection. The total protein level was determined using a colorimetric assay, while the BUN level was analyzed using the glutamate dehydrogenase (GLDH) method for urea. Both total protein and BUN levels in the blood samples were determined using a fully automated chemistry analyzer (Cobas C702, Hofmann-La Roche, Basel, Switzerland) for clinical chemistry analysis. Serum biochemical test was analyzed for Immunoglobulin G using an automatic biochemical blood analyzer (Hitachi 747, Hitachi).

Odor emission

For the analysis of odor emission, 150 g of fresh feces collected through rectal massage from all pigs on the 7 days and 14 days of the experiment and 100 g of urine + sawdust was mixed, stored in a 4.2 L plastic box, and fermented at 34°C for 72 hours. The amount of ammonia (NH3) and hydrogen sulfide (H2S), which are odor-causing substances, was analyzed through a gas detector (GV-110S, Gastec, Ayase, Japan) using an NH3 detector tube and a H2S detector tube, respectively.

Bacteria count

After collecting feces from all pigs by rectal massage on the 7 days and 14 days of the experiment, the feces were suspended in sterile physiological saline and homogenized, and then diluted from 10−3 to 10−7 as samples for measuring the number of microorganisms. was used. To measure the number of Lactobacillus and Escherichia coli (E. coli) bacteria in feces by experimental treatment, de man, rogosa and sharpe (MRS) agar was used for Lactobacillus and MacConkey agar (Difco, Tucker, GA, USA) was used for E. coli. At 37°C, Lactobacillus for 48 hours, E. coli for After culturing for 24 hours, the number of bacteria was measured.

Statistical analysis

Data on growth performance, nutrient digestibility, blood characteristics, bacteria count, and nitrogen utilization were tested for significance between the means using the two-way analysis of variance of SAS (SAS Institute, Cary, NC, USA). Means were separated using the Tukey test. Fecal score was Chi-squared test using SAS’s FREQ method. The other analysis content a statistically significant difference was recognized at a significance level of 0.05 or less, and a 0.05 ≤ p < 0.10 was considered tendency.

RESULTS

Growth performance and fecal score

There was no significant difference in growth performance due to different CP levels and PT supplementation (Table 2). The fecal score significantly decreased (p < 0.05) with varying CP levels and showed a significant interaction (p < 0.05) between CP levels and PT supplementation (Fig. 2).

Table 2. Effect of supplemental protease on growth performance with different CP levels in weaned pig
Variables Basal1) Low SE CP PT2) p-value
0% 0.1% 0% 0.1% HP LP 0 10 CP PT CP × PT
BW (kg)
 Initial 10.962 10.925 10.940 10.943 0.563 10.944 10.942 10.951 10.934 0.998 0.977 0.972
 1 W 13.073 12.940 12.990 13.255 0.432 13.01 13.12 13.03 13.10 0.791 0.880 0.650
 2 W 15.680 15.591 15.514 15.680 0.432 15.64 15.60 15.60 15.64 0.930 0.930 0.771
0–1 wk (kg)
 ADG 0.302 0.288 0.293 0.331 0.040 0.295 0.312 0.298 0.310 0.675 0.765 0.524
 ADFI 0.551 0.551 0.550 0.554 0.002 0.551 0.552 0.551 0.553 0.549 0.294 0.255
 G:F 0.548 0.523 0.533 0.597 0.072 0.536 0.565 0.541 0.560 0.695 0.798 0.547
1–2 wk (kg)
 ADG 0.373 0.379 0.361 0.346 0.014 0.376 0.354 0.367 0.363 0.141 0.775 0.480
 ADFI 0.595 0.599 0.599 0.600 0.003 0.597 0.600 0.597 0.600 0.372 0.341 0.598
 G:F 0.627 0.633 0.603 0.577 0.023 0.630 0.590 0.615 0.605 0.107 0.695 0.495
0–2 wk (kg)
 ADG 0.337 0.333 0.327 0.338 0.019 0.335 0.333 0.332 0.336 0.894 0.840 0.697
 ADFI 0.573 0.575 0.574 0.577 0.002 0.574 0.576 0.574 0.576 0.314 0.237 0.853
 G:F 0.588 0.580 0.569 0.586 0.033 0.584 0.578 0.579 0.583 0.850 0.896 0.704

1) Basal, diet containing 18.78% CP; Low, diet containing 16.92% CP.

2) PT0, non-supplementation of protease; PT10, supplementation of 0.1% protease.

CP, crude protein; PT, protease; HP, high protein; LP, low crude protein; BW, body weight; ADG, average daily gain; ADFI, average daily feed intake; G:F, feed efficiency.

Download Excel Table
jast-67-3-549-g2
Fig. 2. Effect of supplemental protease on fecal score with different CP levels in weaned pig. Score 0, normal feces; 1, soft feces; 2, mild diarrhea; 3, severe diarrhea. PT0, non-supplementation of protease; PT10, supplementation of 0.1% protease. HP, high protein; LP, low crude protein; CP, crude protein.
Download Original Figure
Nutrients digestibility

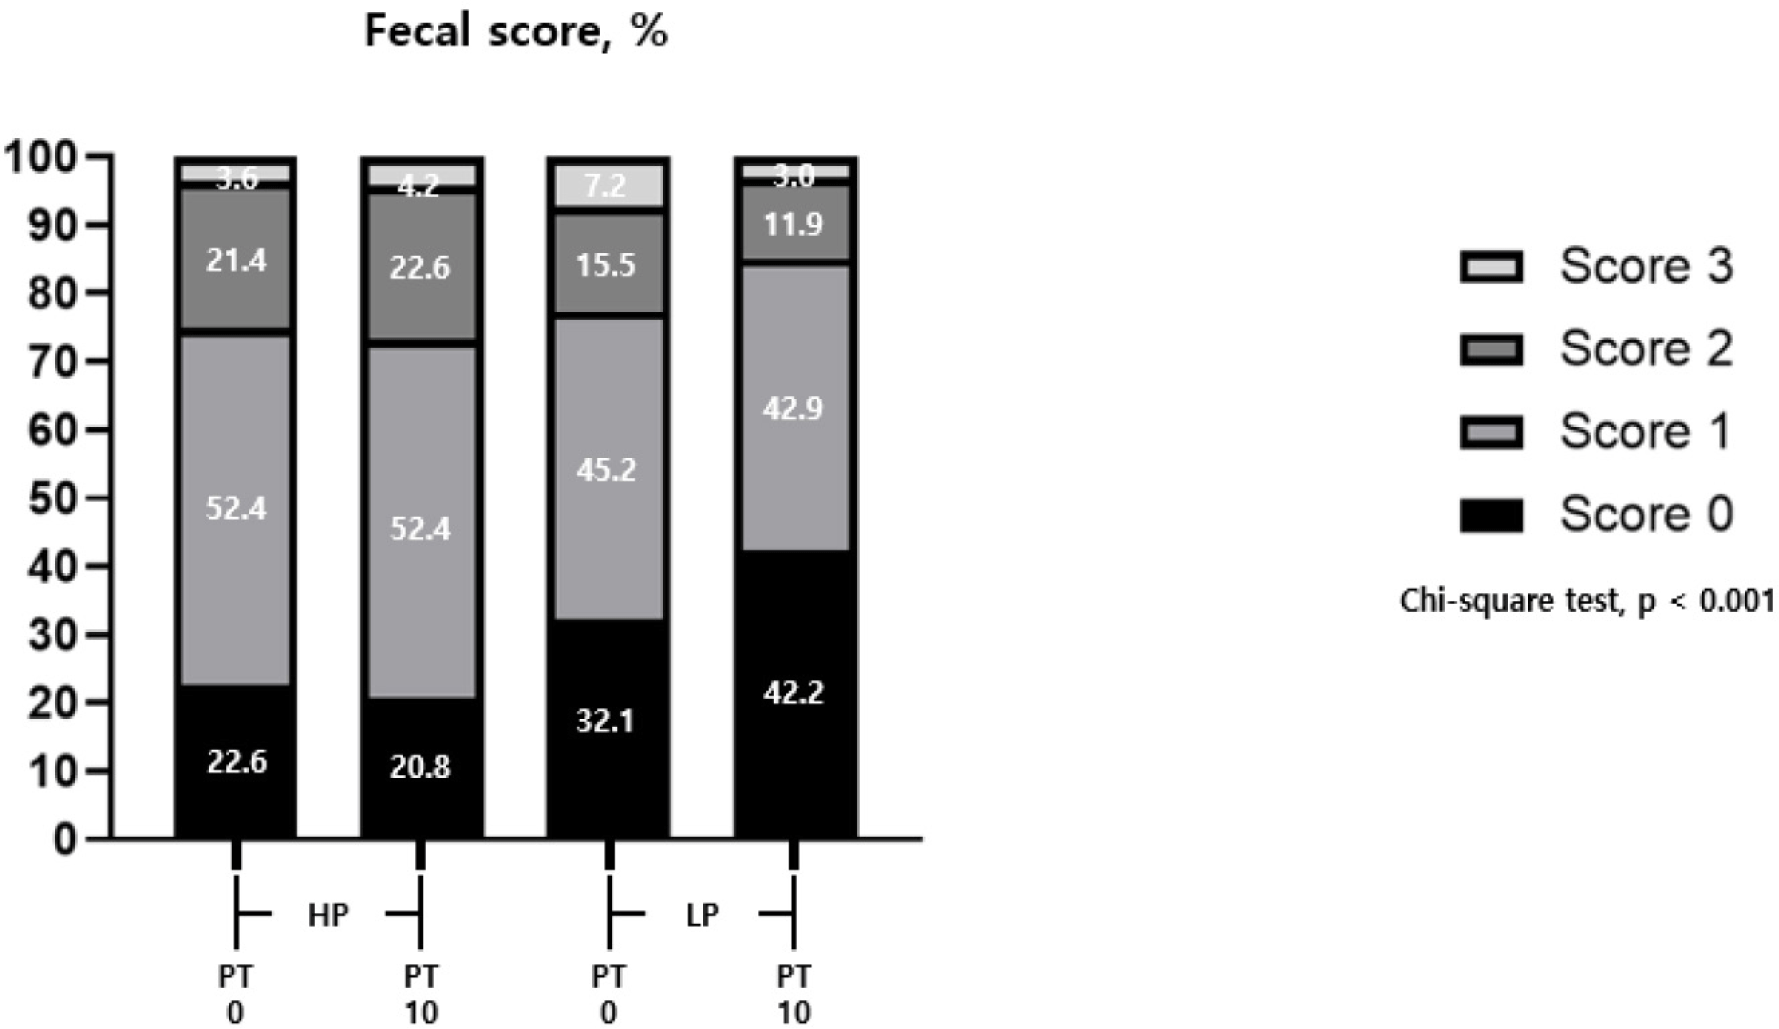
Table 3. shows the effect of supplemental PT on nutrient digestibility with different CP levels in weaned pig. The different CP levels and supplementation of PT showed no significant differences in ATTD in the first week. The high CP (HP) was significantly increased (p < 0.05) the ATTD of DM compared to the LP in the second week, and DM was a significant interaction (p < 0.01) between CP and PT. The PT10 increased (p < 0.05) ATTD of CP compared to the PT0 in the second week.

Table 3. Effect of supplemental protease on the ATTD of nutrients with different CP levels in weaned pig
Variables Basal1) Low SE CP PT2) p-value
0% 0.1% 0% 0.1% HP LP 0 10 CP PT CP × PT
1 wk (%)
 DM 78.98 80.22 80.80 82.09 0.82 79.60 81.45 79.89 81.16 0.036 0.138 0.976
 CP 77.96 78.43 77.90 77.15 1.00 78.20 77.53 77.93 77.79 0.510 0.886 0.549
 GE 81.18 81.34 82.30 81.20 0.82 81.26 81.75 81.74 81.27 0.561 0.571 0.455
2 wk (%)
 DM 81.07 80.32 81.13 82.27 0.26 80.70 81.70 81.10 81.30 0.001 0.473 0.002
 CP 76.57 78.41 77.06 78.79 0.37 77.49 77.93 76.82 78.60 0.246 < 0.001 0.884
 GE 82.17 82.19 81.98 82.95 0.42 82.18 82.47 82.08 82.57 0.501 0.251 0.267

1) Basal, diet containing 18.78% CP; Low, diet containing 16.92% CP.

2) PT0, non-supplementation of protease; PT10, supplementation of 0.1% protease.

ATTD, apparent total tract digestibility; CP, crude protein; PT, protease; HP, high protein; LP, low crude protein; DM, dry matter; GE, gross energy.

Download Excel Table

Table 4. show the effect of supplemental PT on amino acids digestibility with different CP levels at 7 days in weaned pig. In indispensable amino acids, the LP showed a significant increase (p < 0.05) in ATTD of methionine compared to the HP. In the ATTD of tryptophan, the HP was significantly increased (p < 0.05) compared to the LP. The different CP levels and supplementation of PT showed no significant differences in the ATTD of dispensable amino acids.

Table 4. Effect of supplemental protease on the ATTD of amino acids with different CP levels in weaned pig at 7 days
Variables Basal1) Low SE CP PT2) p-value
0% 0.1% 0% 0.1% HP LP 0 10 CP PT CP × PT
Indispensable amino acids (%)
 Threonine 74.94 74.89 76.04 73.92 1.58 74.92 74.98 75.49 74.41 0.967 0.511 0.530
 Valine 73.93 74.35 75.61 73.28 1.90 74.14 74.45 74.77 73.82 0.877 0.629 0.488
 Isoleucine 73.88 74.69 76.19 74.32 1.87 74.29 75.26 75.04 74.51 0.620 0.784 0.493
 Leucine 79.20 80.28 79.45 79.14 1.19 79.74 79.30 79.33 79.71 0.720 0.757 0.577
 Phenylalanine 79.83 80.75 79.72 79.79 1.25 80.29 79.76 79.78 80.27 0.683 0.701 0.743
 Histidine 88.26 88.88 85.37 88.16 1.52 88.57 86.77 86.82 88.52 0.269 0.293 0.495
 Lysine 78.37 78.40 77.82 76.60 1.74 78.39 77.21 78.10 77.50 0.520 0.741 0.728
 Arginine 90.00 90.60 86.38 89.63 1.71 90.30 88.01 88.19 90.12 0.217 0.294 0.460
 Methionine 75.24 74.18 82.33 83.09 1.73 74.71 82.71 78.79 78.64 0.002 0.934 0.616
 Tryptophan 81.15 82.77 77.38 77.18 1.63 81.96 77.28 79.27 79.98 0.021 0.067 0.594
 Total 79.64 80.20 79.67 79.48 1.24 79.92 79.58 79.66 79.84 0.787 0.886 0.771
Dispensable amino acids (%)
 Aspartic acid 79.60 79.64 79.13 78.34 1.25 79.62 78.74 79.37 78.99 0.498 0.772 0.750
 Serine 83.95 84.43 81.97 82.98 1.07 84.19 82.48 82.96 83.71 0.147 0.508 0.809
 Glutamic acid 84.50 85.14 82.75 84.02 1.16 84.82 83.39 83.63 84.58 0.248 0.432 0.792
 Proline 84.61 85.47 83.20 84.28 1.22 85.04 83.74 83.91 84.88 0.317 0.451 0.930
 Glycine 73.30 73.10 74.34 71.61 2.28 73.20 72.98 73.82 72.36 0.923 0.947 0.596
 Alanine 69.09 69.45 71.92 67.96 2.73 69.27 69.94 70.51 68.71 0.512 0.528 0.451
 Tyrosine 75.84 76.80 76.07 74.85 1.95 76.32 75.46 75.96 75.83 0.671 0.948 0.590
 Cysteine 83.87 84.20 82.18 81.82 1.16 84.04 82.00 83.03 83.01 0.117 0.992 0.775
 Total 80.71 81.15 80.02 79.84 1.16 80.93 79.93 80.37 80.50 0.410 0.912 0.797

1) Basal, diet containing 18.78% CP; Low, diet containing 16.92% CP.

2) PT0, non-supplementation of protease; PT10, supplementation of 0.1% protease.

ATTD, apparent total tract digestibility; CP, crude protein; PT, protease; HP, high protein; LP, low crude protein.

Download Excel Table

The PT10 increased (p < 0.05) ATTD of threonine, valine, isoleucine, leucine, phenylalanine, and total indispensable amino acids compared to the PT0 at days 14 (Table 5). The ATTD of histidine and arginine was increased (p < 0.05) in the PT10 compared to the PT0, and there was a significant interaction (p < 0.05) between CP and PT. The LP increased (p < 0.01) ATTD of methionine compared to the HP. Also, the ATTD of methionine showed a significant increase (p < 0.05) in the PT10 compared to the PT0. The ATTD of tryptophan had a significant interaction (p < 0.01) between CP and PT.

Table 5. Effect of supplemental protease on the ATTD of amino acids with different CP levels in weaned pig at 14 days
Variables Basal1) Low SE CP PT2) p-value
0% 0.1% 0% 0.1% HP LP 0 10 CP PT CP × PT
Indispensable amino acids (%)
 Threonine 74.16 76.72 75.75 76.63 0.44 75.44 76.19 74.96 76.68 0.125 0.004 0.093
 Valine 72.49 74.91 73.81 75.27 0.68 73.70 74.54 73.15 75.09 0.253 0.021 0.497
 Isoleucine 73.36 75.77 74.20 76.35 0.80 74.57 75.28 73.78 76.06 0.398 0.021 0.877
 Leucine 78.91 81.21 79.92 80.96 0.50 80.06 80.44 79.42 81.09 0.468 0.010 0.242
 Phenylalanine 79.50 81.87 80.91 81.50 0.53 80.69 81.21 80.21 81.69 0.356 0.023 0.131
 Histidine 88.77 90.88 89.97 90.27 0.29 89.83 90.12 89.37 90.58 0.327 0.003 0.014
 Lysine 76.24 78.39 78.34 79.14 0.87 77.32 78.74 77.29 78.77 0.139 0.127 0.458
 Arginine 89.90 92.45 91.53 91.30 0.26 91.18 91.42 90.72 91.88 0.376 0.002 < 0.001
 Methionine 76.77 79.85 81.66 85.18 1.11 78.31 83.42 79.22 82.52 0.002 0.017 0.846
 Tryptophan 79.46 84.19 86.23 79.20 0.75 81.83 82.72 82.85 81.70 0.268 0.162 < 0.001
 Total 78.96 81.44 80.67 81.52 0.53 80.20 81.10 79.82 81.48 0.133 0.014 0.165
Dispensable amino acids (%)
 Aspartic acid 78.54 80.12 79.61 80.77 0.50 79.33 80.19 79.08 80.45 0.125 0.026 0.692
 Serine 83.58 86.09 85.11 85.02 0.33 84.84 85.07 84.35 85.56 0.503 0.006 0.004
 Glutamic acid 83.71 85.68 84.91 85.73 0.40 84.70 85.32 84.31 85.71 0.158 0.008 0.191
 Proline 84.42 85.70 85.02 85.56 0.45 85.06 85.29 84.72 85.63 0.624 0.077 0.431
 Glycine 70.22 72.97 72.76 73.31 0.85 71.60 73.04 71.49 73.14 0.129 0.089 0.233
 Alanine 66.35 69.98 68.81 70.28 0.79 68.17 69.55 67.58 70.13 0.120 0.012 0.210
 Tyrosine 72.86 78.54 77.62 75.44 0.58 75.70 76.53 75.24 76.99 0.193 0.017 <.001
 Cysteine 83.01 85.35 84.72 84.79 0.65 84.18 84.76 83.87 85.07 0.403 0.102 0.120
 Total 79.55 81.79 81.06 81.73 0.47 80.67 81.40 80.31 81.76 0.157 0.014 0.131

1) Basal, diet containing 18.78% CP; Low, diet containing 16.92% CP.

2) PT0, non-supplementation of protease; PT10, supplementation of 0.1% protease.

ATTD, apparent total tract digestibility; CP, crude protein; PT, protease; HP, high protein; LP, low crude protein.

Download Excel Table

In the dispensable amino acids, the aspartic acid, glutamic acid, alanine, and total dispensable amino acids showed significant increases (p < 0.05) in the PT10 compared to the PT0. The ATTD of serine and tyrosine were increased (p < 0.05) in the PT10 compared to the PT0, and there was a significant interaction (p < 0.01) between CP and PT.

Blood profiles

The LP decreased (p < 0.01) BUN compared to HP (Table 6). Also, the PT10 decreased (p < 0.05) BUN compared to the PT0.

Table 6. Effect of supplemental protease on blood profiles with different CP levels in weaned pig
Variables Basal1) Low SE CP PT2) p-value
0% 0.1% 0% 0.1% HP LP 0 10 CP PT CP × PT
Total protein (g/dL) 5.47 5.40 4.97 5.37 0.24 5.44 5.17 5.22 5.39 0.285 0.500 0.348
BUN (mg/dL) 8.17 7.33 7.00 5.83 0.42 7.75 6.42 7.59 6.58 0.005 0.027 0.695
IgG (mg/dL) 370.0 389.3 368.7 307.3 50.61 379.7 338.0 369.3 348.3 0.420 0.683 0.435

1) Basal, diet containing 18.78% CP; Low, diet containing 16.92% CP.

2) ePT0, non-supplementation of protease; PT10, supplementation of 0.1% protease.

CP, crude protein; PT, protease; HP, high protein; LP, low crude protein; BUN, blood urea nitrogen; IgG, immunoglobulin G.

Download Excel Table
Odor emission

The PT10 decreased (p < 0.05) H2S compared to the PT0 (Table 7). Also, the LP significantly decreased (p < 0.01) H2S compared to the HP, and H2S was a significant interaction (p < 0.05) between CP and PT.

Table 7. Effect of supplemental protease on odor emission with different CP levels in weaned pig.
Variables Basal1) Low SE CP PT2) p-value
0% 0.1% 0% 0.1% HP LP 0 10 CP PT CP × PT
NH3 (ppm) 11.67 10.50 11.83 11.50 0.81 11.09 11.67 11.75 11.00 0.367 0.481 0.614
H2S (ppm) 7.33 3.00 1.67 1.83 0.83 5.17 1.75 4.50 2.42 0.001 0.021 0.014

1) Basal, diet containing 18.78% CP; Low, diet containing 16.92% CP.

2) PT0, non-supplementation of protease; PT10, supplementation of 0.1% protease.

CP, crude protein; PT, protease; PT, protease; HP, high protein; LP, low crude protein.

Download Excel Table
Bacteria count

The PT0 decreased (p < 0.05) E. coli population compared to the PT10 at 14 days (Table 8). Different CP levels and supplementation of PT showed no significant difference (p > 0.05) in the population of E. coli and Lactobacillus at 7 days.

Table 8. Effect of supplemental protease on bacteria count with different CP levels in weaned pig
Variables Basal1) Low SE CP PT2) p-value
0% 0.1% 0% 0.1% HP LP 0 10 CP PT CP × PT
1wk (g/CFU)
E. coli 5.72 5.78 5.52 5.43 0.35 5.75 5.48 5.62 5.60 0.442 0.956 0.838
Lactobacillus 8.87 8.64 8.77 8.79 0.21 8.76 8.78 8.82 8.72 0.927 0.630 0.559
2wk (g/CFU)
E. coli 6.11 6.61 6.18 6.50 0.16 6.36 6.34 6.15 6.56 0.906 0.023 0.594
Lactobacillus 9.45 9.87 9.63 9.61 0.29 9.66 9.62 9.54 9.74 0.885 0.489 0.456

1) Basal, diet containing 18.78% CP; Low, diet containing 16.92% CP.

2) PT0, non-supplementation of protease; PT10, supplementation of 0.1% protease.

Abbreviation: CP, crude protein; PT, protease; HP, high protein; LP, low crude protein; CFU, colony-forming unit; E. coli, Escherichia coli.

Download Excel Table
Nitrogen utilization

The HP had higher (p < 0.05) nitrogen intake than the LP at 7 days (Table 9). In the nitrogen concentration in feces ratio, the HP was significantly higher (p < 0.01) than the LP. Also, the PT10 significantly lowered (p < 0.01) nitrogen concentration in feces ratio compared to the PT. The HP showed significantly higher (p < 0.01) nitrogen retention than LP.

Table 9. Effect of supplemental protease on nitrogen utilization with different CP levels in weaned pig at 7 days
Variables Basal1) Low SE CP PT2) p-value
0% 0.1% 0% 0.1% HP LP 0 10 CP PT CP × PT
N intake (g/day) 18.29 18.32 16.38 16.71 0.14 18.31 16.55 17.34 17.52 < 0.001 0.209 0.291
Urine excretion (g/day) 368.7 372.4 366.8 367.7 4.25 370.5 367.3 367.7 370.1 0.451 0.589 0.745
N concentration in urine (%) 0.15 0.14 0.14 0.13 0.01 0.15 0.14 0.15 0.14 0.062 0.154 0.627
N excretion in urine (mL/day) 0.53 0.53 0.52 0.49 0.01 0.53 0.51 0.53 0.51 0.057 0.367 0.673
Feces excretion (g/day) 99.16 99.18 93.82 101.34 3.72 99.17 97.58 96.49 100.26 0.673 0.323 0.325
N concentration in feces (%) 4.06 3.98 3.84 3.77 0.01 4.02 3.81 3.95 3.88 < 0.001 <.001 0.904
N excretion in feces (g/day) 4.03 3.95 3.61 3.82 0.14 3.99 3.72 3.82 3.89 0.067 0.654 0.322
Total N excretion (g/day) 4.56 4.48 4.12 4.31 0.15 4.52 4.22 4.34 4.40 0.051 0.739 0.367
N retention (g/day) 13.73 13.84 12.26 12.41 0.26 13.79 12.34 13.00 13.13 < 0.001 0.624 0.944
N retention (% of N intake) 75.04 75.55 74.76 74.22 1.05 75.30 74.49 74.90 74.89 0.452 0.986 0.620

1) Basal, diet containing 18.78% CP; Low, diet containing 16.92% CP.

2) PT0, non-supplementation of protease; PT10, supplementation of 0.1% protease.

CP, crude protein; PT, protease; HP, high protein; LP, low crude protein; N, nitrogen.

Download Excel Table

The HP showed significantly higher (p < 0.01) nitrogen intake than the LP (Table 10). In feces excretion, the HP was significantly higher (p < 0.01) than the LP, and the feces excretion showed a significant interaction (p < 0.01) between CP and PT. The HP showed significantly higher (p < 0.01) nitrogen concentration ratio than the LP. Also, PT10 significantly lowered (p < 0.01) nitrogen concentration ratio compared to PT0, and nitrogen concentration ratio showed a significant interaction (p < 0.01) between CP and PT. Nitrogen excretion in feces, total nitrogen excretion and nitrogen retention were significantly higher (p < .001) in the HP compared to the LP. In addition, there were significantly lower (p < 0.01) in the PT10 compared to the PT0. In nitrogen retention ratio, the LP was significant increased (p < 0.05) compared to the HP. The PT10 was significant increased (p < 0.01) nitrogen retention ratio compared to the PT0.

Table 10. Effect of supplemental protease on nitrogen utilization with different CP levels in weaned pig at 14 days
Variables Basal1) Low SE CP PT2) p-value
0% 0.1% 0% 0.1% HP LP 0 10 CP PT CP × PT
N intake (g/day) 18.79 18.99 17.36 17.69 0.13 18.89 17.53 18.08 18.34 < 0.001 0.051 0.609
Urine excretion (g/day) 379.9 378.9 372.4 375.2 4.08 379.4 373.8 376.1 377.1 0.185 0.821 0.652
N concentration in urine (%) 0.18 0.16 0.16 0.16 0.01 0.17 0.16 0.17 0.16 0.195 0.075 0.296
N excretion in urine (g/day) 0.67 0.60 0.60 0.58 0.02 0.64 0.59 0.64 0.59 0.089 0.089 0.291
Feces excretion (g/day) 99.38 104.63 101.78 96.05 0.99 102.01 98.92 100.58 100.34 0.005 0.811 < 0.001
N concentration in feces (%) 4.43 3.92 3.91 3.91 0.04 4.18 3.91 4.17 3.92 < 0.001 < 0.001 < 0.001
N excretion in feces (g/day) 4.40 4.10 3.98 3.75 0.05 4.25 3.87 4.19 3.93 < 0.001 < 0.001 0.479
Total N excretion (g/day) 5.07 4.70 4.57 4.33 0.05 4.89 4.33 5.07 4.52 < 0.001 < 0.001 0.204
N retention (g/day) 13.73 14.29 12.79 13.36 0.14 14.01 13.08 13.26 13.83 < 0.001 < 0.001 0.089
N retention (% of N intake) 73.03 75.28 73.63 75.51 0.33 74.16 74.57 73.33 75.40 0.029 < 0.001 0.111

1) Basal, diet containing 18.78% CP; Low, diet containing 16.92% CP.

2) PT0, non-supplementation of protease; PT10, supplementation of 0.1% protease.

CP, crude protein; PT, protease; HP, high protein; LP, low crude protein; N, nitrogen.

Download Excel Table

DISCUSSION

Exogenous enzymes are commonly used to improve growth performance, nutrient utilization, and digestibility of animals [15,16]. In pigs, protein is essential for metabolism and physiology. Changes in protein levels can affect their growth [6]. In this study, we hypothesized that supplementing an LP diet with PT could improve the growth performances of weaned pigs. However, our findings showed that neither protein levels nor PT supplementation had a significant effect on growth performance.

Kim et al. [17] have reported that adding PT at different levels of CP in diets of growing pigs does not affect ADG, ADFI, or G:F. However, supplementing PT to an LP diet improved ADFI and ADG in another study [6]. This improvement might be because PTs could hydrolyze proteins, increasing their digestibility by breaking them down into free amino acids and peptides that can be absorbed in the small intestine [18]. Such differences in the results of various studies might be due to factors such as the type of experiment conducted (metabolic vs feeding), the composition of the diet, and the type of PT used.

Excessive proteins from feeding are not digested in the ileum, but digested in the hindgut [19]. Fermentation of proteins and amino acids by intestinal microflora is a major cause of diarrhea [2022]. Nyachoti and Jayaraman [23] have reported the need to eradicate PWD by reducing CP content in the diet of weaned pigs. The mechanism by which PTs metabolize proteins is by enhancing hydrolytic capacity in the small intestine [24]. In the present study, the PT diet reduced the incidence of diarrhea during the entire experimental period and an interaction tendency between the LP diet and PT was found, similar to results reported by Yu et al. [6]. The LP diet reduced influx of proteins into the intestine by reducing nitrogen intake. PT also increased CP digestibility. The reduction in the incidence of diarrhea might be due to two factors, LP and PT. In previous studies, an LP diet resulted in a lower incidence of diarrhea than an HP diet, leading to increased DM digestibility [19,25]. Additionally, Zuo et al. [11] have reported that supplementation with PTs can decrease diarrhea score due to improved intestinal development, digestive enzyme activity, and nutrient digestibility.

HP diets contain a lot of ANF. Trypsin inhibitors can reduce the digestibility of pigs [26]. LP diet should be fed as an alternative of the HP diet to increase piglets’ nutrient availability from ANF [6]. In the present study, the LP diet improved DM digestibility. However, many studies have suggested that feeding an LP diet can decrease nutrient digestibility in pigs [27,28]. Zhou et al. [29] have reported that an LP diet can reduce nutrient fermentation in the hindgut, thereby reducing nutrient digestibility. This seems to show various results according to CP levels due to the complex intestinal association of pigs with CP % reduction and amino acids supplementation. PTs are usually enzymes that aid in the digestion of proteins. They can also neutralize ANF and improve nutrient digestibility [11,30,31]. As shown in a previous study, the ATTD of CP can be improved in pigs supplemented with PT [11]. PT in basal diets and LP diets has been reported to have an advantage [32,33]. PTs can increase the ileal digestibility of amino acids in weaned pigs and hydrolyze proteins and convert proteins to free amino acids and peptides for good absorption in the small intestine, thereby increasing protein digestibility [18]. Through this action, it seemed that PT could improve the digestibility of many amino acids and total essential and non-essential amino acids in this study.

In blood profiles, BUN is known to be an index that can predict nitrogen excretion and nitrogen utilization efficiency in pigs [34]. It is also used as a method to fine-tune the diet or to identify problems with the nutrient compositions of the diet [35]. Figueroa et al. [36] have reported that when the CP level in a diet is decreased, the BUN is also decreased. In the present study, BUN was decreased after feeding the LP diet. PT improved the ATTD of CP, consistent with results of increased protein utilization. Nitrogen excretion is reduced due to low nitrogen intake from an LP diet. As a result, BUN is reduced by improving protein utilization. Reduction of CP in the diet and supplementation of PT show that it is an ideal diet for weaned pig.

As the livestock industry has become increasingly interested in the effects of environmental pollution around the world, the need to reduce pollutants generated from livestock production has increased. When nutrients in the diet exceed the required amount, they are not fully utilized as they are excreted [37]. H2S in particularly high concentrations in animal facilities is a lethal gas that can cause death to animals and humans [38,39]. In our experiments, we saw a decrease in H2S with LP diets and PT supplementation. Nguyen et al. [40] have reported that LP diet and LP supplementation with PT treatments can release less H2S than basal diet treatment. This is seen as a decrease in H2S due to the improvement of methionine and sulfur-containing amino acid digestibility.

Nitrogen utilization is used as an indicator of how efficiently pigs use proteins. In addition, there is a comparable model closely related to nitrogen utilization in this experiment, allowing accurate comparative analysis. Nitrogen excretion has a positive correlation with BUN. When BUN decreases, nitrogen excretion also decreases [34]. Whittemore et al. [41] have reported that nitrogen retention can be predicted by calculating it as (ADG × 0.16)–/ 6.25. The growth performance results showed an ADG value of 0.58 kg in CP and PT treatment groups during the entire experimental period. Comparing nitrogen retention and predicted values shown in Table 10, it could be seen that the HP group in the CP factor and the PT10 group in the PT factor came out similarly. Although HP contains high levels of CP in the diet itself, nitrogen retention seems to be high. The PT10 group showed a high value due to the improvement of nitrogen utilization caused by PT. Supplementation of PT in feed can improve nitrogen utilization by improving the ATTD of CP in weaned pigs. A decrease in BUN can prove the result of nitrogen metabolism.

CONCLUSION

There were no differences in growth performance with different CP levels and supplementation of PT in weaned pig. The LP diet showed a low fecal score and appeared to be effective in preventing diarrhea through interaction with PT. The DM also showed interaction with the LP diet and PT supplementation. Supplementation of PT improved protein and amino acids digestibility, and it can be seen that BUN was decreased. The digestibility of methionine, a sulfur-containing amino acid, was increased by supplementation with LP diet and PT, which resulted in a decrease in H2S. As a conclusion of this study, supplementation of PT to the LP diet successfully prevented PWD and improved nitrogen utilization with improved digestibility.

Competing interests

No potential conflict of interest relevant to this article was reported

Funding sources

This work was carried out with the support of protease from Solton Biochem Co., Ltd.

Acknowledgements

Not applicable.

Availability of data and material

Not applicable.

Authors’ contributions

Conceptualization: An J, Lee J, Song M, Kim H, Cho J.

Data curation: An J, Park S, Jeon K.

Formal analysis: Song D, Cho H.

Methodology: Oh H, Song D, Jeon K.

Software: Chang S, Cho H.

Validation: Oh H, Chang S.

Investigation: Lee J, Song M, Park S.

Writing - original draft: An J, Lee J, Song M.

Writing - review & editing: An J, Lee J, Song M, Oh H, Chang S, Song D, Cho H, Park S, Jeon K, Kim H, Cho J.

Ethics approval and consent to participate

The experimental protocol was approved (CBNUA-2008-22-01) by the Institutional Animal Care and Use Committee of Chungbuk National University, Cheongju, Korea.

REFERENCES

1.

Rhouma M, Fairbrother JM, Beaudry F, Letellier A. Post weaning diarrhea in pigs: risk factors and non-colistin-based control strategies. Acta Vet Scand. 2017; 59:31

2.

Kim K, He Y, Xiong X, Ehrlich A, Li X, Raybould H, et al. Dietary supplementation of Bacillus subtilis influenced intestinal health of weaned pigs experimentally infected with a pathogenic E. coli. J Anim Sci Biotechnol. 2019; 10:52

3.

Partanen KH, Mroz Z. Organic acids for performance enhancement in pig diets. Nutr Res Rev. 1999; 12:117-45

4.

Moeser AJ, Pohl CS, Rajput M. Weaning stress and gastrointestinal barrier development: implications for lifelong gut health in pigs. Anim Nutr. 2017; 3:313-21

5.

Gao J, Yin J, Xu K, Li T, Yin Y. What is the impact of diet on nutritional diarrhea associated with gut microbiota in weaning piglets: a system review. BioMed Res Int. 2019; 2019:6916189

6.

Yu J, Yu G, Yu B, Zhang Y, He J, Zheng P, et al. Dietary protease improves growth performance and nutrient digestibility in weaned piglets fed diets with different levels of soybean meal. Livest Sci. 2020; 241:104179

7.

Limbach JR, Espinosa CD, Perez-Calvo E, Stein HH. Effect of dietary crude protein level on growth performance, blood characteristics, and indicators of intestinal health in weanling pigs. J Anim Sci. 2021; 99:skab166

8.

Yu D, Zhu W, Hang S. Effects of long-term dietary protein restriction on intestinal morphology, digestive enzymes, gut hormones, and colonic microbiota in pigs. Animals. 2019; 9:180

9.

Shi Q, Zhu Y, Wang J, Yang H, Wang J, Zhu W. Protein restriction and succedent realimentation affecting ileal morphology, ileal microbial composition and metabolites in weaned piglets. Animal. 2019; 13:2463-72

10.

Glitsø V, Pontoppidan K, Knap I, Ward N. Development of a feed protease. Ind Biotechnol. 2012; 8:172-5

11.

Zuo J, Ling B, Long L, Li T, Lahaye L, Yang C, et al. Effect of dietary supplementation with protease on growth performance, nutrient digestibility, intestinal morphology, digestive enzymes and gene expression of weaned piglets. Anim Nutr. 2015; 1:276-82

12.

Pan L, Zhao PF, Yang ZY, Long SF, Wang HL, Tian QY, et al. Effects of coated compound proteases on apparent total tract digestibility of nutrients and apparent ileal digestibility of amino acids for pigs. Asian-Australas J Anim Sci. 2016; 29:1761-7

13.

NRC (National Research Council). Nutrient requirements of swine. 11th ed Washington, DC: National Academies Press. 2012

14.

AOAC (Association of Official Analytical Chemists). International. Official methods of analysis of AOAC International. 17th ed Arlington, VA: AOAC Internatioal. 2000

15.

Adeola O, Cowieson AJ. Board-invited review: opportunities and challenges in using exogenous enzymes to improve nonruminant animal production. J Anim Sci. 2011; 89:3189-218

16.

Kim YJ, Lee JH, Kim TH, Song MH, Yun W, Oh HJ, et al. Effect of low protein diets added with protease on growth performance, nutrient digestibility of weaned piglets and growing-finishing pigs. J Anim Sci Technol. 2021; 63:491-500

17.

Kim YJ, Kim TH, Song MH, An JS, Yun W, Lee JH, et al. Effects of different levels of crude protein and protease on nitrogen utilization, nutrient digestibility, and growth performance in growing pigs. J Anim Sci Technol. 2020; 62:659-67

18.

Shahir MH, Rahimi R, Taheri HR, Heidariniya A, Baradaran N, Asadi Kermani Z. Effect of protein source and protease addition on performance, blood metabolites and nutrient digestibility of turkeys fed on low-protein diets from 28 to 55 d post hatch. Br Poult Sci. 2016; 57:390-6

19.

Gilbert MS, Ijssennagger N, Kies AK, van Mil SWC. Protein fermentation in the gut; implications for intestinal dysfunction in humans, pigs, and poultry. Am J Physiol Gastrointest Liver Physiol. 2018; 315:G159-70

20.

Pluske JR, Pethick DW, Hopwood DE, Hampson DJ. Nutritional influences on some major enteric bacterial diseases of pig. Nutr Res Rev. 2002; 15:333-71

21.

Zhou L, Fang L, Sun Y, Su Y, Zhu W. Effects of the dietary protein level on the microbial composition and metabolomic profile in the hindgut of the pig. Anaerobe. 2016; 38:61-9

22.

Wang Y, Zhou J, Wang G, Cai S, Zeng X, Qiao S. Advances in low-protein diets for swine. J Anim Sci Biotechnol. 2018; 9:60

23.

Nyachoti M, Jayaraman B. Low crude protein diet and its effect on diarrhea.In In: 16th Midwest Swine Nutrition Conference Proceedings 2016; , Indianapolis, INp p. 17-22

24.

Olukosi OA, Beeson LA, Englyst K, Romero LF. Effects of exogenous proteases without or with carbohydrases on nutrient digestibility and disappearance of non-starch polysaccharides in broiler chickens. Poult Sci. 2015; 94:2662-9

25.

Heo JM, Kim JC, Hansen CF, Mullan BP, Hampson DJ, Pluske JR. Effects of feeding low protein diets to piglets on plasma urea nitrogen, faecal ammonia nitrogen, the incidence of diarrhoea and performance after weaning. Arch Anim Nutr. 2008; 62:343-58

26.

Min BJ, Cho JH, Chen YJ, Kim HJ, Yoo JS, Wang Q, et al. Effects of replacing soy protein concentrate with fermented soy protein in starter diet on growth performance and ileal amino acid digestibility in weaned pigs. Asian-Australas J Anim Sci. 2009; 22:99-106

27.

Wang YM, Yu HT, Zhou JY, Zeng XF, Wang G, Cai S, et al. Effects of feeding growing-finishing pigs with low crude protein diets on growth performance, carcass characteristics, meat quality and nutrient digestibility in different areas of China. Anim Feed Sci Technol. 2019; 256:114256

28.

Li Z, Li Y, Lv Z, Liu H, Zhao J, Noblet J, et al. Net energy of corn, soybean meal and rapeseed meal in growing pigs. J Anim Sci Biotechnol. 2017; 8:44

29.

Zhou J, Wang Y, Wang L, Tu J, Yang L, Yang G, et al. Compromised hindgut microbial digestion, rather than chemical digestion in the foregut, leads to decreased nutrient digestibility in pigs fed low-protein diets. Nutrients. 2022; 14:2793

30.

Hedemann MS, Jensen BB. Variations in enzyme activity in stomach and pancreatic tissue and digesta in piglets around weaning. Arch Anim Nutr. 2004; 58:47-59

31.

Cowieson AJ, Roos FF. Toward optimal value creation through the application of exogenous mono-component protease in the diets of non-ruminants. Anim Feed Sci Technol. 2016; 221:331-40

32.

Angel CR, Saylor W, Vieira SL, Ward N. Effects of a monocomponent protease on performance and protein utilization in 7- to 22-day-old broiler chickens. Poult Sci. 2011; 90:2281-6

33.

Mc Alpine PO, O’Shea CJ, Varley PF, O’Doherty JV. The effect of protease and xylanase enzymes on growth performance and nutrient digestibility in finisher pigs. J Anim Sci. 2012; 90:375-7

34.

Kohn RA, Dinneen MM, Russek-Cohen E. Using blood urea nitrogen to predict nitrogen excretion and efficiency of nitrogen utilization in cattle, sheep, goats, horses, pigs, and rats. J Anim Sci. 2005; 83:879-89

35.

Whang KY, Kim SW, Donovan SM, McKeith FK, Easter RA. Effects of protein deprivation on subsequent growth performance, gain of body components, and protein requirements in growing pigs. J Anim Sci. 2003; 81:705-16

36.

Figueroa JL, Lewis AJ, Miller PS, Fischer RL, Gómez RS, Diedrichsen RM. Nitrogen metabolism and growth performance of gilts fed standard corn-soybean meal diets or low-crude protein, amino acid-supplemented diets. J Anim Sci. 2002; 80:2911-9

37.

Torrallardona D. Reduction of nitrogen excretion in pigs. Improvement of precision in nutrient requirements.In In: Brufau J, Tacon A, editors.editors Feed manufacturing in the Mediterranean region: recent advances in research and technology. Zaragoza: CIHEAM. 1999; p p. 265-74

38.

Oesterhelweg L, Püschel K. “Death may come on like a stroke of lightening...”: Phenomenological and morphological aspects of fatalities caused by manure gas. Int J Legal Med. 2008; 122:101-7

39.

Riedel SM, Field WE. Summation of the frequency, severity, and primary causative factors associated with injuries and fatalities involving confined spaces in agriculture. J Agric Saf Health. 2013; 19:83-100

40.

Nguyen DH, Lee SI, Cheong JY, Kim IH. Influence of low-protein diets and protease and bromelain supplementation on growth performance, nutrient digestibility, blood urine nitrogen, creatinine, and faecal noxious gas in growing–finishing pigs. Can J Anim Sci. 2018; 98:488-97

41.

Whittemore CT, Hazzledine MJ, Close WH. Nutrient requirement standards for pigs. Anim Sci. 2003; 77:b1-2