INTRODUCTION
The new growth strategy planned by the European Green Deal proposes a new big challenge: the absence of net emissions of greenhouse gases (GHG) in order to achieve the climate neutrality through a modern, resource-efficient and competitive economy by 2050 [1].
Emissions of ammonia (NH3) and GHG from livestock sector are a relevant environmental concern due to the global warming and the negative effects on ecosystems as eutrophication and particulate matter formation [2–4]. Methane (CH4), carbon dioxide (CO2), nitrous oxide (N2O) and hydrogen sulfide (H2S) represent the main GHG produced during the enteric fermentation and manure management. The excessive concentrations of these gases represent a severe threat for the environment and for both humans’ and animals’ health [5,6]. The first step to reduce the release of gases in the atmosphere is the accurate measurement of the gases produced in the breeding environment [7]. In Europe, dairy cows are mainly housed in naturally-ventilated barns with openings in the walls. Many countries in Europe have defined legal requirements to limit the emission of NH3 and GHGs [8], but in the Mediterranean area further efforts should be done to improve norms to control emissions. Currently, the main emission inventories (for example, the Italian Greenhouse Gas Inventory 1990–2021) are based on emission factors estimated in a northern European context, where the climatic conditions and related barn facility and barn management are different compared to the Mediterranean area [9]. Studies from the literature shows that many influencing factors affect gas concentrations and emission estimation: design of the housing systems (i.e., tied stall vs free stall) [10], ventilation system (i.e., mechanically ventilated, naturally ventilated, hybrid ventilated) [11–13], floor type [14,15], feeding [16], climatic conditions (i.e., temperature, relative humidity, wind direction and velocity [17,18], animal activity and behaviour [19]. A recent study carried out by D’Urso et al. [9] described the effect of climatic conditions, animal behaviour and barn management on gas concentrations and emissions in an open dairy barn in Mediterranean context during warm periods. In the analysed case study, the barn showed an integration between the natural-ventilation system, due to the open structure, and the cooling systems with fans and sprinklers. However, no specific procedures about measurement methods and sampling strategies are available for this specific typology of open barn structure, which is typical of Mediterranean areas.
Based on the literature, many technologies are available for measuring gas concentrations [20,21]. In scientific research, expensive instruments are generally used for monitoring gas concentrations, such as Fourier-transform infrared (FTIR) spectrometers and infrared-photoacoustic analysers (INNOVA) [22]. In some studies [23–25] different sampling lines were installed in naturally ventilated barns. For each measurement, the instrument provided the mean value of the gas concentration along a specific sampling line (i.e., in a high spatial resolution over a long distance). In other studies [26,27], the sampling was based on single measuring points located at different vertical and horizontal locations in the barn. The use of instruments with multipoint measurements, such as INNOVA, has the advantage to acquire data describing the gas distribution of gas concentrations in the barn. In detail, it is possible to identify areas in the barn with high variability of the gas. In the literature, the INNOVA analyser was applied mainly for scientific purposes to assess the performance of different measurement instruments [28–31] and to estimate emissions in the barn [15,18,25,32–34]. In these research works on emission estimation, there is not a unique method applied to acquire data (i.e., number of sampling points, sampling frequency, number of repetitions for each measurement). Few works have been devoted to investigating data collection and parameters set-up of INNOVA for gas concentrations. Among those studies, Gunnar Brehme [35] provided hints about experiment design (e.g., sampling point repetitions, tube length, heating, filter, reliability, and device starting) based on an analysis carried out in a duck farm. In the study of Hassouna et al. [33], the detection of interference bias and the reduction of uncertainty was assessed during the measurement of gas concentrations. Rom and Zhang [36] proposed some suggestions on the measurement set up of INNOVA in laboratory conditions. However, instructions on how to measure with INNOVA in barn typologies characterized by wide openings are not available. Moreover, another relevant issue is the high-cost of the instrument and its maintenance. Since INNOVA is as precise as expensive and difficult to manage, low-cost instruments are useful tools to monitor trend of gas concentrations. In detail, the study of Wang et al. [31] carried out in a naturally ventilated barn evaluated the Ogawa passive sampler and a passive flux sampler to monitor NH3 concentrations and, thus, estimating emissions. In the study of Arcidiacono et al. [37], NH3 concentrations were measured in two semi-open naturally ventilated dairy houses by using a portable measurement device (Dräger X-AM 5000). It was found that the NH3 concentrations decreased at increasing of the height from the barn floor.
Based on the current knowledge, it is challenging to identify the most suitable method to acquire data in dependence on the characteristics of the investigated barn and the measurement objectives.
Therefore, this research study aimed at identifying useful information, provided hints, and contributed to the definition of guidelines in order to carry out gas concentrations measurements. In detail, this study focuses on the acquisition and monitoring of gas concentrations in the barn environment by using of two different instruments (i.e., INNOVA analyzer, and Digitron instruments) in an open barn located in a Mediterranean area. The objectives of the investigation included the parameters setting, number of repetitions for each measurement, position of the sampling points as well as assessing the use of low-cost devices as an alternative device for gas concentration monitoring.
MATERIALS AND METHODS
The barn is located in Pettineo/Pozzilli district (37°01′ N, 14°32′ E) in the province of Ragusa (Sicily, Italy), at an altitude of 234 m a.s.l., in Mediterranean climate.
The barn envelope was characterized by three completely open sides. The SouthWest side had a continuous wall with small openings. The dairy house was about 55.50 m long and 20.80 m wide. The roof is symmetric with a central ridge vent oriented in the N-S direction. The absence of three perimeter walls and the opened roof promotes natural ventilation in the indoor environment.
The barn had a solid floor with 64 head-to-head cubicles. The plan distribution was composed of three pens for lactating cows. Each pen had a resting area, a feeding area, and service alleys (Fig. 1).
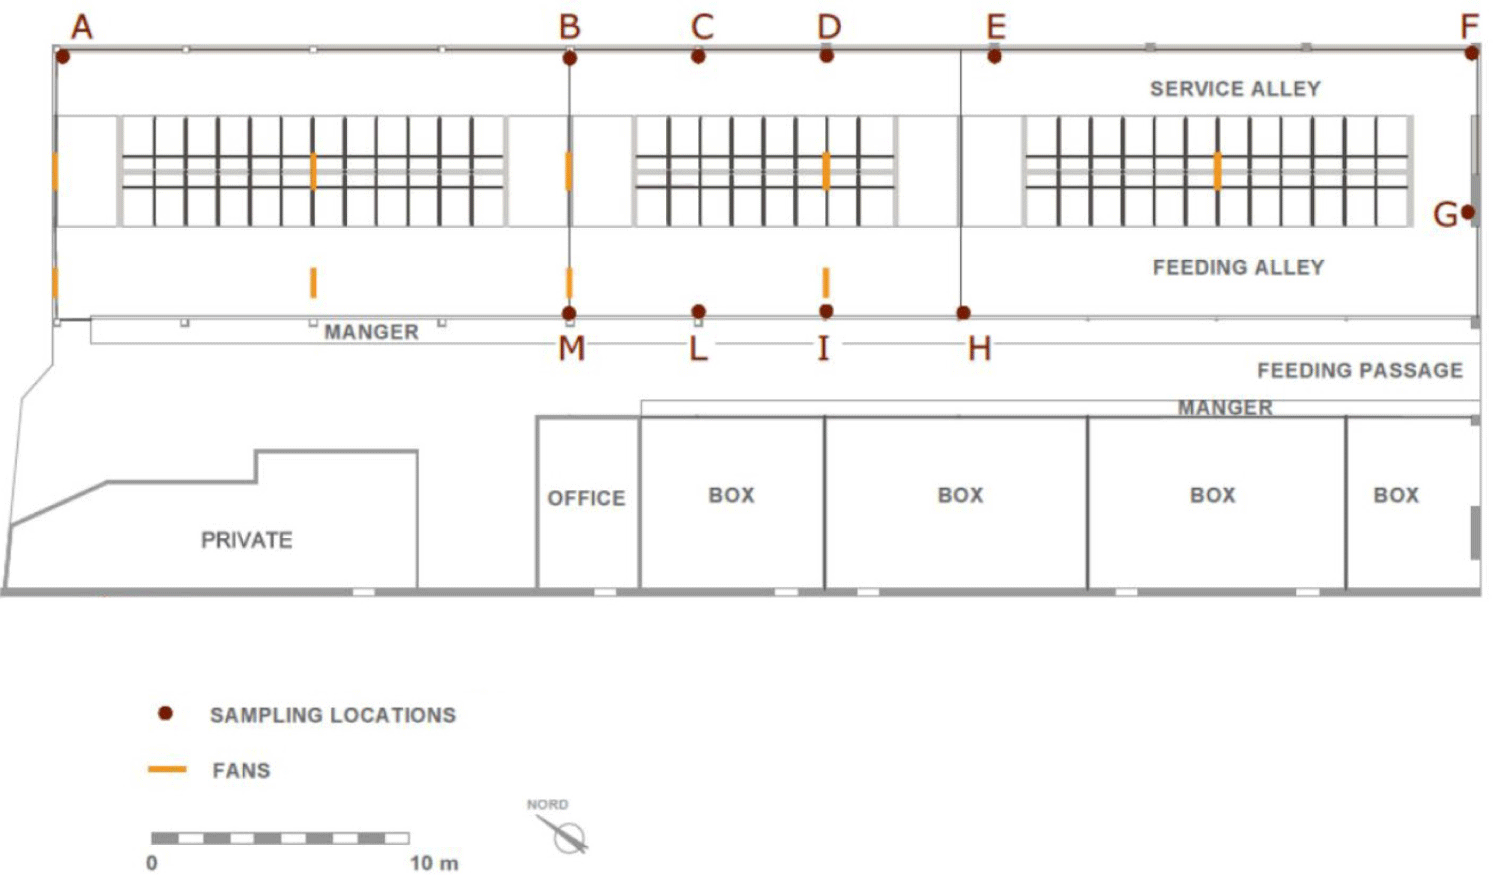
Since heat stress can be severe for cows during warm periods, ventilation was provided by two cooling systems (i.e., fans and sprinklers in both feeding and resting areas) (Figs. 1 and 2).
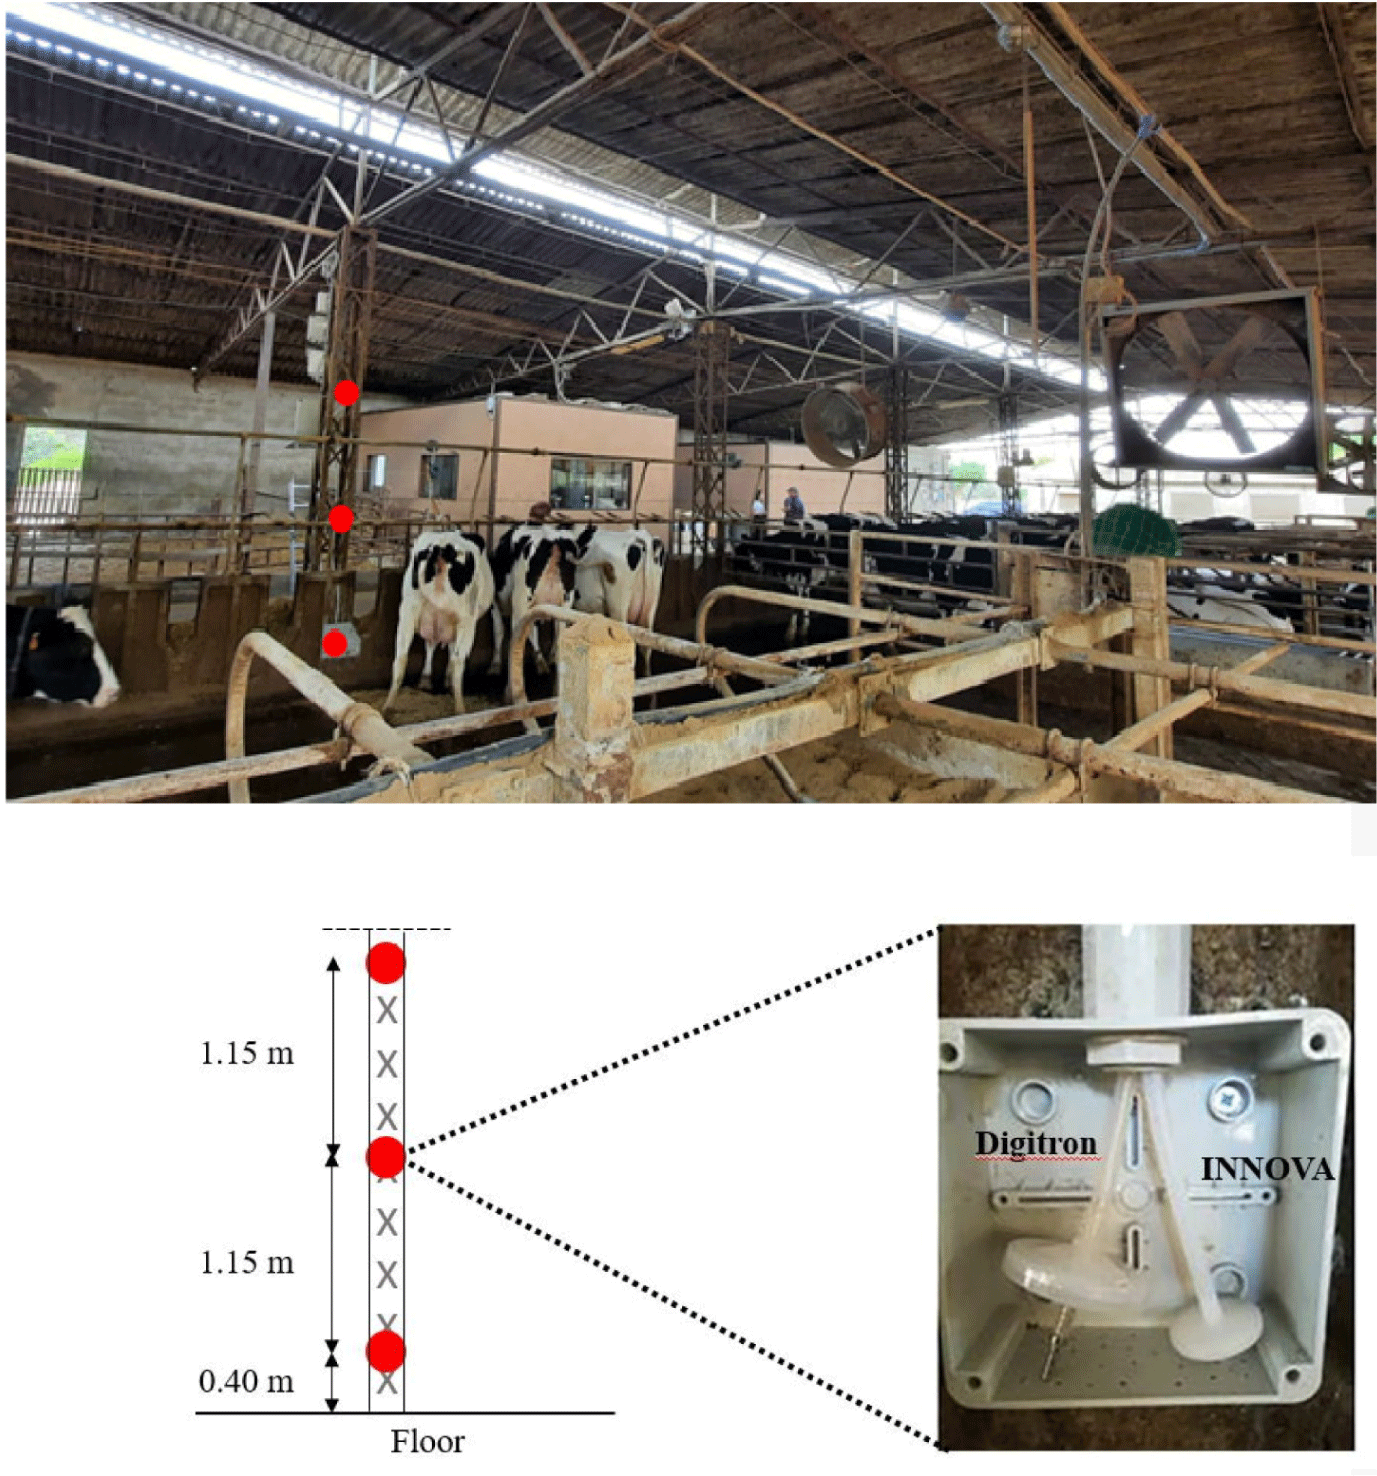
The research study was focused on the monitoring of gas concentrations of NH3, CO2 and CH4 in an open-sided free-stall dairy barn during warm periods.
Two different instruments were installed in the barn to continuously acquire data of gas concentrations at different sampling locations (SLs). The first instrument was an infrared photoacoustic spectroscope, widely used for scientific purposes (INNOVA, Lumasense Technology A/S, Ballerup, Denmark). The second one is a low-cost portable instrument (SKY2000-M2, Digitron Italia, Ferentino, Italy) that is tested as an alternative to the INNOVA analyser ‘for NH3 and CO2 concentrations. Both instruments were calibrated before each experiment.
INNOVA photo-acoustic analyzer consists of a Multigas Monitor mod 1412 i and a multipoint sampler 1409/12. This device continuously measures concentrations of NH3, CH4, and CO2 at eleven SLs in the barn. The INNOVA is not able to perform the measurement simultaneously in all the SLs, but it measures gas concentrations in a specific SL. For each measurement in a SL, the INNOVA measures concentrations of NH3, CH4, and CO2 simultaneously, and then goes to the next SLs. For each SLs, the gas is sampled and goes through the sampling tubes in the multipoint. In the next step, the sample is moved in the monitor’s chamber to be analyzed and the instrument measures simultaneously the gas concentrations of NH3, CH4, and CO2. Then the INNOVA performs the measurements in all the eleven SLs according to a specific sequence, and the cycle of measurements is repeated. The sampler system was made of AI-SI-316 stainless steel and poly-tetrafluoroethylene (PTFE) tubes with air filtration systems installed at each sampling site to maintain the sample’s particle-free condition. Each filter, made of hydrophobic PTFE, was installed at the end of each sampling tube. Based on the information declared by the manufacturer, the detection limits are 0.2 ppm, 0.4 ppm and 1.5 ppm for NH3, CH4, and CO2, respectively. In this study, three different experiments were conducted by using the INNOVA at SLs horizontally distributed in 11 points in the barn, at 0.40 m from the floor (Fig. 1).
A fourth experiment consisted in the comparison between low-cost portable instruments and the INNOVA as reference system. The three portable instruments were used to acquire concentrations of NH3 and CO2. The choice of this device was based on the trade-off between cost and instrument declared accuracy and some specific features such as the availability of simultaneous measurements of gas concentrations, the user-friendly features more suitable for the farmer, and the availability of data storage.
The sampling system of the low-cost instrument had an internal sampling pump that draws air through a sampler tube utilising an air filter at the inlet to keep the sample clean from particles. Every filter was positioned at the end of the sampling tube made of hydrophobic PTFE material. At sampling the gas goes through the sampler PTFE tube and, then, the device analyses gas by a chemical sensor for NH3 (i.e., a resolution of 0.01 ppm, range of 0-100 ppm and a precision of 2%full scale [FS]) and an infrared sensor for CO2 (i.e., resolution of 1 ppm, range of 0–4,000 ppm and a precision of 2%FS). Gas sampling was synchronised for all the three devices to obtain measurements at the same time and different heights in the barn. The SLs were located at three vertical levels shown in Fig. 2: near the floor, at the manger bar and at the fans’ height. In this fourth experiment, the position of INNOVA was modified in order to locate three SLs of INNOVA in the same place of the three low-cost portable devices (Fig. 2).
The research work included the execution of different experiments with specific sampling methods and set-up to record gas concentrations. The experimental period was chosen to coincide with warm climatic conditions from 2016 to 2021, as this barn typology exhibits a distinct gas concentration pattern attributed to its open building design [9]. Based on data acquired, data were processed and organized in different datasets to assess data variability.
Then, several statistical analyses were applied (i.e., one-way analysis of variance [ANOVA], two-way ANOVA, linear regression, and correlation analyses) by using Microsoft® Excel and Minitab®.
In detail, in a first experiment NH3, CO2 and CH4 concentrations, acquired in two different periods during the months of May and June 2016, were compared by applying two different set-ups of the INNOVA analyser. The main parameter modified during the two periods was the sample integration time (SIT). The SIT is related to speed and accuracy of the measurement and influences acquisition time for each sample. During the two periods a SIT of 5 seconds (SIT5) and 20 seconds (SIT20) were applied, respectively. Specifically, each repetitions required 1 minute and 15 seconds in a SL for the SIT5, about 4 minutes for three repetitions, and less than an hour to complete a measurement cycle (1.25 minutes × 3 repetitions × 11 SLs). On the other hand, the SIT20 required approximately 2 minutes and 30 seconds for each repetition, about 7 minutes and 30 seconds for each SL, and about an hour and half for a full measurement cycle (2.50 minutes × 3 repetitions × 11 SLs). The variability of gas concentration has been expressed in percentage as the ratio between the standard deviation and the mean value of the three repetitions in the SL considered. Then, the variability of gas concentration was statistically assessed (i.e., application of the one-way ANOVA) for SIT5 and SIT20.
In a second experiment, data related to NH3 concentrations acquired during the month of June 2018 by the INNOVA analyzer were assessed with regard to repetitions. Ten repetitions for each SL (i.e., situated along the manger in the central area of the barn) were executed before switching to the next SL and each repetition required about 1 minute 15 seconds. In detail, the INNOVA was set with a SIT5 and took about 12 minutes to perform ten repetitions in each SL and less than one hour to measure gas in all SLs at the center of the barn. The variability of the gas concentration acquired in a specific repetition was determined by considering different NH3 concentrations as benchmark, mainly collected from the literature. In detail, the benchmark was set as each repetition of the ten and the average between the second and the third ones. Then, statistical differences were identified between the repetitions performed and each benchmark considered by using the one-way ANOVA and Tuckey-post hoc test.
In a third experiment, NH3, CO2 and CH4 concentrations were acquired during the month of May 2019 at different locations horizontally distributed in the barn. The INNOVA was set up at SIT5 and with three repetitions for each SL. Based on data acquired, the following data processing was carried out. In a first analysis, the variability related to the sampling position was statistically assessed for central SLs (i.e., SL-H, SL-I, SL-L, SL-M), perimeter SLs (i.e., SL-B, SL-C, SL-D, SL-E), and corner SLs (i.e., SL-A, SL-F, SL-G). The variability was calculated by using the equation for standard deviation computation applied to the three repetitions for SL and, then, it was expressed in percentage by performing normalisation of the standard deviation value by the mean value of gas concentration. In a second analysis, the gas concentration for central SLs and perimeter SLs were determined by using gas concentrations measured at different SLs in space (i.e., one, two, or three SLs). The variability of gas concentrations was determined by computing the difference between the benchmark (i.e., mean value of gas acquired at four SLs) and the gas concentration value (i.e., determined considering one, two or three SLs), and then considering the ratio between this difference and the benchmark. Then, two-way ANOVA was applied to evaluate the influence of the position of SLs (i.e., central SLs or perimeter SLs), the number of the SLs (i.e., one, two, or three SLs) and the interaction between the position of SLs and the number of the SLs. In a third analysis, the variability of gas concentrations acquired at two SLs having a 5-meter distance among them were compared for all the combinations of SLs by the one-way ANOVA.
The fourth experiment was based on the comparison between NH3 and CO2 acquired by the low-cost portable devices and the INNOVA (i.e., reference methods). Gas concentrations were measured during the month of June 2021 at the SLs of the sampling pole located at the center of the barn in the SLs showed in Fig. 2. INNOVA performed three repetitions for each measurement in each SL with a SIT5. The reference value of gas concentrations was determined by the mean value of the second and the third repetitions. The measurement error of the low-cost portable device was carried out by computing the difference between the reference value of gas concentrations acquired by the INNOVA analyser and the gas concentration value measured by the low-cost devices, and then by considering the ratio between this difference and the reference value of gas concentrations acquired by the INNOVA analyser. Statistical analyses (i.e., one-way ANOVA, two-way ANOVA, and correlation analysis) were carried out to provide suggestions for the use of the low-cost portable devices.
RESULTS
Table 1 shows the results related to the measurement techniques to acquire data by INNOVA analyzer. In detail, the results related to the set-up of the SIT proved that there were no significant differences (p > 0.05) between the variability of gas concentrations (i.e., NH3, CH4 and CO2) acquired with SIT5 and SIT20. In detail, the error related to NH3, CH4 and CO2 is about 8%, 18% and 4%, respectively. The use of SIT5 was found to be more suitable for the measurement of gas concentrations because this setting allowed completing a measurement cycle in less time than by SIT20. In detail, the SIT5 required about 1 minute 15 seconds for each measurement whereas the SIT20 required about 2 minutes and 30 seconds.
The second experiment showed that when the NH3 concentrations were measured by the INNOVA analyzer, the number of repetitions performed for each SL had a significant influence (p < 0.05) on data collection. In detail, when the benchmark was the first and the tenth repetitions, data showed the highest variability whereas the lowest was for the second and third repetitions.
The analysis carried out on the trend of the gas during a day (Fig. 3) for each repetition highlighted that data is influenced by changing conditions over time. The values of the gas are different from the first repetition to the tenth repetition. In fact, the graph shows that NH3 concentrations at 8:00 in the morning increased from about 12.5 ppm recorded in the first repetition to about 14.5 ppm recorded in the tenth measurement. Data had similar pattern also in other peaks recorded during the day that are related to data variability. Therefore, Fig. 3 showed that gas concentrations were modified in about 12 minutes from the first to the tenth repetition.
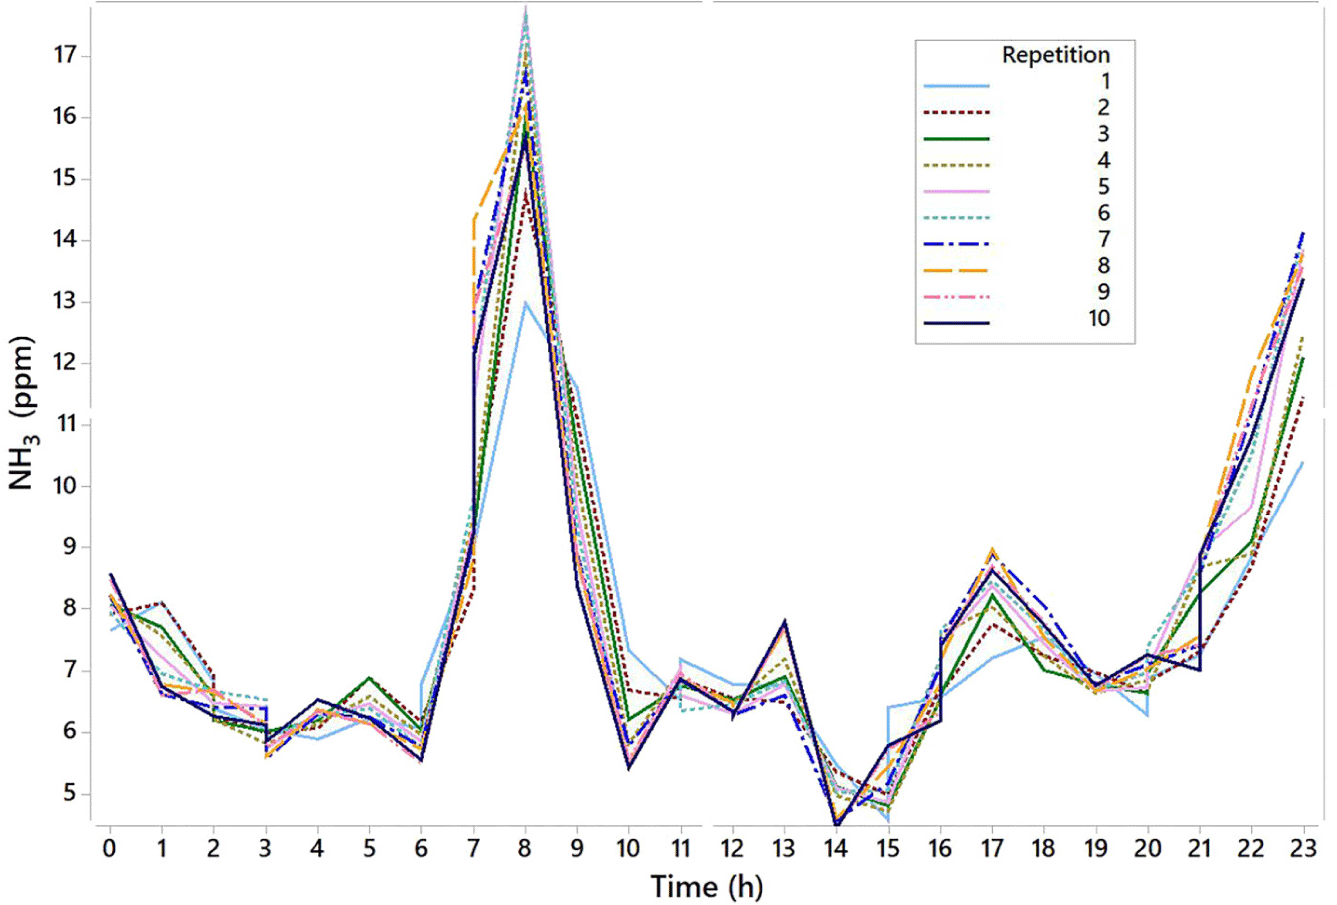
Based on these results, the value of the gas concentration in a SL can be determined by performing three repetitions. The first repetition should be removed from the dataset in order to reduce measurement variability; and, finally, the NH3 concentration in a SL should be computed as the mean value of the second and third repetitions. When this latter value is considered as the benchmark, the R2(adj) is equals to 90%. On the contrary, when the benchmark was the first or the tenth repetition, the R2(adj) was equals to 82% and 87%, respectively. From the fourth repetitions data variability increases due to the time required by the instrument to perform all the measurements as well as the different modification of the gas concentration in the barn. For this reason, it is recommended to avoid a high number of repetitions and to keep within five minutes acquisition.
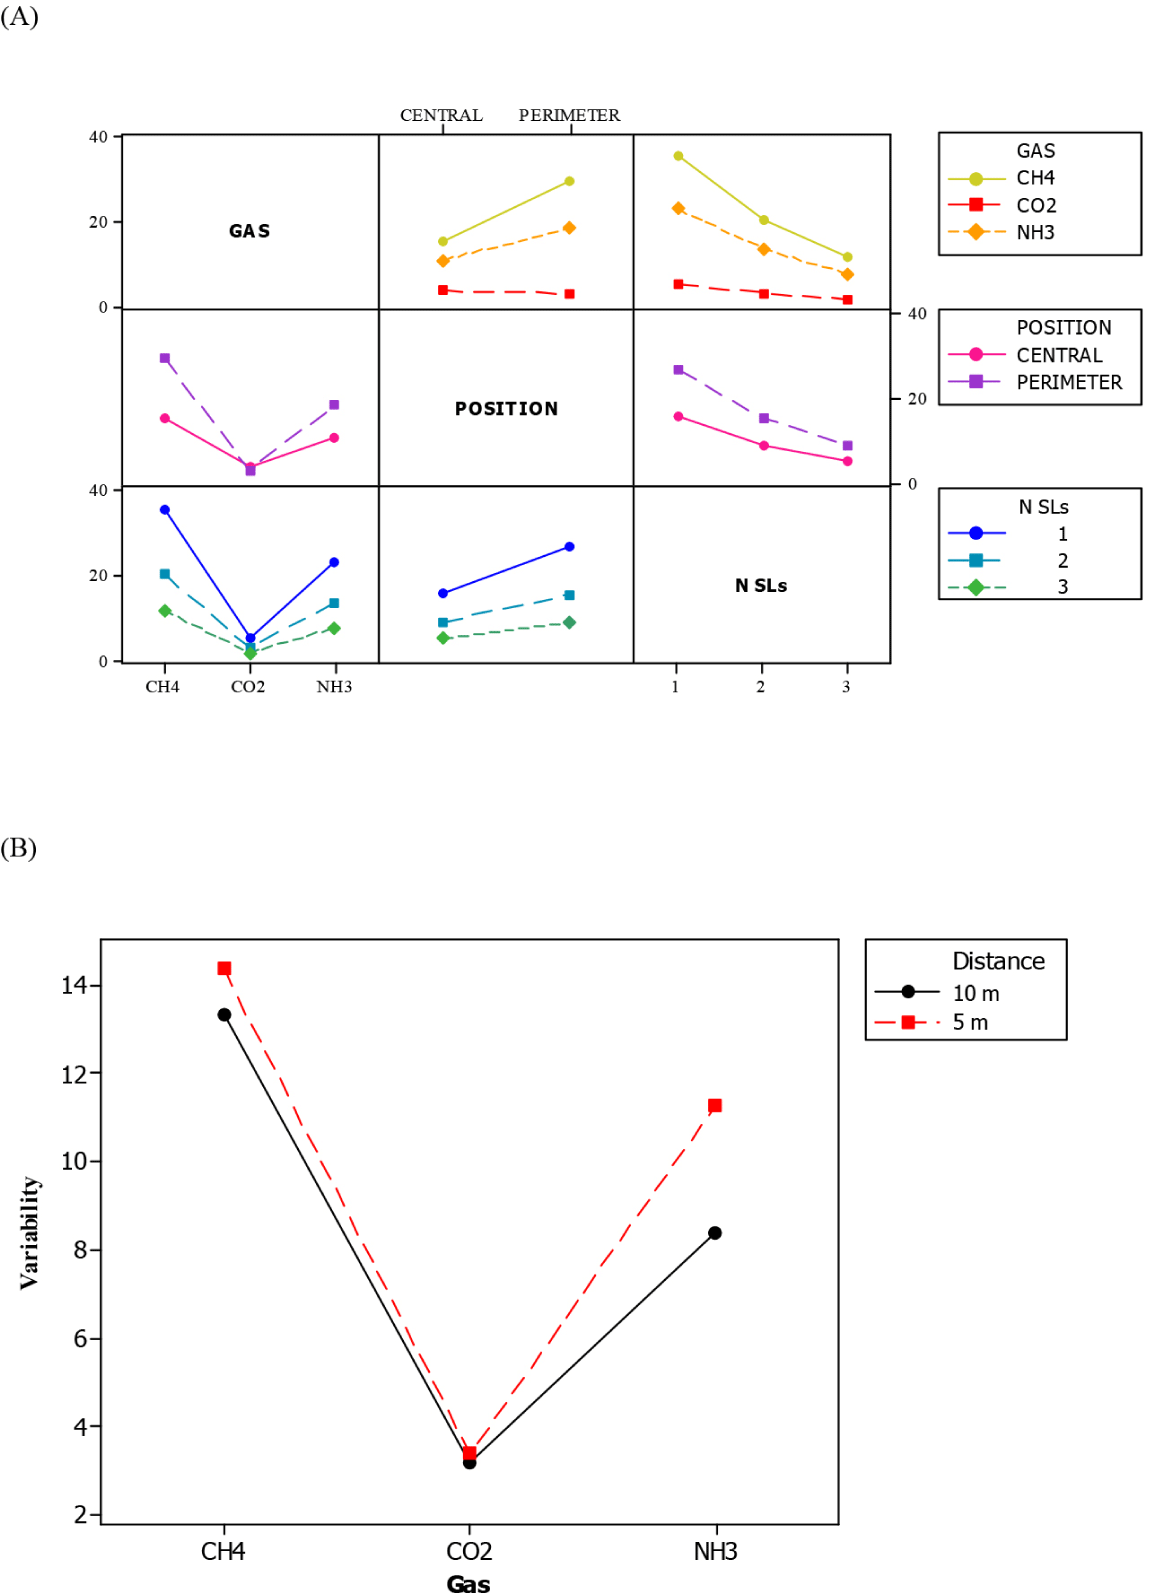
Based on the results of the two-way ANOVA, the position of SLs, the number of the SLs, and the interaction between the position of SLs and the number of the SLs had p lower than 0.001. The outcomes related to the third experiment showed that the position of SLs and the number of the SLs affect the variability of the gas distribution when the mean value of the gas concentration is computed (Fig 4A). The variability is reduced under the 10% in central zone and 16% in the perimeter one when three SLs samples are located. Moreover, a 10 meters distance between two SLs reduced significantly (p < 0.05) NH3 variability more than when SLs have a distance of 5 m (Fig. 4B).
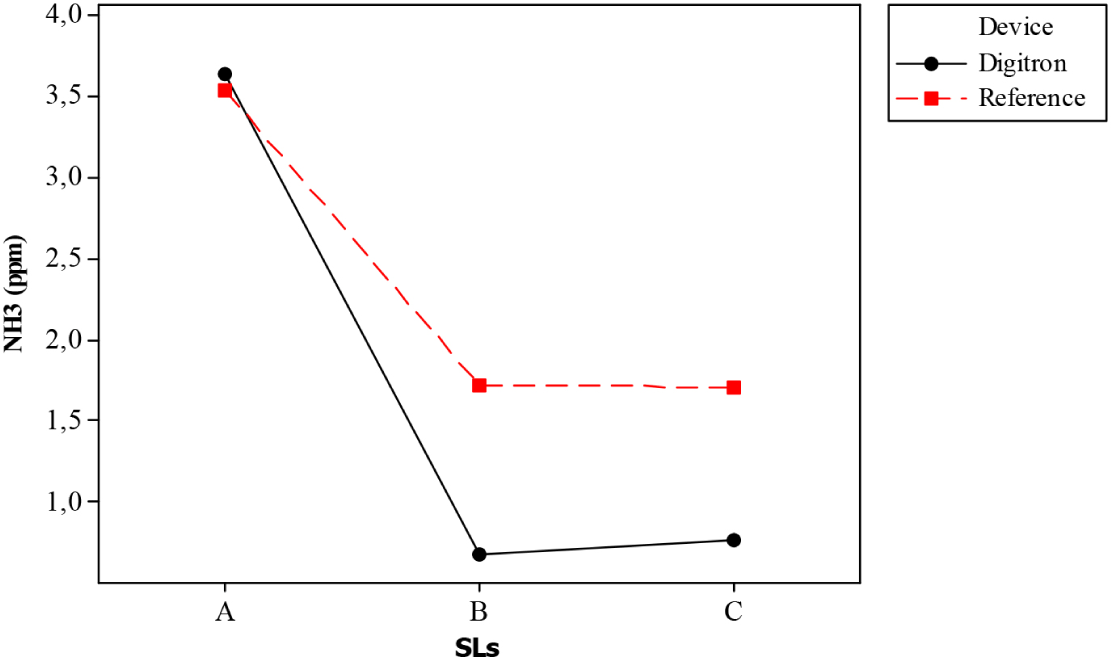
In the fourth experiment, the results of the two-way ANOVA related to NH3 showed a significant influence of the device (p < 0.001), the position of SLs at different height from the floor (p < 0.001) and the interaction between the device and the position of SLs (p < 0.001). The NH3 ranged from 1.3 ppm to 7.5 ppm, 0.9 ppm to 3.7 ppm and 0.9 to 5.6 ppm at SL-A, SL-B, and SL-C, respectively, whereas the CO2 ranged from 457 ppm to 2,266 ppm, 450 ppm to 785 ppm, 452 ppm to 1,036 ppm at SL-A, SL-B, and SL-C respectively.
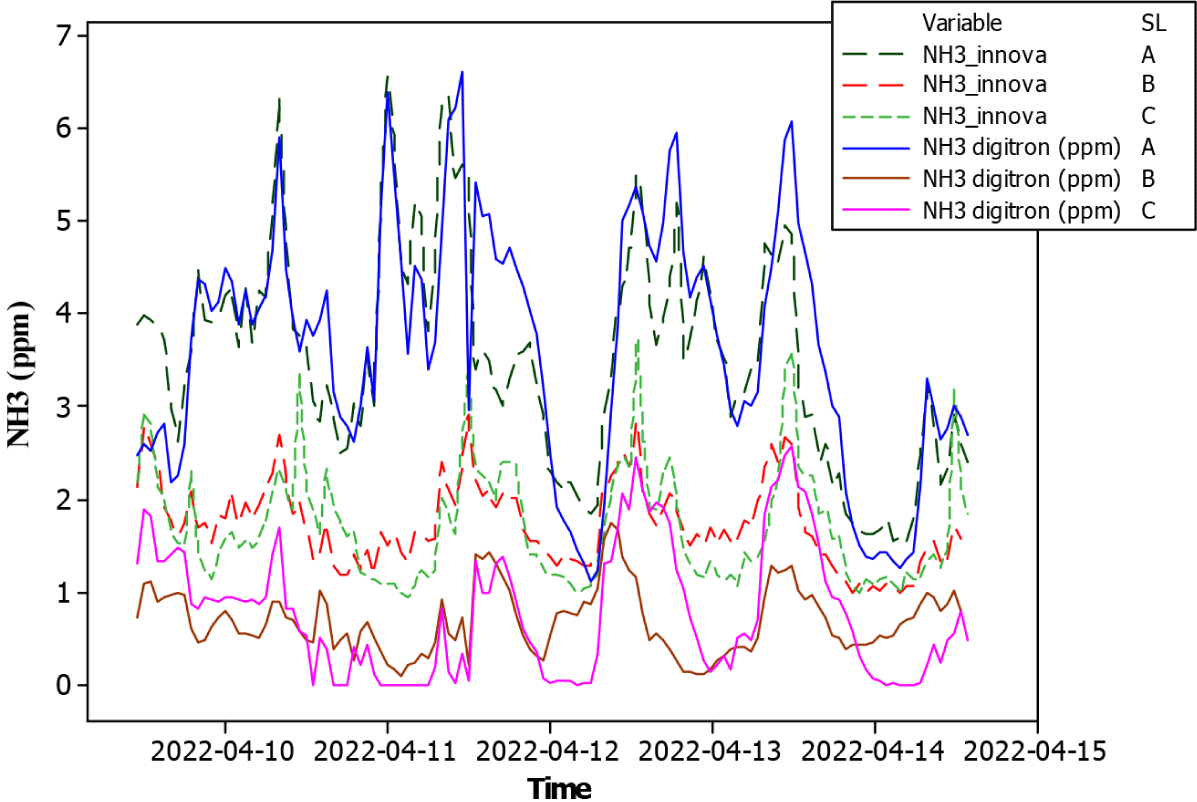
The gas concentrations acquired by INNOVA showed significant differences (p < 0.05), compared to those acquired by Digitron instruments, at different heights from the floor for NH3 and CO2. The highest values of NH3 and CO2 were measured by INNOVA close to the floor. Based on the interaction plot (Fig. 5), when the data acquired by INNOVA were used as reference, NH3 concentrations measured by the low-cost device were overestimated in SL-A and underestimated in SL-B and SL-C. Since the correlation coefficient between NH3 acquired with portable device and NH3 acquired by INNOVA was found significant only in the SL close to the floor (r > 0.70), the best SL to acquire data with the low-cost instrument is that close to the floor.
In detail, Fig. 6 showed the daily trend of NH3 at different SLs and device. There is high similarity rate in the NH3 acquired by INNOVA and Digitron at SL-A. With regard to CO2, the portable devices were not accurate in the measurement of the gas concentrations and therefore they proved to be unsuitable for monitoring gas concentrations in the barn environment.
DISCUSSION
The measurement strategy depends on many factors related to the choice of the instrument (i.e., the parameters’ settings, the measurement frequency, and the number of repetitions for each measurement) and the position of the SLs in the barn with effect on the variability of each measurement.
Knowledge on the instrument set-ups could optimize time measurement length not only in laboratory experiment [36] but also in field conditions. In fact, in this study the set-up influenced the duration of a measurement in the specific SL with effects on the duration of all the measurement cycle.
The best measurement strategy should make it possible to perform more than one measurement cycle (i.e., measurement in all SLs) within an hour. In fact, when gas concentrations are measured in a SL, gas concentrations in the other SLs are not available because they are not measured at the same time. Therefore, it is of interest to optimize the measurement strategy. The set up with SIT5 is more convenient than SIT20 because INNOVA acquires the same data in all SLs in half time. Obtaining many values for a specific location in an hour is useful not only to monitor concentrations but also for emission estimation. In fact, the estimation is generally done by using mean values of gas concentrations for each hour [18,19, 23, 38].
Since the gas distribution is not uniform in the barn environment [27,39], the monitoring of gas concentrations in the barn should be based on many sampling points in the different breeding areas. In this barn typology, the open envelope requires more measurement points both vertically and horizontally distributed. Based on the literature, a long-time interval for each measurement is required. In detail, von Jasmund et al. [40] reported the need of 30 min for each measurement and Rom and Zhang [36] reported measuring periods of 12.5 to 25 minutes. These recommendations derive from studies carried out only in laboratory conditions without any assessment in field conditions. In dairy barn, gas concentrations have high variability for interval between the first and the tenth repetition (Fig. 3), especially in open structures. Based on the results, data variations were recorded in the morning after the first milking and the cleaning of the barn floor (i.e., about 8:00 a.m.) and after the second milking at 5 p.m. Moreover, the changing conditions related to the third milking carried out at 11:00 p.m. influenced the trend of the gas from the first to the tenth measurement. It was possible to record these variations due the frequent measurement intervals. The variability is related to the various influencing factors on gas concentrations previously investigated in the literature in this barn typology (i.e. the number of milkings, the cow routine, and the activation of the cooling system) [41–43]. If we had used a wider frequency range, we would have lost information on data. Therefore, having just one measurement within a long period will increase the uncertainty due to the lack of data related to the variation. Another issue is related to the number of measurements within each hour when the device requires from 12.5 to 30 minutes for one measurement. Only one value of gas concentrations could be recorded for a measurement in maximum three or four locations without any repetitions. In alternative, only three or four repetitions of gas concentrations could be recorded for one SL in the barn. Since gas concentrations are not uniform in field conditions, it is of utmost importance to increase sampling frequency, perform repetitions for each measurement in each SLs, and perform measurement at different SLs in the barn.
Moreover, a higher number of repetitions increased time required by the instrument to perform the measurement cycle. The consequence is that the gas concentrations could be modified in the barn environment due to different conditions (e.g. activation of the cooling system, different animal behaviour, and milkings). Therefore, the acquisition of representative data is also related to the number and position of SLs. Other relevant factors are the barn typology and dimensions. When the study is carried out in a dairy barn with reduced plant dimensions, the number of SLs could be reduced and the number of repetitions for each SL could be increased with a significant improvement in data quality. When the barn has large dimensions the resulting measurement strategy is a compromise between the optimal sampling distribution in the barn and the real number of SLs that could be monitored.
The identification of adequate positions for SLs depends on the aims of the monitoring campaign and the specific barn structure. When the aim of the monitoring is to identify whether gas concentrations are high in a barn with an open structure, the optimal point to measure NH3 is near the floor. At that location, it is possible to better identify peaks in the gas production and verify whether the highest values are lower than the thresholds for operator safety. On the other hand, if the aim of the monitoring is to estimate emissions, it is necessary to verify the optimal locations in this kind of buildings depending on the method applied for the estimation. In the literature, several research studies applied the CO2 mass balance method that uses the CO2 as tracer gas to estimate the ventilation rate [13,44]. This method was confirmed by the VERA [45] protocol as the reference method in naturally ventilated dairy barns, but specific information for open structures is not provided. However, further studies are needed to verify whether some aspects of the VERA protocol suit with the barn typology analyzed in this study. For instance, the VERA protocol suggests measuring gas concentrations at three meters from the floor for emission estimation. This is in line with a specific study carried out by Mendes et al. [29] to identify the right height to measure concentrations. However, this result was found for a mechanical ventilated dairy barn that has a different gas distribution compared to other barn typologies, such as open barns. On the other hand, a recent study of Doumbia et al. [46] showed that the best height to measure gas concentrations is between 1.5 m and 2.5 m in a naturally ventilated barn, highlighting that measuring gas concentrations at 3 meters from the floor needs to be further investigated and, consequently, procedures and protocols should be improved. Another relevant aspect is the limitation method used for the estimation. In detail, when the CO2 is used for the estimation, a limitation method to the difference of indoor and outdoor CO2 concentrations is valuable to reduce the influence of adverse climatic conditions in the estimation process [11,31].
In this context, the aim of the monitoring is of utmost importance because it represents the basis for the choice of the instrument, which is generally selected mainly based on its measurement principle and concentration ranges. Multipoints devices are very expensive, complex to manage and mainly used for research purposes [31]. Low-cost instruments could be of interest for farmers to help them in monitoring the quality of the air in the barn. In fact, they could control the level of gases in the air and, in case of the levels are too high, they could apply strategies in the barn to improve barn management as well as the safety of operators. On this basis, research requires more efforts to identify suitable instruments to these purposes.
CONCLUSION
In Mediterranean area, the dairy barns are usually characterized by an open structure which affects the variability of gaseous concentrations and related emissions.
In order to obtain representative data of gas concentrations, environmental monitoring is the first step. This research study have provided with statistical evidence, hints to acquire and process data of gas concentrations in the specific structure of an open dairy barn. The design of a sampling strategy through a specific sampling frequency, number of SLs, position of SLs, set-up of the instrument was proved to be suitable to optimize the monitoring of gas concentrations. In detail, specific practical recommendations, and good practices for the use of a specific detection device were provided in this research study:
-
- It is recommended to have frequent measurement intervals since substantial changes of the gas concentrations in-field conditions occurs within about 5 minutes for each position.
-
- It is recommended to measure gas concentrations at different locations in the barn and for each position it is recommended to perform some repetitions for each measurement.
-
- When an INNOVA instrument is used for monitoring gas concentration, it is recommended to use a SIT of 5 s to increase data frequency and to be able to perform three repetitions for each measurement. The most representative value of NH3 concentration measurement is the mean value of the second and third repetitions.
-
- It is recommended to select a device based on the purpose of the monitoring (i.e., measurement of gas, emission estimation, or assessment of mitigation strategies).
Based on the outcomes of this work, it would be beneficial for the knowledge in this field to improve the techniques for measuring gas concentrations and estimating emissions in Mediterranean context with severe warm climatic conditions. In these contexts, there is the need to update emissions inventories. In addition, alternative methods, especially those making use of smart technologies, should be further investigated to provide adequate instrument and protocols for farmers and stakeholders to perform environmental control.


