INTRODUCTION
In recent years, the widespread use of hyperprolific sows to boost productivity in the pig industry has also resulted in a notable rise in piglet mortality. This increase is primarily attributed to instances in which the piglets are crushed by the sows shortly after the farrowing process [1]. Meanwhile, there is a global shift toward emphasizing animal welfare in livestock farms. This is evident in the transition from closed farrowing crates, which restrict maternal mobility, to loose or free housing systems that provide sows with increased freedom of movement. However, this transition has raised concerns about an increase in piglet crush rates, which are commonly attributed to risky behaviors such as rolling and sudden transitions from standing to sternal lying [2,3]. Piglet crushing constitutes a significant cause of death among pre-weaned piglets, contributing to over 50% of pre-weaning losses in pig farming [4]. Notably, most of these piglet fatalities occur within the first three days after farrowing [5].
Factors affecting crushing incidents can be categorized into genetics, environmental factors, parity and litter size, pig weight and health, housing system, and management [4]. Previous research aimed at mitigating crushing issues, without the use of artificial intelligence (AI) technology, has primarily focused on identifying and reducing these factors. To address the root cause of crushing events, it is crucial to identify these incidents, especially in the absence of farm staff.
Recent research has integrated AI to identify crushing incidents with minimal human intervention, primarily focusing on two main types: sound-based and video-based approaches. In sound-based research, a platform was developed using voice data to detect crushing through piglets’ screams [6]. This study proposes an audio clip transform approach for preprocessing raw audio data and employs min-max scaling for machine learning to detect piglet screams. Despite technological advancements, these tools encounter challenges in scenarios where piglets cannot vocalize distress, such as head or full-body crushing incidents. In addition, pinpointing the precise location of the crushing event in cases involving multiple pens also poses a challenge. Furthermore, the barn environment’s diverse noises, including piglet scuffles, running fans, and other ambient sounds, can cause device malfunctions, hindering precise recognition of piglet crushing incidents. Conversely, in a video-based AI study on crushing, the emphasis shifted to assessing the risk of crushing by recognizing the sow’s behavior rather than directly identifying crushing events [7]. This study assessed sow behavior using a three-axis accelerometer and video data. Following the recognition of sow behaviors, maternal care was evaluated by scoring the risk and number of behavioral patterns associated with increased trapping events.
To maximize the utility of these technologies, a recent development involves the introduction of artificial intelligence of things (AIoT). AIoT represents the convergence of AI and internet of things (IoT), offering the capability to use networks and cloud services for real-time problem solving with minimal human intervention. Researchers have recently employed AIoT technologies to develop a pig tracking and monitoring system [8,9]. The pig farming industry is increasingly incorporating and using these technologies. However, for the optimal use of AIoT, it must function within the constraints of the IoT environment. Therefore, in choosing the most suitable AIoT model, it is essential to strike a balance between efficiency and functionality in a resource-constrained environment. The selection process should prioritize both performance and model size.
This study aimed to identify an object detection algorithm within an AIoT framework capable of efficiently detecting piglet trapping and subsequently implementing it in practical applications. Object detection algorithms are broadly categorized into two-stage and one-stage models. The two-stage model involves a local proposal followed by a classification stage, offering high accuracy, albeit at a slower pace [10]. Conversely, single-stage models simultaneously perform classification and localization, offering higher speed and making them particularly suitable for IoT and mobile device applications [10]. Among the prominent single-stage object detection techniques, You Only Look Once (YOLO) was introduced in 2015 by Redmon et al. [11]. The YOLO model encompasses Darknet-based versions such as YOLOv3 and YOLOv4, PyTorch-based models such as YOLOv5, and their successor models [12]. In this study, we implement and compare three representative models: YOLOv4, a modern Darknet-based model; YOLOv5, a popular PyTorch-based model; and YOLOv8, the latest model. The aim is to scrutinize these models, seeking the most effective in detecting piglet strangulation. Furthermore, the study aims to evaluate the feasibility of implementing, optimizing, and operating the selected model within an AIoT environment.
MATERIALS AND METHODS
Five sows were housed in loose pen conditions (2.4 × 2.3 m), with each farrowing pen equipped with a slatted concrete floor and a heat lamp. AIoT was installed seven days before the expected farrowing date to observe piglet birth, crushing, trapping, sow posture, and piglet tracking. Internet protocol cameras (HN0-E60, Hanwha Techwin, Korea) were positioned 1.5 m above the sow’s head with 1920 × 1080 pixels display resolution and 30 FPS frame rate.
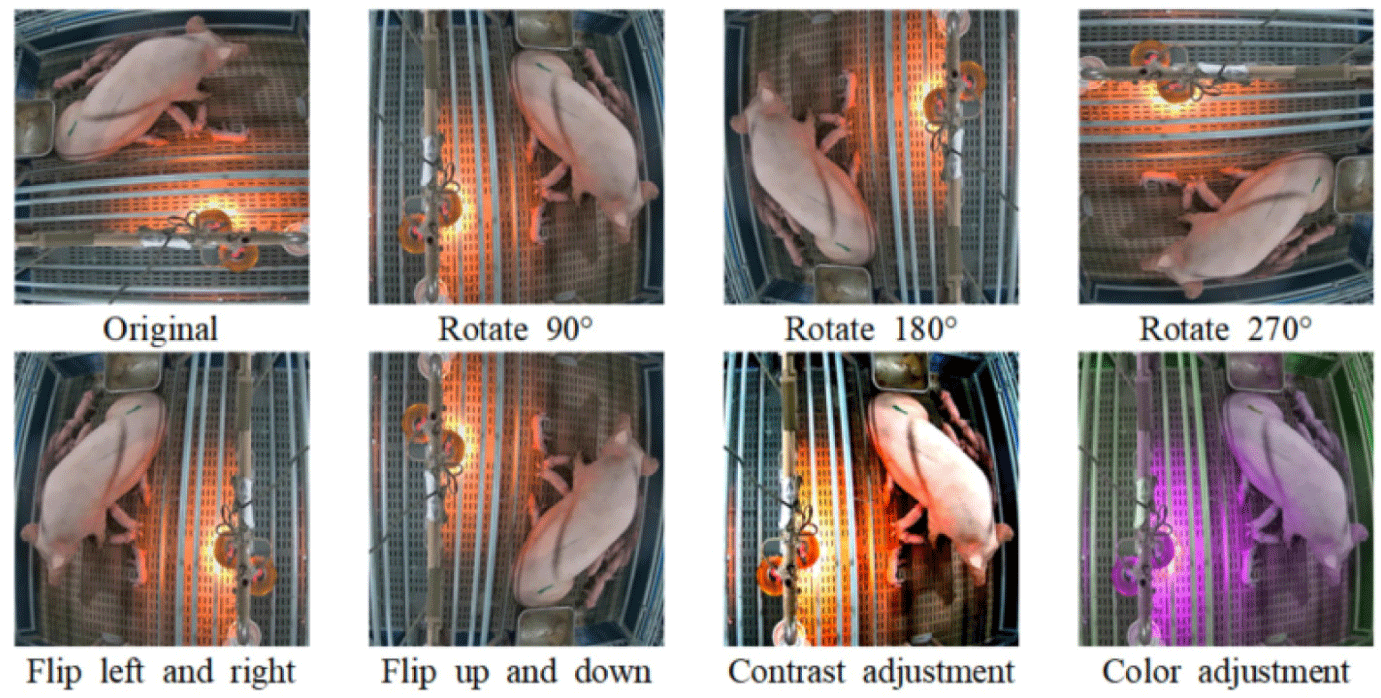
After recording the video, the footage was reviewed to identify the section where the trapping incidents occurred. These sections were then extracted and collected for 24 h following the onset of parturition. Once identified, these specific scenes were extracted, and images were obtained for each frame. In this study, the YOLO bounding box program was used to generate bounding boxes and corresponding labels for individual images. As shown in Fig. 1A data augmentation technique was applied to enhance the diversity of the training dataset. This technique involved variations in saturation and contrast, along with rotations (90°, 180°, 270°) and horizontal and vertical flips. As a result of this augmentation process, the total number of images increased significantly from 544 to 9,792, creating a more comprehensive training dataset. The dataset was then divided into training, validation and test sets using a 6:2:2 ratio, resulting in 5,875 images for training, 1,958 images for validation and 1,959 images for testing. This setup was based on a previous study that used YOLO to detect tomatoes in real time, which also used a 6:2:2 data split [13]. The systematic application of data augmentation and dataset separation aimed to increase the model’s resilience in adapting to different learning environments. In the original dataset configuration prior to augmentation, there were 4570 classes for no trapping, 267 classes for trapping, and 129 classes for crushing.
The annotated dataset, without further conversions, served as the input for training three object detection algorithms: YOLOv4-Tiny, YOLOv5s, and YOLOv8s. YOLOv4-Tiny, a model based on Darknet, YOLOv5s, the most popular PyTorch-based model, and YOLOv8s, the most recently published model, were all trained in the Google Colab environment. We applied transfer learning to our dataset using the pre-trained model weights from the ImageNet dataset. In the experiments summarized in Table 1, the YOLO model was trained for 50 epochs with a batch size of 64 and a fixed learning rate of 0.01. This setup was used to fine-tune the model weights for optimal training performance. For models like YOLOv4-Tiny that do not use an epoch-based system, the training process is controlled by a hyperparameter called max-batch. The value of max-batch is calculated using the formula:
| Parameters | YOLOv4-Tiny | YOLOv5s | YOLOv8s |
|---|---|---|---|
| Number of iterations | Max-batch:4590 | Epoch: 50 | Epoch: 50 |
| Batch | 64 | 64 | 64 |
| Learning Rate | 0.01 | 0.01 | 0.01 |
Given that the number of images per epoch was set to 5875 and the batch size to 64, the resulting max-batch value was approximately 4,589.84. This value was rounded to 4590, which was used as the max-batch parameter during training. During training, the input image was resized to 416 × 416 to for feature map extraction.
Each version of YOLO introduces architectural innovations aimed at improving the model’s performance in object detection. YOLOv4 employs CSPDarknet53 for efficient feature extraction, coupled with SPP and PAN for multi-scale feature integration [14]. YOLOv5 enhances this with a focus structure and CSP backbone, paired with FPN and PAN for refined feature aggregation [15]. YOLOv8 further advances the architecture by incorporating C2f modules, optimizing both the backbone and neck for superior detection capabilities [16,17].
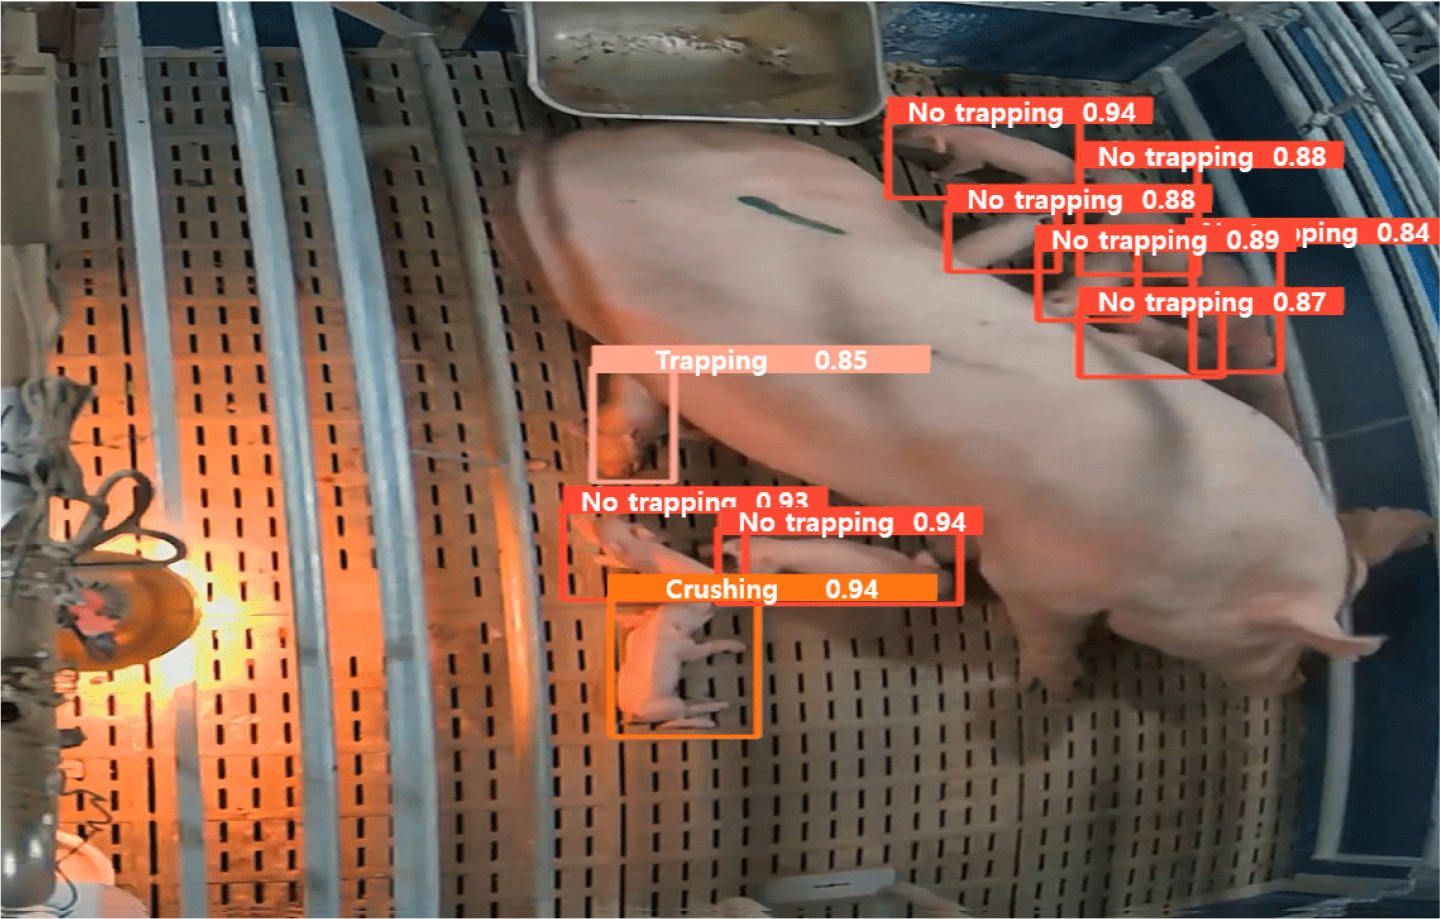
Fig. 2 illustrates the results of applying YOLOv5s to a piglet crushing site after the learning process. Three classes were identified in this study: no trapping, trapping, and crushing. “No trapping” denotes that the piglet is fully visible on the screen without any part of its body being covered or crushed. Conversely, “trapping” indicates that the piglet has been compressed by its mother, resulting in part or all of its body being obscured. The term “crushing” is used when the piglet stops moving after being caught, indicating that it has succumbed to compression and has died. While detecting crushing from a single image is challenging due to data limitations and the visual similarity between sleeping and crushed piglets, this study represents a significant step forward. The foundation laid by this research will inform the development of more advanced detection systems. Future efforts will focus on incorporating tracking to improve detection accuracy.
The evaluation of a classification model involves several metrics, such as precision, recall, average precision (AP), mean AP, and F1 score. These metrics provide insight into different aspects of model performance.
In Equation (2), precision represents the percentage of instances that the model correctly classified as true among all instances it classified as true. Specifically, precision is calculated as:
where true positives (TP) are the cases where the model correctly identifies a positive instance, and false positives (FP) are the cases where the model incorrectly classifies a negative instance as positive. Equation (3) defines recall as the percentage of true instances that the model correctly identifies as positive out of the total number of actual positive instances. Recall is calculated as:
where false negatives (FN) are the cases where the model fails to identify an actual positive instance, incorrectly classifying it as negative. Precision measures the accuracy of positive predictions, while recall assesses the model’s ability to detect all positive instances. AP measures the precision value averaged over different confidence levels for a given class. It provides a comprehensive view of a model’s performance by evaluating the precision at different confidence levels. The mean average precision (mAP), as defined in Equation (4), represents the average of the APs computed across multiple classes or instances, providing an aggregate measure of performance across all classes.
mAP@0.50 is a metric that evaluates the performance of an object detection algorithm by averaging the precision scores across all classes, assuming that predictions with an intersection over union (IoU) of 0.50 or higher are considered correct. The IoU in Equation (5) is a metric used to evaluate the accuracy of predictions made by an object detection algorithm. It is defined as the ratio of the area of overlap between the ground truth bounding box and the predicted bounding box to the area of their union.
Specifically, IoU measures how well the predicted bounding box aligns with the ground truth bounding box, providing a quantifiable measure of prediction quality.
The F1 score is a model evaluation metric used in classification models. Another widely used evaluation metric is accuracy, which is defined as the proportion of true values among all predictions. However, accuracy has a limitation, particularly in the context of unbalanced data, where it can be misleading. In scenarios where, for instance, the probability of cancer is 1%, the model can achieve 99% by classifying all patients as non-cancerous, presenting a potential vulnerability. Therefore, the F1 score is frequently employed for assessing unbalanced data. Equation (6) defines the F1 score as the harmonic mean of the precision and recall values. These metrics collectively provide a comprehensive evaluation of the classification model.
The precision-recall curve is a graph of the change in precision and recall values as the confidence threshold changes. The graph has recall on the x-axis and precision on the y-axis. The AP signifies the average of the precision across different recall values. In the context of a precision recall curve, AP corresponds to the area under the curve.
RESULTS AND DISCUSSION
Table 2 provides a comprehensive comparison of the AP, mAP, and F1 score derived from the training of YOLOv4-Tiny, YOLOv5s, and YOLOv8s. The performance across these models remains consistently robust, with a marginal difference observed. YOLOv5s (0.994) and YOLOv8s (0.994) achieved higher mAP compared to YOLOv4-Tiny (0.958), as shown in Table 2. A study comparing YOLOv4-Tiny and YOLOv5s found that YOLOv5s performed better, with a 0.133 higher mAP value than YOLOv4-Tiny [18]. In addition, a comparison between YOLOv5 and YOLOv8 showed a very small difference in mAP values of 0.006 [19]. This suggests that the performance difference between YOLOv5 and YOLOv8 is negligible. These findings are consistent with our results, which also show that YOLOv5 and YOLOv8 have similar performance metrics, while YOLOv4-Tiny lags behind.
When we analyzed the performance metrics by class, YOLOv4-Tiny performed poorly overall. However, it performed best in the Crushing class. YOLOv5s and YOLOv8s showed similar performance, probably due to their similar structures. Notably, YOLOv8s achieved relatively higher APs in the No trapping scenario compared to YOLOv5s, reflecting its structural improvements. The No trapping class of YOLOv8s (0.993) has an AP that is 0.002 higher than that of YOLOv5s (0.991). However, due to rounding to the fourth decimal place, the mAP for both models are almost identical: 0.9943 for YOLOv8s and 0.9937 for YOLOv5s, indicating a slight difference.
Model size is a critical factor in the practicality of IoT deployments, especially in small-scale computing environments. With a compact model size of 13.6 MB, YOLOv5s stands out as the most suitable choice for AIoT applications. This is in stark contrast to the larger sizes of YOLOv4-Tiny (22.4 MB) and YOLOv8s (21.4 MB), as shown in Table 2. Consequently, YOLOv5s proves to be the optimal model for AIoT applications, balancing high performance with a compact model size.
Fig. 3 illustrates the precision-recall curve for all classes of YOLOv5s, the model considered most suitable for AIoT applications. YOLOv5s exhibits an AP of 0.991 for no trapping, 0.995 for trapping, and 0.995 for crushing, yielding an overall mAP of 0.994 (Fig. 3).
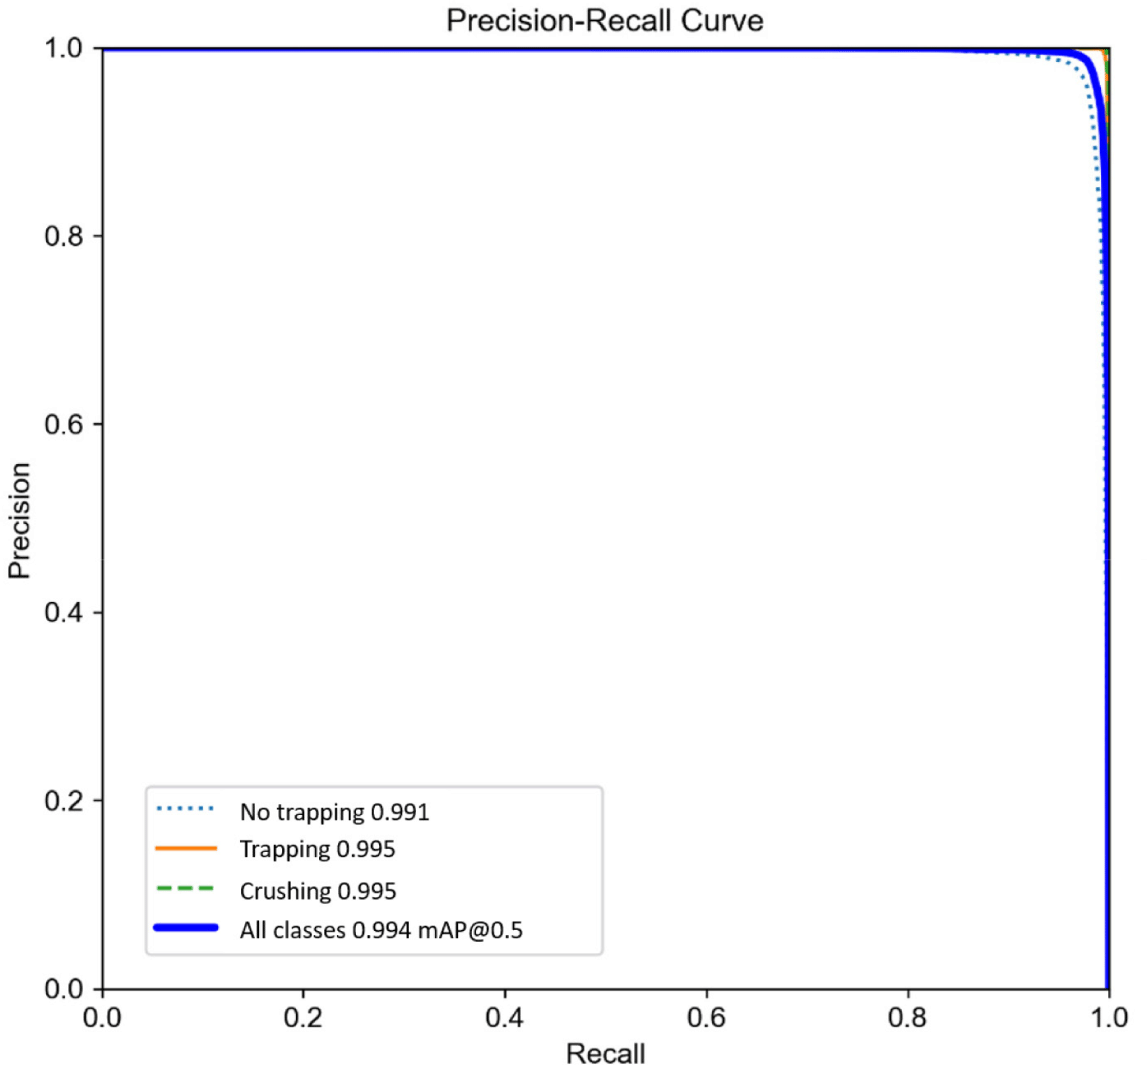
Although the AP for no trapping is slightly lower than that for the other classes, the recognition for trapping, which is the relevant class in this study, is 0.995 (Fig. 3), indicating a high level of performance.
The confusion matrix represents the ratio of the actual true value to the predicted true value for each class. Out of the total 18,281 detected individuals, 16,796 individuals were in no trapping, 1,049 individuals were in trapping, and 436 individuals were in crushing. Due to the data imbalance with the overwhelming number of individuals in no trapping, Fig. 4 presents the confusion matrix, depicting the performance as a percentage for each class. In Fig. 4, the confusion matrix for YOLOv5s provides a detailed breakdown of the predictions across all classes. In the no trapping class, the model achieves accurate predictions 98.9% of the time, with background recognition errors (failures to recognize no trapping) occurring only 1 % of the time (Fig. 4). For the trapping class, the model predicts trapping with 97.1% accuracy but occasionally misclassifies it as no trapping (2.7 %) (Fig. 4). Similarly, in the crushing class, the model achieves accurate predictions 97.9% of the time but may misidentify it as no trapping (2.1%) (Fig. 4). In particular, the background has a high probability (96.8%) of correctly predicting no trapping class when no trapping event is present (Fig. 4).
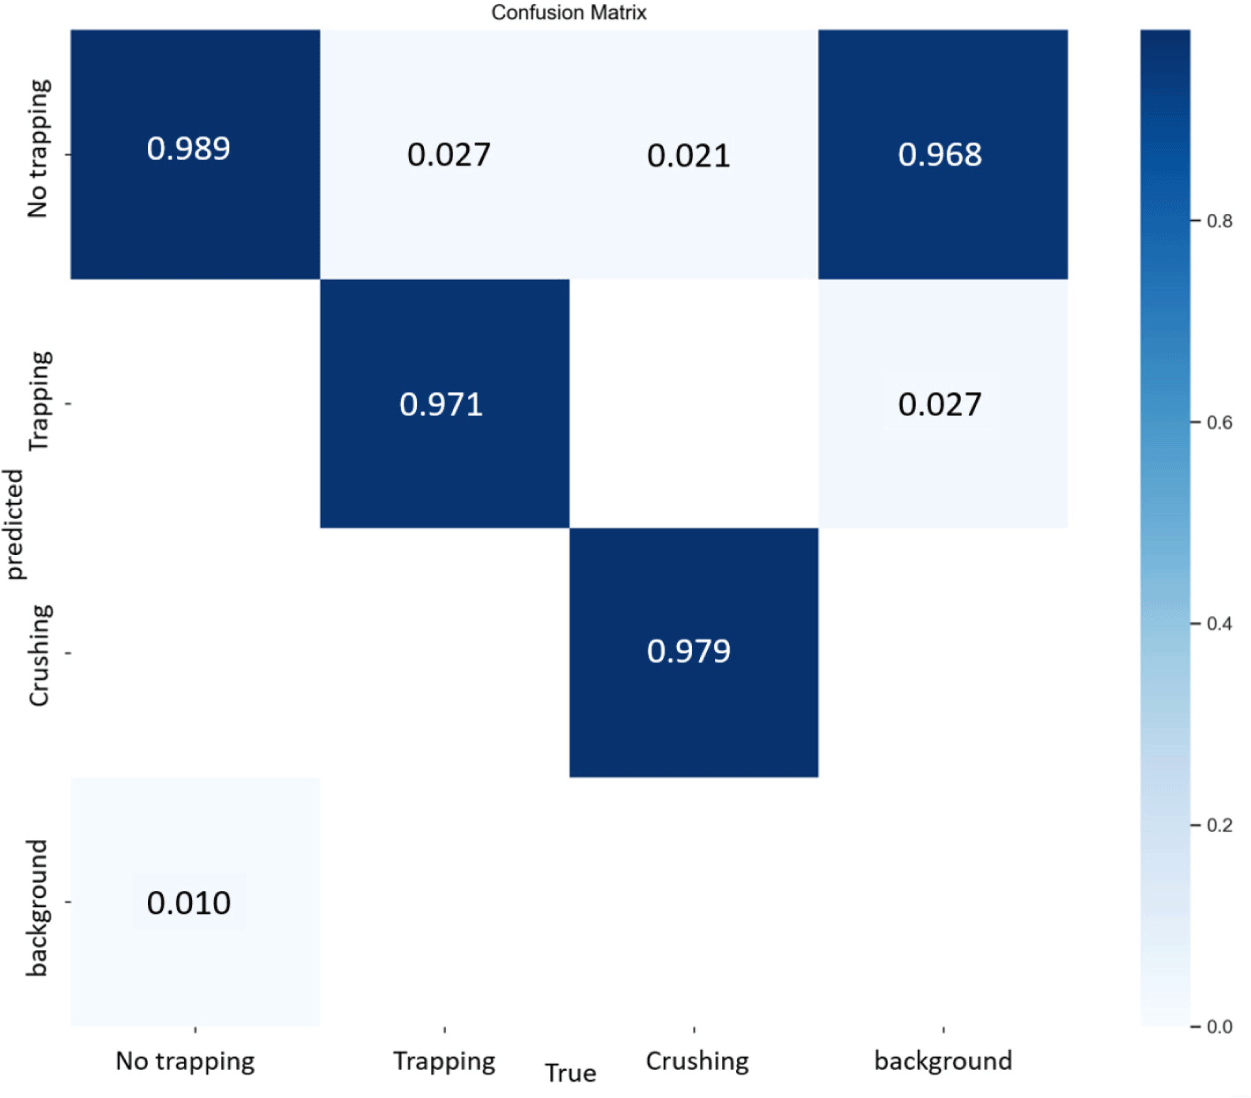
In the confusion matrix, the misidentification rate of no trapping in the background with objects is 0.968. Other studies showing confusion matrices for YOLOv5 also reveal a notable misidentification rate for other classes in the background with no objects [20]. However, this is a feature of confusion matrices, which are presented as percentages due to unbalanced data. Although 0.968 (Fig. 4) seems quite high, it represents a small percentage of the total misidentifications. To address this confusion, it is more intuitive to evaluate performance in terms of accuracy or F1 score.
Fig. 5 illustrates the optimal confidence hyperparameter values for class differentiation. A confidence value of 0.608 achieves the best F1-score of 0.97 for no trapping, whereas trapping is best detected with a confidence hyperparameter of 0.638, resulting in a perfect F1 score of 1.00 (Fig. 5). Similarly, for crushing, an optimal F1 score of 1.00 was achieved with a confidence hyperparameter value of 0.740 (Fig. 5). Attaining balanced performance across all classes, a confidence hyperparameter value of 0.621 achieves the highest F1-score of 0.99 (Fig. 5), demonstrating the model’s effective recognition of all classes.
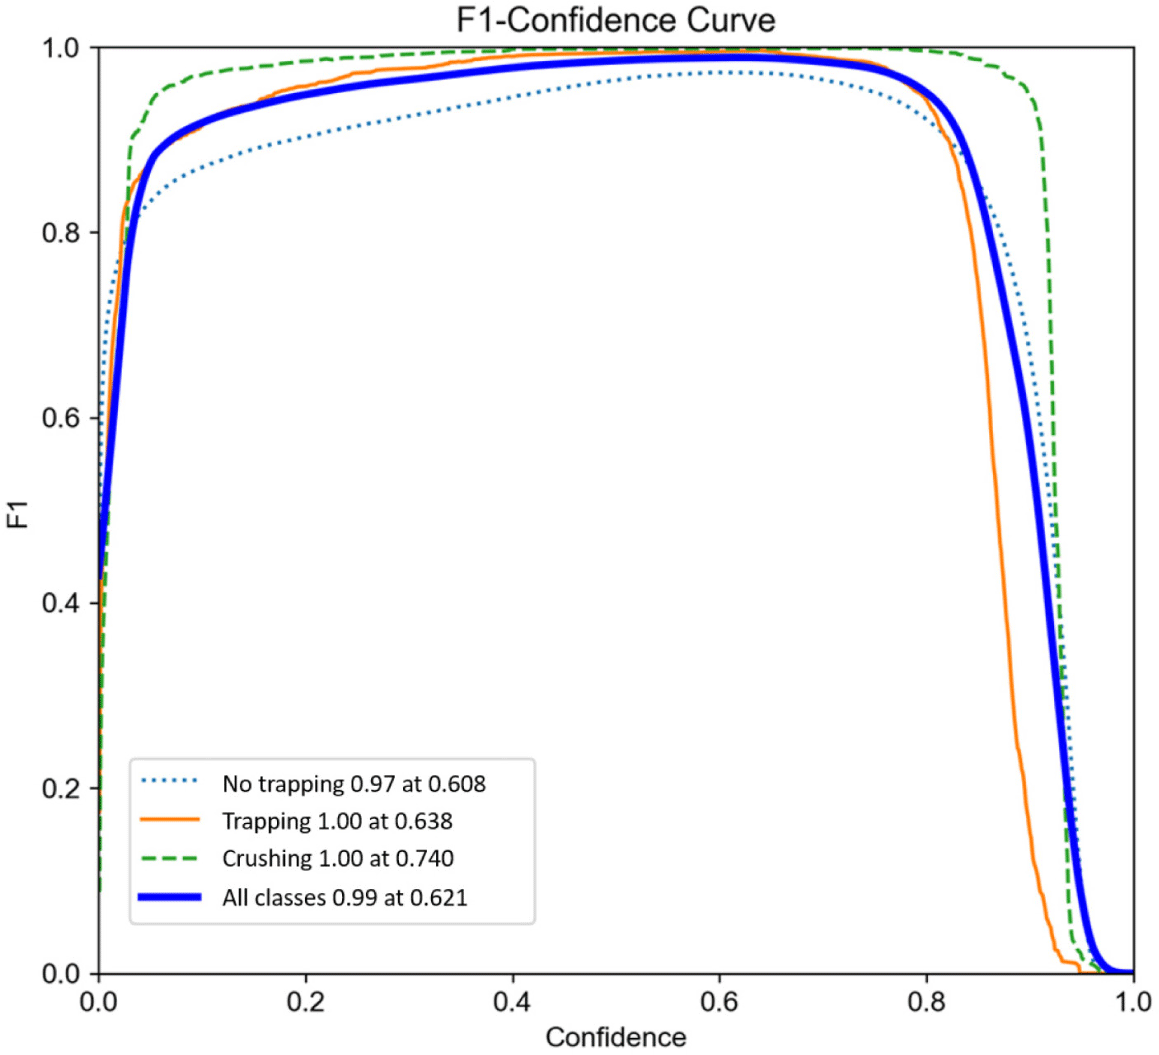
The F1 confidence curve graph reveals a clear pattern with a rapid increase in the F1 score in the 0.0–0.2 confidence range. Performance is generally maintained or slightly improved up to 0.2–0.7. However, the F1 score shows a notable decrease when the confidence level exceeds 0.8. This aligns with similar findings in other studies where the variation in the F1 score with confidence showed a sharp increase up to 0.2 and a modest increase up to 0.7 [21]. Furthermore, in other studies, the confidence interval with the highest F1 score is usually in the range of 0.5–0.7, and the graphs in this study show the highest F1 score in this range for no trapping, trapping, and all classes, which is consistent with this result. However, for the crushing class, the best performance is in the high confidence interval (0.740) (Fig. 5), which seems to be a temporary phenomenon due to the lack of data for the crushing class.
While YOLO demonstrates robust performance in detecting trapping based on images, it has inherent limitations. Notably, the system can only detect trapping when a portion of the piglet’s body is visible within the camera’s field of view. This leaves it incapable of identifying situations where the entire body is trapped or events that occur outside the camera’s field of view due to obstructions. In addition, the system is susceptible to false positives, particularly when certain parts of the sow’s body, such as the ears, are mistakenly identified as trapping points, leading to inaccuracies in detection.
To address these challenges, future research will explore the integration of optical flow technology. Optical flow, a method for tracking objects by analyzing the temporal flow of video and detecting pixel movement between frames, has the potential to enhance trapping prediction [22]. This study aims to implement video-based trapping prediction technology using optical flow to overcome the limitations associated with image-based detection. This innovative approach aims to improve accuracy, particularly in distinguishing between similar objects such as the ears of a sow. By predicting object movement and controlling pixel flow, this research expects accurate identification of trapped piglets or sow body parts. This methodology will extend detection capabilities to scenarios in which the entire body is trapped, a subtlety overlooked by conventional image-based trapping detection models.
CONCLUSION
In this study, our objective is to apply an AIoT system that minimizes human intervention to address the critical issue of piglet crushing by sows, a leading cause of mortality in pig farms. Given the constrained AIoT environment, our model selection criteria extend beyond performance, encompassing model size as a pivotal factor for efficient deployment within AIoT frameworks. YOLOv4-Tiny did not demonstrate significantly superior performance compared with the other models. Moreover, its considerable model size makes it unsuitable for deployment in small-scale computing environments such as the IoT. Despite YOLOv8s being the latest version, it introduces potential uncertainties in stability when compared to the other models. In addition, the AP performance, especially for trapping, is comparable to YOLOv5s, even though YOLOv8s has a model size about 7.8 MB larger. These shortcomings render the model less suitable than YOLOv5s for certain AIoT applications based on specific metrics. Notably, YOLOv5s stands out for its exceptional performance in the trapping class and remarkably small model size. These qualities position it as an ideal choice for AIoT applications, particularly for tracking piglet crushing challenges in pig farms.


