
INTRODUCTION
Commercial laying hens are selected for their intensive egg production performance and account for the major egg proportion in Korea. However, increasing dependence on commercial hens for egg production increasingly threatens the diversity of genetic resources [1,2]. Several studies have been undertaken to develop indigenous chicken breeds to protect and promote their genetic variability in Korea. Therefore, the National Institute of Animal Science in Korea conducted a restoration project (Golden Seed Project) to preserve Korean native chicken (KNC) and developed intrinsic KNC breeds. Consequently, Woorimatdag No. 1 breed was developed in 2008 via three-way crossbreeding between Black Cornish and Brown KNC males with Rhode Island Red females, which exhibits distinctive taste and texture compared to traditional KNC [3]. However, this breed exhibits low growth performance, making it challenging to meet market demands. Therefore, Woorimatdag No. 2 breed was developed in 2010 by cross-mating between Black Cornish/Brown Cornish males and Brown KNC/Rhode Island Red females, aiming to generate cost-effective KNC for commercial purposes [4]. Blue hen, a crossbreed of White Leghorn and Araucana, is reared in Korea as the Gyeong-buk Araucana domestic breed [5]. This breed has been garnering popularity owing to its unique blue color eggs [6]. To date, several efforts have been made to identify the meat quality in these KNC breeds [4,7]; however, detailed information on the distinct egg qualities of KNC remains limited.
Chicken egg quality is determined by both external and internal characteristics. External characteristics include traits that influence consumer acceptability, such as eggshell shape, strength, color, and weight. Internal quality, on the other hand, is assessed through various parameters, including the Haugh unit, yolk color, and yolk-to-albumen ratio. In addition, chicken eggs are rich in essential nutrients, including proteins, lipids, minerals, and vitamins, which are beneficial for human health. Egg yolk, which accounts for 28%–29% of total egg weight, comprises approximately 16% and 32% of proteins and lipids, respectively [8]. Egg yolk is extensively used as a functional ingredient in many food, cosmetic, and pharmaceutical industries because it exhibits various multifunctional characteristics [9]. Furthermore, it provides high–value biological components, including α-tocopherol, tryptophan, phospholipids, and peptides, contributing to its antioxidant activity [10].
Consumers are not only interested in the quality and components of eggs and their products but also in the organoleptic qualities, including taste and aroma. Egg yolk plays a major role in the formation of egg flavor, as it contains a significant amount of flavor precursors, including lipids and proteins compared to albumen. Flavor encompasses a complex reaction between taste- and aroma-related compounds, including free amino acids, fatty acids, and volatile compounds [11]. Volatile compounds, responsible for the aroma characteristics, are primarily formed via the oxidative decomposition of unsaturated fatty acids and the Strecker reaction of amino acids [12]. Recent evidence suggests that breeding and genetics can affect amino and fatty acid profiles of egg yolk [13]. Furthermore, differences in nutritional and genetic conditions resulted in the distinct chemical composition of eggs [1]. These variations can subsequently lead to differences in the aroma and flavor of egg yolk. To date, several studies have been carried out to explore flavor-related compounds in the egg yolk of indigenous chickens extensively raised in China (volatile compounds), Japan (free amino acids), and Portugal (fatty acid composition) [2,13–15]. Nevertheless, a comprehensive study on egg and yolk quality and egg yolk flavor characteristics from novel KNC breeds, particularly Woorimatdag breeds, are very scarce.
Therefore, this study was designed to provide a basic understanding of the quality and flavor profiles of KNC eggs by evaluating both egg quality and yolk characteristics, including antioxidant activity and non-volatile and volatile flavor compounds, in three KNC breeds: blue-shelled egg (BSE), Woorimatdag No. 1 egg (WRMD1E), and Woorimatdag No. 2 egg (WRMD2E).
MATERIALS AND METHODS
Commercial eggs (CE, Hyline Brown, 54-wk-old) and KNC eggs were provided by the National Institute of Animal Science in Korea. BSE, WRMD1E, and WRMD2E were obtained from blue hens (Araucana × Ogol × White Leghorn, 54-wk-old), Woorimatdag No. 1 chicken (56-wk-old), and Woorimatdag No. 2 chicken (56-wk-old), respectively. The birds were raised in free range during the day and housed indoors at night. All birds were fed a commercial diet (metabolizable energy, 2,500 kcal/kg; crude protein, 15.0%; calcium, 3.60%; phosphorus, 0.48%). Fifty eggs produced within two days were randomly collected from each bird group, resulting in a total of 200 eggs. The eggs were transported to the laboratory at 4°C and analyzed immediately upon arrival. Briefly, 30 eggs were subjected to determine egg quality, then yolk were separated using egg separator, and two yolk were randomly pooled to prepare 15 egg yolk samples for subsequent analysis of yolk physicochemical traits, antioxidant activity, and non-volatile flavor compounds. Another 20 eggs were boiled at 100°C for 15 min. Thereafter, yolk were separated and randomly pooled to make 10 boiled yolk samples to analyze volatile compounds profiles. The egg specimens used in this study conformed to the same criteria (52–60 g) of the [Egg Weight Standard] established by the Korea Institute for Animal Products Quality Evaluation.
An electronic digital caliper (AD5763150, A&D Company) was used to measure egg length (mm). Yolk color and Haugh unit (HU) were determined using an egg multi-tester (EMT-5200, Robotmation). The yolk: albumen (Y/A) ratio was calculated by dividing the yolk weight by the albumen weight. A colorimeter (Chroma Meter CR-400 instrument, Minolta) was used to determine eggshell color CIE L*, CIE a*, and CIE b* after calibration (Y = 93.60, x = 0.3134, and y = 0.3194). A TA1 texture analyzer (Lloyd Instruments) equipped with a 10-mm diameter probe (load cell, 500 N; crosshead speed, 50 mm/min) was used to measure eggshell strength (kgf) at the small end of the egg. Eggshell weight (g) and thickness (mm) were determined as previously described with slight modifications [16]. The eggshells were washed carefully, dried (50°C for 24 h) and cooled (20°C for 30 min) before weighing. A micrometer (103–109 Outside Micrometer 0-25 mm) was used to measure eggshell thickness as the average value of the large end, small end, and equatorial regions of the shell.
Moisture, crude protein, crude fat, and crude ash composition was evaluated according to the AOAC official methods [17].
The pH was analyzed by calibrated (pH 4.1 and 7.0) pH meter (Orion 230A, Thermo Fisher Scientific).
The extraction of cholesterol was conducted as previously described [7]. Gas chromatography (7890N, Agilent Technologies) equipped with a HP-5 column (30 m × 0.33 mm × 0.25 mm, Agilent Technologies) was used. Analytical condition was as follows; carrier gas: helium, flow rate: 1.0 mL/min, split ratio: 1:12.5, injector temperatures: 250°C, and flame ionization detector temperatures: 300°C. The oven temperature program was set as follows: an initial temperature of 190°C was maintained for 2 min, increased at 20°C/min to reach 230°C, where it was held for 3 min. Subsequently, the temperature was raised at 40°C/min to 270°C and maintained for 25 min. The cholesterol content (mg/g) was obtained by the ratio of target area to the internal standard area.
The egg yolk extract was prepared as previously described with modifications [10]. A 2.0 g lyophilized egg yolk with 8 mL 80% methanol was vortexed (2 min), which was further extracted by sonicator (10 min) and then centrifuged (4°C, 3,000×g, 20 min). The supernatant (4 mL) was combined with 400 μL 10% trichloroacetic acid (w/v) and centrifuged (4°C, 3,000×g, 20 min) to obtain the supernatant for antioxidant assays. Trolox was used to establish the standard curve in four antioxidant assays.
The 1,1-Diphenyl-2-pricrylhydrazyl (DPPH) radical scavenging activity was evaluated as previously described [18]. A 100 μL sample and 0.2 mM DPPH radicals (in methanol) were mixed and a mixture was incubated (25°C for 30 min). The absorbance was measured at 517 nm through spectrophotometer (SpectraMax M2, Molecular Devices) and the result was obtained by following Equation (1).
The 2,2-Azino-bis (3-ethyl-benzothiazoline-6-sulfonic acid) (ABTS) radical scavenging activity was determined as previously described [19]. Equal volumes of 5.9 mM potassium persulfate and 14 mM ABTS+ solution was mixed to create ABTS+ radical stocks (23°C for 12 h), which was subsequently diluted to achieve an absorbance of 0.700 ± 0.02 at 735 nm. A 50 μL sample was mixed with 950 μL ABTS+ radical solution (30°C for 30 min). The absorbance was measured at 735 nm and the result was obtained by following Equation (2).
The oxygen radical absorbance capacity (ORAC) was evaluated as previously described with slight modification [20]. A 25 μL sample and 150 μL 80 nM fluorescein were mixed and then incubated (37°C for 15 min). Subsequently, 25 μL 50 mM 2,2’-azobis (2-amidinopropane) hydrochloride was added to generate peroxyl radicals. The change in the absorbance was monitored every minute at an excitation wavelength of 480 nm and an emission wavelength of 520 nm at 37°C. The results are expressed as mmol Trolox equivalent (TE)/g dry matter (DM).
Ferric reducing antioxidant power (FRAP) was evaluated according to previously described [18]. The working solution was prepared by combining 300 mM acetate buffer (composed of 1.55 g sodium acetate trihydrate and 8 mL acetic acid, diluted to 500 mL, and adjusted to pH 3.6), 10 mM 2,4,6-tripyridyl-S-triazine in 40 mM HCl, and 20 mM FeCl3·6H2O solution in a ratio of 10:1:1 (v/v/v). A 25 μL extracted sample and 175 μL FRAP working solution were mixed and incubated (37°C for 30 min). The absorbance was measured at 590 nm and the result was expressed as mmol TE/g DM.
For determination of fatty acid composition, lipid extraction and derivatization were conducted as previously described [7]. An Agilent 7890N gas chromatograph (Agilent Technologies) with an Omegawax 250 capillary column (30 m × 0.25 mm × 0.25 μm, Supelco) was utilized. The temperature for injection port and flame ionization detector was set to 250°C and 260°C, respectively. The carrier gas was helium with a flow rate of 1.2 mL/min and a split ratio of 1:100. The oven was initially set to 150°C and held for 2 min, then heated from 150°C to 220°C at a rate of 4°C/min and maintained for 30 min. According to their standards (PUFA No. 2-Animal Source, Supelco), fatty acids were identified.
Extraction of free amino acid (FAA) was conducted as previously described [11]. An amino acid analyzer (S433, Sykam) was used and the analytical condition was as follows: eluting solution: lithium citrate buffer (pH 2.9, 4.2, and 8.0), column: lithium-form resin (150 × 4.6 mm), column and reaction temperature: 37°C and 110°C, respectively, flow rate and analysis time: 0.45 mL/min and 120 min, respectively. The FAA contents were obtained from their respective standards.
A pilot study was conducted to establish the analytical condition for detecting hydrogen sulfide and trimethylamine in egg yolk, as these compounds are significant volatile organic compound (VOC) responsible for undesirable egg flavor. Interestingly, they were not detected in fresh egg yolk but identified in boiled samples. Therefore, we decided to analyze the VOC profiles of egg yolk using only boiled egg yolk. The extraction of volatiles was conducted using the headspace solid-phase micro-extraction as previously outlined [7]. An Agilent 8890 gas chromatograph with an Agilent 5977B mass spectrometer and a DB-5MS column (30 m × 0.25 mm × 0.25 μm, Agilent Technologies) were used. The analysis was operated under spitless conditions (250°C for 5 min) with helium as carrier gas and 1.3 mL/min as flow rate. The oven was initially set to 40°C for 5 min, then heated at a rate of 5°C/min to achieve 250°C and maintained for 5 min. The interface temperature was set to 280°C. The mass spectrometer operated in electron impact mode with an electron energy of 70 eV and a scan range of 30–300 m/z (scan rate: 4.37 scans/s, gain factor:1, resulting EM voltage:1,140 V). The temperature of the MS source and quadrupole was set at 230°C and 150°C, respectively. The identification of VOC and its aroma description was performed as previously described [7]. All identified VOCs and their corresponding aroma descriptors are provided as Supplementary Tables S1 and S2.
The data are presented as mean values with the standard SEM based on the following replicates: 30 replicates for egg quality traits; 15 replicates for proximate composition, pH, and fatty acid composition of yolk; 10 replicates for cholesterol content, antioxidant activity, and VOCs of yolk; and 5 replicates for FAA content of yolk. The results were processed statistically through SAS software (version 9.4, SAS Institute), using one-way analysis of variance and Duncan’s range test (p < 0.05). Multivariate analysis was performed using hierarchical cluster analysis (HCA), partial least squares-discriminant analysis (PLS-DA), and its variable importance in projection (VIP) scores. The MetaboAnalyst 5.0 software (https://www.metaboanalyst.ca/) was utilized for this purpose using log-transformation and auto-scaling.
RESULTS AND DISCUSSION
Significant differences were noted in the egg quality characteristics among the various KNC breeds (Fig. 1 and Table S3). As shown in Fig. 1A, the egg weigh of WRMD1E (59.38 g) and WRMD2E (58.30 g) was significantly heavier than that of CE (54.64 g) and BSE (55.05 g). Regarding egg length, WRMD1E exhibited the longest egg length (57.45), followed by WRMD2E (56.33), BSE (54.96), and CE (53.23), with statistical differences (p < 0.05).
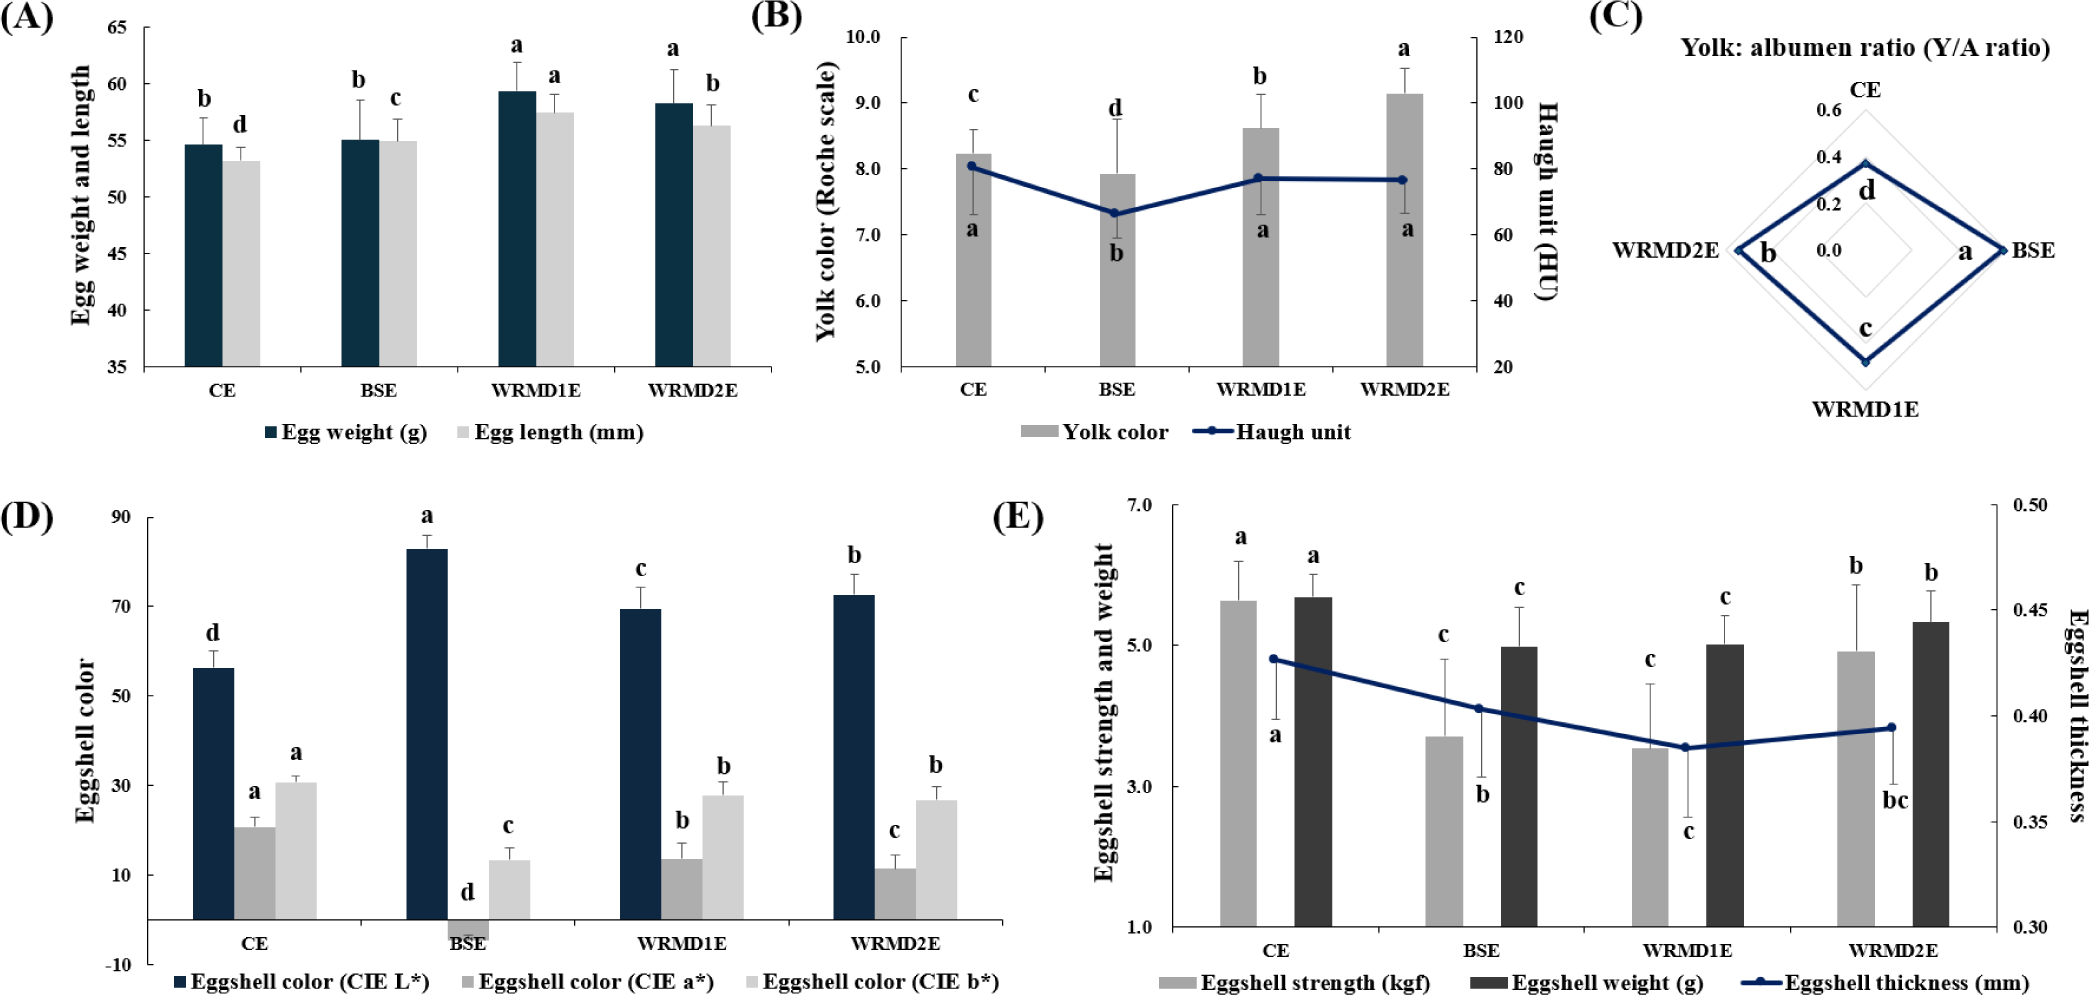
As illustrated in Fig. 1B, WRMD2E had the darkest yolk color (9.15), followed by WRMD1E (8.62), CE (8.23), and BSE (7.93), with significant differences (p < 0.05). HU is a measure used to evaluate internal egg quality by adjusting albumen height with egg weight and a higher HU indicates better quality and freshness [15]. A significantly lower HU was observed in BSE (66.20) compared to the other groups, with no significant differences observed between CE (80.33), WRMD1E (77.15), and WRMD2E (76.61). Similar findings were reported by Lordelo et al. [2] for Portuguese indigenous chicken varieties and commercial breeds. This phenomenon might be attributed to differences in bird genetics and environmental factors [21]. Many factors influencing the HU of eggs have been identified, including the hen’s age, strain or breed, dietary components, and potential diseases [22].
As demonstrated in Fig. 1C, the Y/A ratio of KNC eggs (0.48–0.59) was significantly higher than that of CE (0.37), which is consistent with an earlier observation [16]. Among the KNC eggs, BSE exhibited a significantly higher Y/A ratio (0.59), followed by WRMD2E (0.54) and WRMD1E (0.48; p < 0.05). Haunshi et al [23]. reported that a heavier egg weight is associated with a higher Y/A ratio. However, in this study, the smaller-sized BSE exhibited a significantly higher Y/A ratio compared to WRMD1E and WRMD2E. This result suggests that egg size does not always correlate with Y/A ratio. These contradictory findings could be due to differences in the genetic backgrounds of the chicken groups, which affect both the yolk and albumen composition. The literature has demonstrated that the compositional traits of eggs (e.g., albumen and yolk) are correlated with the heritability of the chicken breed [13,14]. Consistent with our findings, Tharrington et al. [24] found that as egg weight decreases, the proportion of yolk increases while the proportion of albumen decreases, leading to a higher Y:A ratio.
Eggshell color is an important factor affecting consumer purchasing decisions [6]. BSE exhibited the highest CIE L*-value (82.99), followed by WRMD2E (72.71), WRMD1E (69.53), and CE (56.30), with significant differences (p < 0.05; Fig. 1D). Commercial brown-egg lines have been selectively bred for dark-brown shells over many years, resulting in darker shell colors compared to native chicken lines. The bright color of native chicken eggs might be due to their distinct genetic background, considering the relatively high heritability of shell color [2]. CE exhibited a significantly higher CIE a*-value (20.74) than KNC eggs (–4.56 to 13.65). The relatively redder hues in CB eggs compared to KNC eggs are attributed to the red pigments in CB, such as protoporphyrin and uroporphyrin [5]. CE exhibited a significantly higher CIE b*-value (30.84) among groups, while both WRMD1E (27.90) and WRMD2E (26.82) resulted in similar CIE b*-value, surpassing those of BSE (13.38; p < 0.05). The CIE b*-value of eggshells positively correlates with the composition of several minerals, including Ca, Cu, Zn, and Al, present in eggshells [25].
As observed in Fig. 1E, CE exhibited significantly higher eggshell strength (5.64 kgf) than the other groups, whereas WRMD2E exhibited significantly greater eggshell strength (4.92 kgf) than BSE (3.72 kgf) and WRMD1E (3.53 kgf). CE exhibited a significantly thicker eggshell (0.43 mm) than KNC eggs (0.38–0.40 mm), which is supported by an earlier study [16]. Eggshell strength increased with an increase in eggshell thickness; however, BSE exhibited significantly lower eggshell strength than WRMD2E, although the eggshell thickness was similar. This finding suggests that eggshell strength might be influenced by factors other than just its thickness. It is well known that various factors, including eggshell thickness, mineral composition, and microstructure, can affect the mechanical endurance of eggshells [26]. Next, the eggshell weight of CE (5.69 g) was significantly heavier than that of KNC eggs, which was also reported in an earlier study [16]. Furthermore, WRMD2E had a significantly higher eggshell weight (5.33 g) than BSE (4.99 g) and WRMD1E (5.02 g), which was consistent with the trend observed for eggshell strength.
Moisture, crude protein, fat, and ash of egg yolk were 48.60%–50.76%, 16.03%–16.21%, 30.30%–31.51%, and 1.65%–1.86%, respectively (Table 1). These values are consistent with an earlier observation on CE and BSE yolk [5]. WRMD1E yolk showed significantly higher moisture than the others. In contrast, WRMD2E exhibited significantly lower yolk moisture than BSE. Compared to WRMD1E, crude fat and ash were significantly higher in BSE and WRMD2E, respectively. Our finding is slightly different from that of Lai et al. [27], who reported that crude fat and ash contents of hen egg yolk are 31.8%–35.5% and 1.1%, respectively.
WRMD1E exhibited a significantly higher pH value (6.29) than the other groups (6.12–6.21), while BSE exhibited a significantly higher pH value than CE and WRMD2E (Table 1). These results are inconsistent with a previous study, in which no significant differences in pH value were noted for CE and BSE [5]. Differences in the pH value of egg yolk from different chicken breeds may be due to their genetic diversity [28].
The cholesterol content of egg yolk was 9.06–10.06 mg/g (Table 1); this is consistent with earlier studies on egg yolk cholesterol content [6,29]. WRMD1E yolk exhibited significantly higher cholesterol levels than BSE and WRMD2E yolk. However, no significant differences in yolk cholesterol levels were observed between CE and BSE, BSE and WRMD2E, and CE and WRMD1E. KNC eggs generally contain a higher cholesterol content because of their larger Y/A ratio and heavier yolk than conventional hen eggs [16]. Nevertheless, not all KNC egg yolk exhibited high cholesterol content per gram compared with CE yolk. The overall amount of cholesterol in eggs often depends on multiple factors, such as breed differences and experimental and extraction conditions [5].
Antioxidant capacity determination using a single method is challenging owing to the complexity of food [10]; therefore, we conducted four different assays (Fig. 2). Regarding DPPH scavenging activity, WRMD2E yolk (60.67%) exhibited significantly higher levels than in the other samples. Furthermore, CE yolk (57.47%) showed significantly higher levels than WRMD1E yolk (54.27%), but did not differ significantly from BSE (55.84%). Previous studies revealed the DPPH scavenging activity of CE yolk (29%–35%) and BSE yolk (40.78%) [5,10]. However, these values are lower than our findings, which might be attributed to lyophilization affecting the accumulation of antioxidant components in egg yolk. Moving on to ABTS assay, the ABTS scavenging activity of egg yolk was 23.6%–26.3%; this is higher than that reported in previous studies on 18- and 30-wk-old commercial hen egg yolk (8.1%–13.0%) [10,30]. Lyophilization might have contributed to this difference, as discussed above. WRMD1E and WRMD2E yolk exhibited significantly higher ABTS scavenging activities than CE and BSE yolk. The mean DPPH scavenging activity (57.1%) was approximately 2.3 times higher than the ABTS scavenging activity (24.8%). This difference might be due to the distinct mechanisms of the DPPH and ABTS assays, with the involvement of organic and aqueous solvents, respectively [31]. We assumed that this results could be attributed to potential antioxidant candidates in the egg yolk with fat-soluble properties, such as phospholipids, carotenoids, and α-tocopherol.
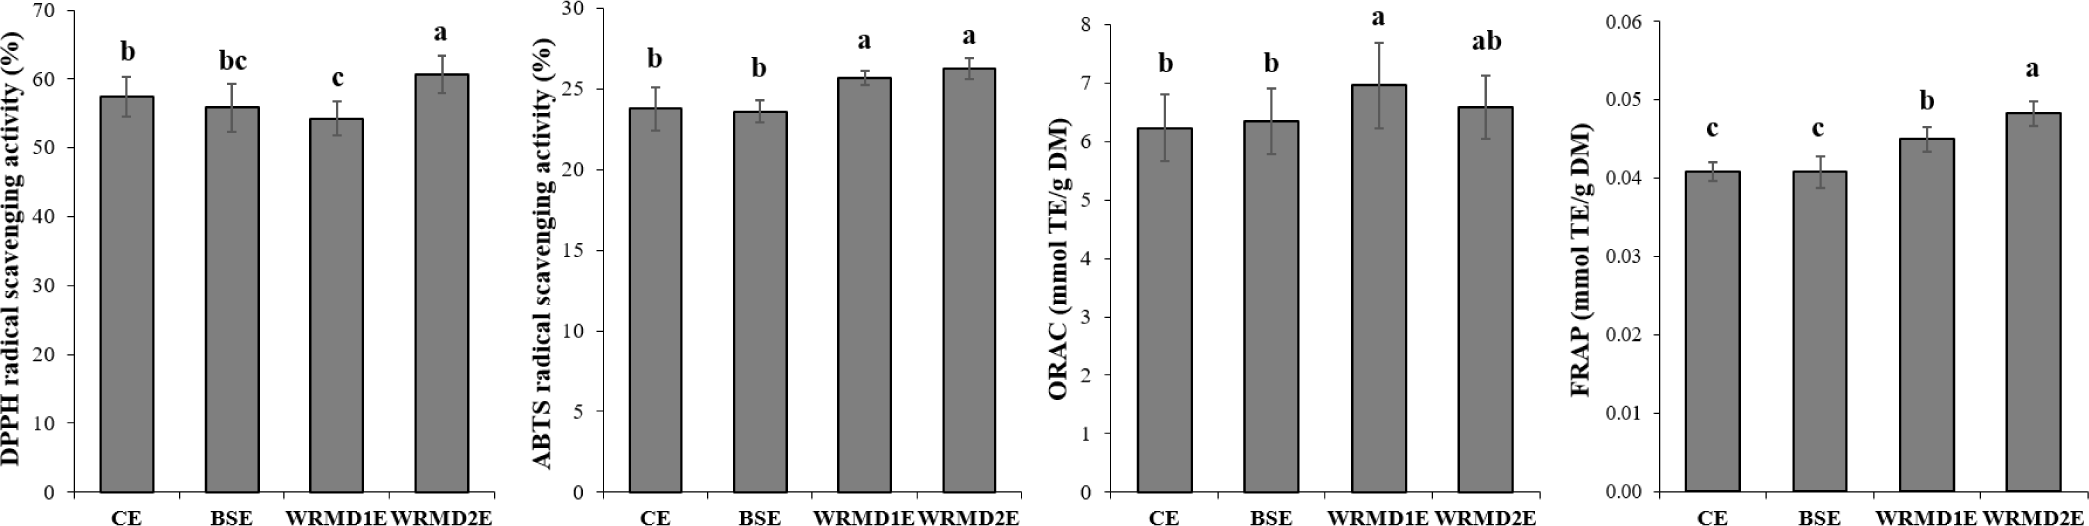
ORAC is a common analytical method in which a biologically relevant radical source is used and both inhibition degree and time of peroxyl radical-induced oxidation within a single quantity are considered [32]. WRMD1E yolk exhibited significantly higher ORAC value compared with CE and BSE yolk. However, the ORAC value of WRMD2E yolk did not significantly differ from that of the other groups. Next, the FRAP assay evaluates the ability of phenolics to convert ferric to ferrous based on the electron-donating activities of antioxidants [31]. WRMD2E yolk exhibited a significantly higher FRAP score than the other groups. Compared with WRMD1E yolk, both CE and BSE yolk exhibited significantly lower FRAP scores. These differences might be due to the presence of phosvitin, an antioxidant material in egg yolk that generally functions by chelating iron ions [33]. Interestingly, WRMD2E yolk exhibited substantial antioxidant capacity. Similarly, Liu et al. [34] discovered a substantial antioxidant capacity of Tibetan indigenous chicken egg yolk; this might be due to the abundance of antioxidant-associated candidate proteins, such as PIT 54 and glutathione-peroxidase 3. In the present study, the specific antioxidant-related compounds in KNC egg yolk were not investigated, suggesting the need for further research.
C18:1n9, C16:0, and C18:2n6 were identified as the predominant fatty acids, constituting approximately 84.5% of the total abundance (Table 2). This is similar to the findings reported in previous studies on egg yolk from commercial laying hens and Portuguese chicken [2,29,30]. C16:0 levels were significantly higher in CE yolk (32.46%) compared to the others (28.22%–30.01%) and significantly lower in WRMD2E yolk than in BSE yolk. Nevertheless, WRMD2E exhibited the highest yolk C18:1n9 levels (43.94%), followed by BSE (41.12%), WRMD1E (39.19%), and CE yolk (35.73%), with significant differences (p < 0.05). It can be suggested that WRMD2E exhibits a richer flavor, as C18:1n9 is one of the key compounds associated with organoleptic properties and contributes to the enhancement of egg yolk flavor [11]. Gao et al. [13] found a strong relationship between egg yolk flavor and the presence of C18:1n9 and C20:4n6, both of which amplify positive milky flavor. In contrast, C18:2n6 levels were the highest in CE yolk (18.03%), followed by WRMD1E (15.13%), BSE (13.93%), and WRMD2E yolk (10.79%), with significant differences (p < 0.05). C18:3n6 was identified as trace amounts (0.04%–0.12%), which is consistent with an earlier study [5]. C18:3n6 levels were the highest in WRMD1E yolk, followed by WRMD2E, BSE, and CE yolk (p < 0.05). Dietary C18:3n6 may reduce cardiovascular disease risk by converting to C20:3n6, which produces prostaglandin E1 and suppresses plaque formation [5]. C20:4n6 levels were significantly lower in CE yolk (1.73%) than in KNC egg yolk (2.23%–2.33%). KNC egg yolk may positively contribute to the organoleptic character of eggs because C20:4n6 is associated with the umami-related taste and milky flavor as discussed above [7,13]. C22:6n3 accounted for 0.08%–0.36% of total fatty acid abundance, which is relatively lower than the levels previously reported for CE/BSE and Portuguese indigenous chickens [2,5]. C22:6n3 levels were significantly higher in WRMD2E than in other groups. The proportions of total saturated fatty acid (SFA), monounsaturated fatty acid (MUFA), and polyunsaturated fatty acid (PUFA) were 38.25%–39.88%, 40.00%–47.65%, and 13.88%–20.12%, respectively. These values are slightly different from those of egg yolk from Portuguese chickens and hybrid hens, which might be due to genetic differences [2]. Total unsaturated fatty acid composition was significantly higher in KNC egg yolk than in CE yolk. Furthermore, PUFA and MUFA levels were markedly higher in CE yolk and WRMD2E yolk, respectively, than in the other groups. This might be due to the high proportions of C18:2n6 and C18:1n9, respectively. The ratio of PUFA/SFA (≥ 0.4–0.5 is recommended) is an indicator for evaluating the nutritional quality of meat fat [19]. The egg yolk generally matched the recommended ratio (0.44–0.51), except for WRMD2E yolk (0.36). In contrast, WRMD2E yolk exhibited a significantly higher MUFA/SFA ratio than the other groups. Consequently, we confirmed that differences in the individual and total egg yolk fatty acids are affected by the genetic diversity of chickens. This outcome is supported by Lordelo et al. [15], who identified various fatty acids, including C18:1n9 (34.9%–41.4%) and PUFA (19.6%–30.2%), in hen eggs. They also reported that egg fatty acids can be influenced by different housing systems, breeds, feed, and specialty eggs.
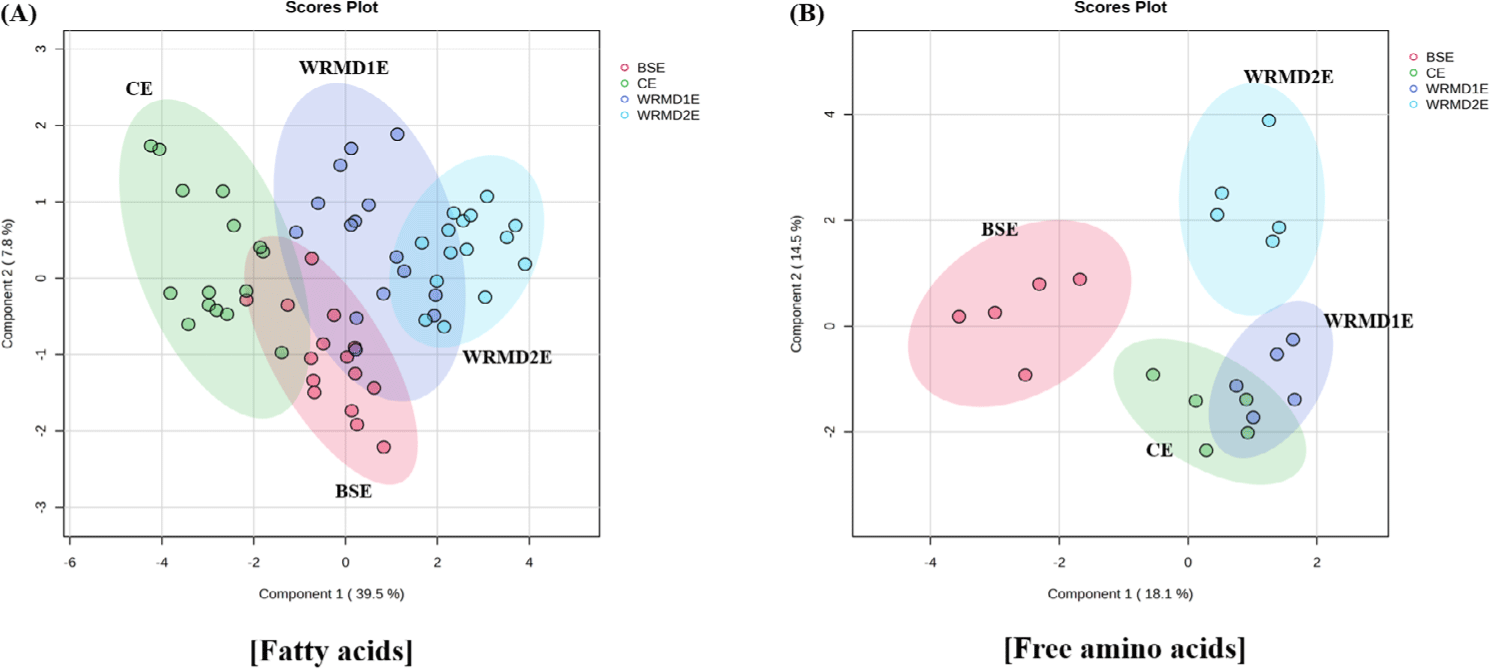
The yolk fatty acid profile of WRMD2E was clearly distinct from those of CE and BSE yolk, with some overlap with WRMD1E yolk, while CE, BSE, and WRMD1E yolk formed a slightly overlapping cluster (Fig. 3A). This suggests that different chicken breeds considerably influenced the fatty acid profile, though not to the extent of distinctly separating the clusters.
Twenty-one FAA were identified in egg yolk, with concentrations of 1,902.81–1,961.62 µg/g; however, the difference was insignificant. (Table 3). This range was lower than that reported in previous studies on white-shelled eggs and 25-wk-old Lohmann hen eggs [35,36] but higher than that on Japanese chicken eggs [14]. FAA indicate several taste attributes, such as bitter, sweet, salty, and umami, which are crucially responsible for egg yolk taste. Glutamic acid, leucine, and lysine were identified as the most abundant FAA, which was consistent with previous works on white/brown Leghorn and Japanese indigenous breeds [14,37]. Aspartic and glutamic acids are associated with strong umami taste, which are presented as umami score [11]. CE yolk had a significantly higher umami score than WRMD2E yolk; however, no significant difference was observed among KNC egg yolk. In particular, aspartic acid content was significantly higher in CE yolk than in KNC egg yolk, whereas no significant difference in glutamic acid content was observed. Goto et al. [14] reported a significantly higher aspartic acid content in egg yolk from commercial brown layer than in that from Nagoya chickens. They also reported that different chicken breeds affect glutamic acid content, which differs from our findings. Sulfur-containing FAA, including methionine and cysteine, can produce meat-like sweet flavor. A significantly higher level of cysteine was observed in BSE yolk compared to the other groups; however, no significant differences were observed for methionine. Phenylalanine and tyrosine can enhance the savory taste in the presence of acidic FAA [11]. Phenylalanine content was not significantly different between CE and KNC egg yolk; however, tyrosine content was significantly higher in CE yolk than in BSE yolk. Essential FAA accounted for approximately 43% of the total FAA; this is slightly lower than that reported previously (46%–47%) [35]. Although no significant difference in total essential FAA contents was confirmed, chicken breeds significantly affected the content of several essential FAA, such as threonine and valine.
As aromatic amino acids, both tyrosine and tryptophan can generate high antioxidant activities, as their structural characteristics are associated with phenolic acids and indole groups, respectively [35]. Tryptophan levels were significantly higher in BSE and WRMD1E yolk (26.49–26.58 µg/g) than in WRMD2E yolk (24.46 µg/g). Interestingly, the three types of antioxidant activities (DPPH, ABTS, and FRAP assay) of WRMD2E yolk were significantly higher than those of CE yolk (Fig. 2), even though no significant differences in tyrosine and tryptophan contents were observed between CE and WRMD2E yolk. Furthermore, the three types of antioxidant activities (ABTS, ORAC, and FRAP assay) of WRMD1E yolk were significantly higher than those of CE and BSE yolk. However, no statistically significant difference was observed in tyrosine and tryptophan contents in WRMD1E yolk compared to CE and BSE yolk (p > 0.05). In this study, the antioxidant activities of egg yolk might be affected not only by aromatic amino acids but also by various factors in egg yolk acting as antioxidants, such as vitamin A, vitamin E, carotenoids, and phospholipids [36].
The FAA profiles of BSE and WRMD2E yolk were clearly distinct from those of CE and WRMD1E yolk, as well as from each other, while CE and WRMD1E yolk clusters exhibited a slight overlap (Fig. 3B). This suggests that genetic differences in blue hen and Woorimatdag No. 2 chicken have a significant effect on their egg yolk FAA profiles. It has been reported that chicken breeds influence the distribution of FAA, potentially leading to variations in taste sensor traits in egg yolk [14].
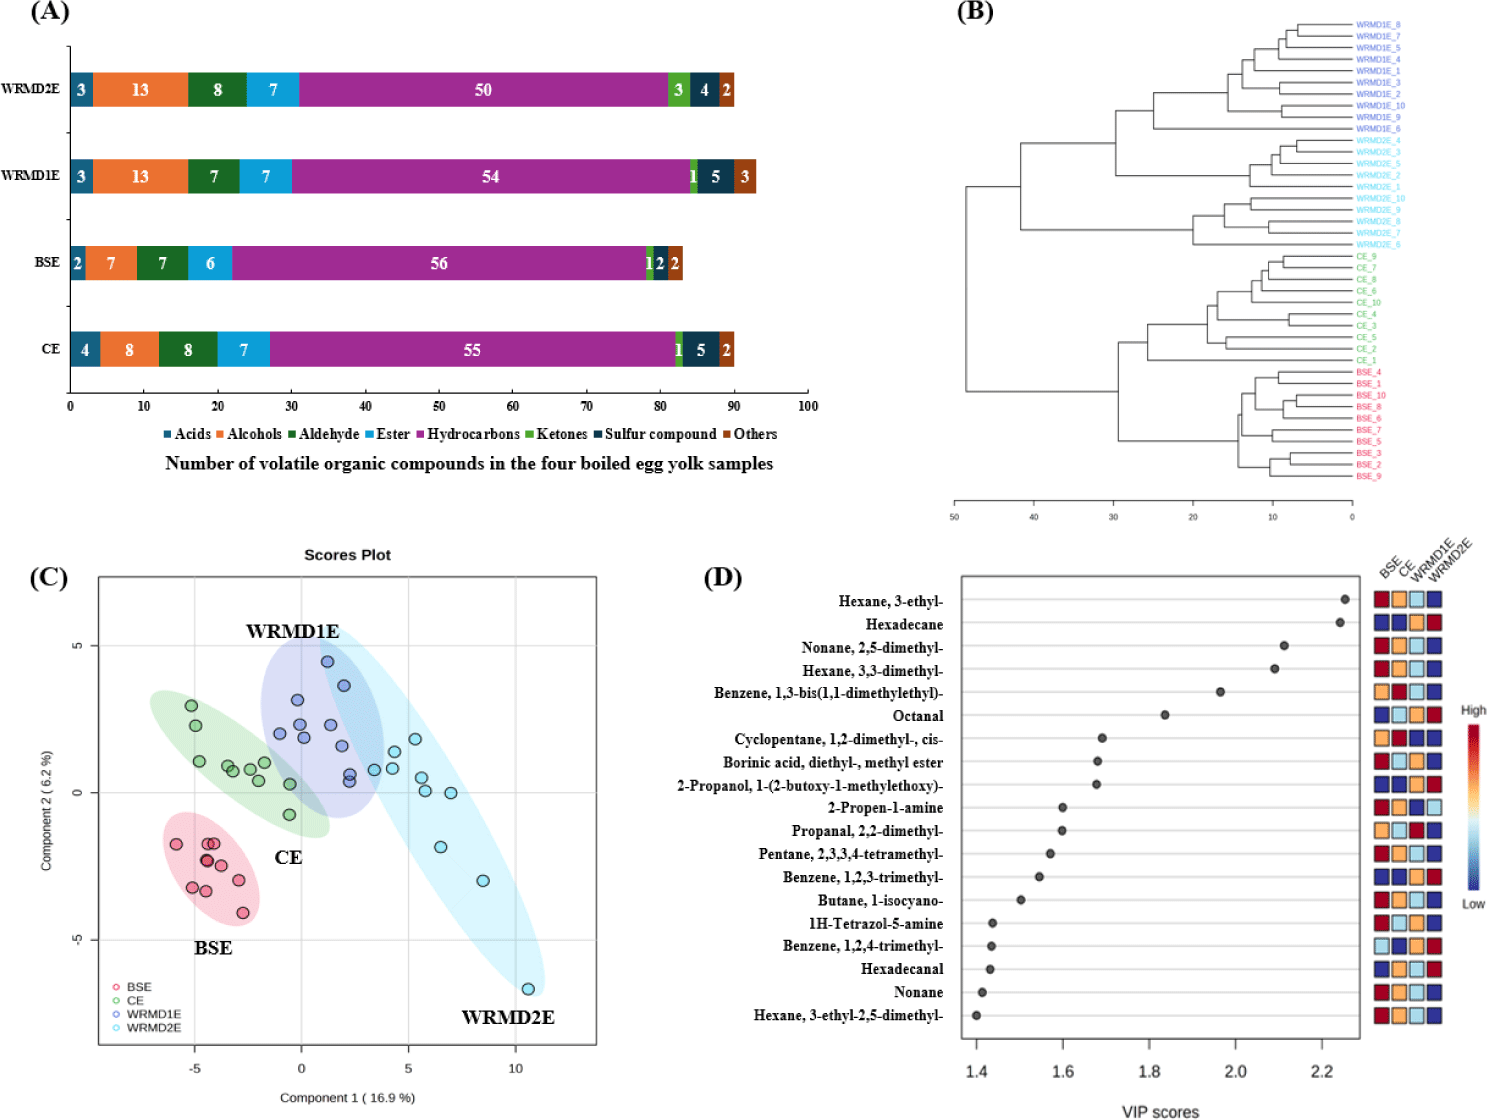
A total of 123 VOCs were identified and categorized as acids, alcohols, aldehydes, esters, hydrocarbons, ketones, and sulfur compounds (Table S1). Although the number of detected VOCs in WRMD2E yolk was similar to CE and WRMD1E, and higher than BSE, the total amount was significantly lower in WRMD2E than the other samples (Table 4 and Fig. 4A). This could be attributed to the increased antioxidant properties of WRMD2E yolk (Fig. 2), which play a crucial role in inhibiting oxidative decomposition of fatty acids, thereby influencing the formation of several VOCs, such as aldehydes and hydrocarbons [38]. Several VOC, such as 1-octen-3-ol, decanal, nonanal, octanal, D-limonene, and 2-pentylfuran, were also identified from heated egg yolk [39]. Acids normally originated from lipid oxidation or secondary degradation of oxidative products, such as hexanal [11]. Herein, total acids and octadecanoic acid were significantly higher in WRMD2E than in BSE and WRMD1E yolk. Further, total alcohols were significantly higher in WRMD2E yolk than in WRMD1E yolk. In contrast, total aldehydes were significantly higher in WRMD1E yolk, followed by BSE, CE, and WRMD2E yolk (p < 0.05). Lipid oxidation is responsible for the formation of aldehydes, thereby modifying egg flavor [40]. Propanal, 2,2-dimethyl- was the predominant aldehyde, accounting for 78.5%–97.3% of total abundances. 1-Octen-3-ol levels were significantly higher in CE and WRMD2E yolk than in WRMD1E yolk. The 1-octen-3-ol is a product of the enzymatic or non-enzymatic decomposition of omega-6 fatty acids, imparting mushroom odors, which are also present in fresh egg yolk [41]. Nonanal levels were significantly higher in the WRMD2E yolk than in BSE and WRMD1E yolk. Moreover, octanal content was significantly higher in CE, WRMD1E, and WRMD2E yolk than in BSE yolk. However, decanal was significantly lower in WRMD1E yolk than in CE and WRMD2E yolk. Octanal and nonanal belong to the pleasant aroma group [11]. In addition to decanal, they can also be generated by the oxidation of omega-9 fatty acids present in egg yolk [39]. Hexadecanal (cardboard-like off-odor compound), was isolated in trace amount from all egg yolk. It was significantly higher in WRMD2E yolk than the other groups. The Strecker degradation of yolk amino acids is responsible for generating benzeneacetaldehyde and 2-pentylfuran from boiled egg yolk [39]. Benzeneacetaldehyde levels were significantly higher in BSE and WRMD2E yolk than CE and WRMD1E yolk. Generally, no significant differences in 2-pentylfuran levels were observed between treatments, except for WRMD1E yolk, which had significantly lower levels than CE and WRMD2E yolk. Ren et al. [41] have reported that 1-octen-3-ol and 2-pentylfuran are the key off-odor volatiles isolated from thermal egg yolk at different temperatures.
LRI, linear retention index; m/z, mass to charge; VOC, volatile organic compound; ND, not detected. CE, commercial egg (Control); BSE, blue-shelled egg; WRMD1E, Woorimatdag No. 1 chicken egg; WRMD2E, Woorimatdag No. 2 chicken egg.
* Subtotal and total amounts of VOCs are given as the sum of each detected compounds listed in Supplementary Table S1.
Total ester content was significantly higher in WRMD1E yolk than the others. The most abundant ester was arsenous acid, tris(trimethylsilyl) ester (comprising as 74.9%–90.8% of the total ester), with WRMD1E yolk exhibiting significantly higher content, followed by WRMD2E, BSE, and CE yolk (p < 0.05). Differences in aldehydes and esters can impact on the formation of distinctive boiled egg yolk flavors, as they have low odor thresholds [42]. The VOC classified as hydrocarbons accounted for approximately 56% of the total identified VOC, comprising 53.78%–61.67% of total VOC concentration in yolk samples. The total hydrocarbon content was significantly lower in WRMD2E yolk than the other groups. Indole was only detected in CE (p < 0.05). Indole is partially responsible for the unpleasant pastoral odor that may not be preferred by some consumers [43]. As evidenced by Jung et al. [11], 2-ketones are important aroma contributors to meat. 2,3-Butanedione, characterized by its butter, caramel, and oily aroma, was significantly higher in BSE yolk than in WRMD1E yolk. (+)-2-Bornanone and 2-octanone levels were significantly higher in WRMD2E yolk than in CE and BSE yolk. Carbon disulfide content was significantly higher in WRMD1E than that in remaining samples. Disulfide species can impart a meaty aroma with an exceptional low odor threshold [42]. Excess hydrogen sulfide could originate from the decay process in boiled eggs, in which protein matter decomposes or is metabolized by microorganisms, thereby producing them as a key odorant for rotten egg flavor [44]. Herein, hydrogen sulfide levels were significantly higher in CE yolk (0.262 AU × 106), followed by WRMD1E (0.167 AU × 106), WRMD2E (0.102 AU × 106), and BSE (not detected), with significant differences (p < 0.05). Trimethylamine is a nitrogenous compound with an ammonia and fish odor that contributes to the flavor of decaying boiled eggs. Herein, trimethylamine levels were not significantly different among the groups (0.092–0.158 AU × 106). Consequently, our study reveals different VOC profiles in KNC egg yolk, suggesting that individual VOCs and their classes were influenced by genetic differences, might affect the distinct flavor of egg yolk.
To describe the similarities and differences of VOC, HCA was performed based on the Euclidian distance measure and Ward clustering algorithm [45]. In HCA, a larger distance between the sample clusters indicates a more significant difference in the VOC profiles. In the third stage of the hierarchy, CE and BSE clustered together, while WRMD1E and WRMD2E formed a cluster in the next stage of the hierarchy (Fig. 4B). Subsequently, both CE and BSE yolk and both WRMD1E and WRMD2E yolk exhibited similar VOC profiles and were named Group 1 and Group 2, respectively. These results suggest that the VOC profiles of Group 1 are markedly different from that of Group 2 [45]. To validate the clustering and identify the key markers distinguishing the different samples, the PLS-DA was performed (Fig. 4C). In the PLS-DA model, the sum of components 1 and 2 was 23.1% (correlation coefficient: 0.99; cross-validation correlation coefficient: 0.86). Based on the X-axis, CE and BSE were positioned below the zero point, whereas WRMD1E and WRMD2E were nearly above the zero point. This result suggests that the VOC profiles between CE and BSE, and WRMD1E and WRMD2E are relatively similar and distinctly different between Groups 1 and 2. VOC with high VIP scores (≥ 1.0) are considered markers for differentiating treatments [11]. Nineteen important VOCs (VIP ≥ 1.4) were screened, comprising 13 hydrocarbons, 3 aldehydes, 2 alcohols, and 1 ester (Fig. 4D). Among them, ten VOCs, including hexane, 3-ethyl- and nonane, 2,5-dimethyl-, were higher in Group 1 than in Group 2. In contrast, five VOCs, including hexadecane and octanal, were found at higher levels in Group 2 than in Group 1. As mentioned above, almost all compounds in Group 1 or Group 2 belonged to hydrocarbons, whereas some were alcohol and aldehyde. This suggests that the differences in the VOC profiles of egg yolk might be due to lipid degradation, as lipid oxidation is a major pathway responsible for hydrocarbons, alcohols, and aldehydes formation [11].
CONCLUSIONS
This study clearly indicated the impact of genetic differences of KNC on the physicochemical quality, antioxidant activity, and flavor characteristics of egg yolk, with a particular focus on Woorimatdag chicken lines. The egg quality tratis, including HU, yolk color, Y/A ratio, and eggshell traits, were significantly dependent on their genetic differences. Interestingly, Woorimatdag chicken egg yolk exhibited substantial antioxidant activities, as demonstrated by DPPH, ABTS, and FRAP assays for WRMD2E and the ORAC assay for WRMD1E compared to yolk of CE and BSE. In terms of taste and aroma, KNC egg yolk had higher proportions of C18:1n9, C20:4n6, and C18:3n6 compared to CE yolk; however, it contained less umami-related aspartic acid than CE yolk. The primary VOC in boiled egg yolk included 1-octen-3-ol, benzeneacetaldehyde, decanal, nonanal, carbon disulfide, 2-pentylfuran, and trimethylamine. The proportion and abundance of VOCs were species-dependent: WRMD2E yolk contained fewer aldehydes and hydrocarbons compared to the other groups, whereas WRMD1E yolk exhibited higher levels of esters and aldehydes. In conclusion, eggs from KNC lines indicated comparable quality to commercial eggs, with WRMD2E yolk showing notable strengths in antioxidant capacity and organoleptic fatty acids. Several VOCs with high VIP scores, such as hexane, 3-ethyl-, and hexadecane, may warrant further investigation as potential volatile-markers for discriminating boiled egg yolk of various chicken breeds. Our findings contribute to a deeper understanding of KNC egg characteristics, which could support the sustainable use and conservation of native chicken biodiversity.