INTRODUCTION
The phenomenon of “pet humanization,” where companion animals are treated as family members or close companions, has gained significant attention in urban households [1]. In 2020, pet-related expenditures in the United States reached $10.36 billion, with approximately 67% of households owning a pet during the same year [2]. In Korea, an estimated 6.04 million households, representing 11.6 million individuals, owned companion animals, with an average monthly expenditure of 110,000 KRW ($97) on food and veterinary care [3].
Advancements in vaccinations, dietary practices, and environmental conditions have extended the lifespan of companion dogs, leading to a rise in age-related conditions such as degenerative joint arthritis, a common chronic joint disease in older dogs [4]. As a result, interest in functional foods designed to support joint health in dogs has grown, reflecting the broader trend of pet humanization, where pet health is given similar priority to human health [5].
Milk proteins are widely recognized as functional ingredients due to their diverse health benefits, such as promoting muscle development, reducing inflammation, and exhibiting free radical scavenging activity [6]. Key examples include casein-derived casein phosphopeptide (CPP) and whey protein hydrolysate, both known for their ability to enhance calcium absorption and support musculoskeletal health. Whey proteins, which contain bioactive components including lactoferrin, β-lactoglobulin, and α-lactalbumin, are particularly notable for promoting bone formation and improving metabolic processes [7,8]. Hydrolysis of whey proteins through enzymatic methods or fermentation with lactic acid bacteria (LAB) produces peptides with enhanced functional properties [9]. While enzymatic hydrolysis is effective, its high production costs present challenges [10]. Alternatively, LAB fermentation offers a more cost-effective approach, with additional advantages such as better palatability and improved sensory qualities [11].
This study aims to isolate LAB from canine feces and utilize them to produce specific bioactive peptides from whey proteins. By exploring their biochemical properties, this research aimed to develop functional peptides tailored to the unique health needs of dogs, contributing to advancements in companion animal nutrition.
MATERIALS AND METHODS
LAB was isolated from dog feces collected from a Border Collie (2 years, Sex: Male, Nutritional status: Normal). Fecal samples (10 mL) were mixed with 40 mL of PBS (pH 7.4) and thoroughly vortexed for homogenization. A 1 mL portion of the homogenized sample was serially diluted using sterile 0.85% saline, and 100 μL from each dilution was plated onto De Man-Rogosa-Sharpe (MRS) agar (BD Difco) supplemented with 0.02% sodium azide. The inoculated plates were then incubated at 37°C for 48 hours. LAB colonies that appeared on the plates were selected and transferred into MRS broth to prepare stocks. All cultures were preserved at –72°C in MRS broth with 20% glycerol for long-term storage.
The selected strains were evaluated based on their colony shape, microscopic morphology, and Gram staining results. Additional analysis was performed through 16S-rRNA gene sequencing, and the obtained sequences were aligned and compared to those registered in the GenBank database (Macrogen).
The ability of selected LAB strains to withstand acidic and bile conditions was assessed following the method of [12]. For acid tolerance, LAB cultures were incubated in MRS broth (BD Difco) at 37°C for 2 hours after adjusting the pH to 1.0, 1.5, and 2.5 using 1.0 N HCl (Sigma-Aldrich). The number of surviving colonies was determined by plating on BCP agar (BD Difco) and incubating at 37°C for 48 hours. For bile tolerance assessment, LAB strains were transferred to MRS broth supplemented with 0.3% oxgall (BD Difco) and incubated at 37°C for 24 and 48 hours. Viability was measured using the same plating method, and colony-forming units (CFUs) were enumerated to determine the survival rate.
Proteolytic activity was assessed following the method described by [13], with minor modifications with minor modifications. The selected LAB strains were screened for proteolytic activity using an agar-well diffusion assay on skim milk agar containing 2.0% (w/v) agar (BD Difco). After centrifugation at 5,000×g for 10 minutes using a Microfuge 20R (Beckman Coulter), 100 µL of the supernatant was transferred into 9 mm-diameter wells on the skim milk agar plates. Proteolytic activity was determined based on the formation of clear zones around the wells, indicating enzymatic hydrolysis of milk proteins. The diameters of these clear zones were measured every 24 hours for up to 72 hours of incubation at 37°C in a Heratherm incubator (Thermo Fisher Scientific) to evaluate protease activity.
The β-galactosidase activity was determined following the method outlined by [14], with slight modifications. Specifically, 1 mL of bacterial culture was mixed with 50 mL of 0.1 M phosphate buffer (Sigma-Aldrich) containing 0.001 M magnesium sulfate (MgSO₄; Sigma-Aldrich) and 0.05 M β-mercaptoethanol (Sigma-Aldrich). To this solution, two drops of chloroform (J.T. Baker) and one drop of 1% (w/v) sodium dodecyl sulfate (SDS; Sigma-Aldrich) were added to 1 mL of the diluted sample. The mixture was vortexed for 10 seconds using a Vortex-Genie 2 (Scientific Industries) and incubated in a water bath (Thermo Fisher Scientific) at 28°C for 5 minutes. Next, 0.2 mL of a 4 mg/mL solution of o-nitrophenyl-β-D-galactopyranoside (ONPG; Sigma-Aldrich) was added, followed by vortexing for 10 seconds. The enzymatic reaction catalyzed by β-galactosidase was stopped after 10 minutes by adding 0.5 mL of 1 M sodium carbonate (Na₂CO₃; Sigma-Aldrich). The mixture was then centrifuged at 15,000×g for 15 minutes using a Sorvall Legend X1R centrifuge (Thermo Fisher Scientific), and the optical density was measured at 420 nm using a Multiskan EX355 Microplate reader (Thermo Fisher Scientific). Enzyme activity was calculated using the following formula:
where t, v, and A420 denote reaction time (min), sample volume (mL), and absorbance (420 nm), respectively.
Whey protein concentrate (WPC; 80% protein) was sourced from Hilmar™, with its chemical composition provided by the manufacturer (Table 1). To prepare the solution, WPC (Hilmar™) was mixed with distilled water to reach a final concentration of 7% (w/v). To enhance the proliferation of LAB, glucose (3% w/v, Sigma Aldrich) was subsequently incorporated. The pH of the mixture was then regulated to the optimal level for LAB activity using 1 N NaOH (Sigma Aldrich). The solution was then sterilized by heating at 65°C for 30 minutes. After heat treatment, the whey protein solution was stored at 4°C and used within 1 week.
| Sample | Protein (%) | Moisture (%) | Fat (%) |
|---|---|---|---|
| HilmarTM 8000 WPC | 81.88 | 4.30 | 6.70 |
The degree of hydrolysis (DH) of the WPC solution in fermented samples was assessed every 4 hours for six intervals using the 2,4,6-trinitrobenzenesulfonic acid (TNBS) method [15]. The TNBS reagent was prepared by dissolving 0.1% (w/v) TNBS (Sigma-Aldrich) in distilled water. All samples and standard solutions were made with 1% (w/v) SDS (Sigma-Aldrich). To prepare the samples, 2 mL of the solution was diluted in distilled water at a 10% (v/v) concentration in a test tube, followed by the addition of 4 mL of 0.72 N TCA (Samchun Chemical). The samples were incubated at 25°C for 20 minutes. A 0.2 mL aliquot of each sample was then filtered using a sterile syringe filter (0.45 μm PVDF, SIGL) and transferred into a test tube containing 2 mL of 0.2125 M sodium phosphate buffer (pH 8.2, Sigma-Aldrich). Subsequently, 2 mL of TNBS reagent was added, and the mixture was incubated in the dark at 50°C for 60 minutes. The reaction was terminated by adding 4 mL of 0.1 N hydrochloric acid (HCl; Sigma-Aldrich) to each tube, and the samples were allowed to cool to room temperature for 30 minutes.
Absorbance was measured at 420 nm using a Multiskan EX355 microplate reader (Thermo Fisher Scientific). The DH was calculated as follows [16]:
where hs is the A - N content of the fermented WPC, htot is the A - N content after acid hydrolysis (6 N HCl, 110°C, 24h) of the sample, and h0 is the A - N content of sample its self. All values are calculated using L-leucine as the standard substance.
Sodium dodecyl sulfate-polyacrylamide gel electrophoresis (SDS-PAGE) was conducted to analyze the peptide profile of the fermented whey protein concentrate. Using 12% acrylamide gels (Bio-Rad) and the Mini-Protean Tetra Electrophoresis System (Bio-Rad), the molecular weights of the peptides were estimated according to the method described by [17]. Protein bands were visualized using Coomassie Brilliant Blue R-250 (Bio-Rad) staining, with molar mass standards provided by Precision Plus Protein Dual Xtra Standards (Bio-Rad).
Peptide fractions from fermented WPC were obtained through gel filtration using a preparative chromatography system (Waters). The setup included a Waters W600 Preparative Liquid Chromatography system, a Waters Preparative Pump, a Waters W717 Autosampler, and a Waters Dual λ Absorbance Detector (W2487). For the initial purification, fermented WPC was dissolved in 50 mM sodium phosphate buffer (pH 7.0) supplemented with 0.15 M NaCl (Sigma Aldrich). The resulting solution was filtered using a 0.45 μm PVDF syringe filter (SIGL) to remove particulates. The sample was then applied to a Hiprep 16/60 Sephacryl S-100 HR column (GE Healthcare Life Sciences) and eluted at a constant flow rate of 1 mL/min. Absorbance was monitored at 280 nm. Collected fractions were stored at –20°C for further analysis (Table 2).
ABTS radical scavenging activity was assessed by first preparing a 7 mM ABTS solution in ethanol (Samchun Chemical) using ABTS powder (Sigma-Aldrich). To generate the ABTS•⁺ radical solution, the ABTS stock was mixed with 2.45 mM potassium persulfate (Sigma-Aldrich) in a 1:1 (v/v) ratio and incubated at ambient temperature in the dark for 12–16 hours. The resulting ABTS•⁺ solution was diluted with ethanol to achieve an absorbance of 0.70 ± 0.02 at 734 nm, measured using a Multiskan EX355 microplate reader (Thermo Fisher Scientific). For the assay, 190 μL of the diluted ABTS•⁺ solution was added to 10 μL of each sample fraction in a 96-well plate (SPL Life Sciences). After 3 minutes of reaction time, absorbance at 734 nm was measured, and antioxidant activity was expressed as Trolox equivalent antioxidant capacity (TEAC) in mM/L.
The DPPH free radical scavenging activity was determined using the method described by [18] with slight modifications. For the experiment, a DPPH solution (0.2 mM) was prepared by dissolving 2,2-Diphenyl-1-picrylhydrazyl along with 2,4,6-tripyridyl-s-triazine (Sigma Aldrich) in ethanol. This solution was then mixed with fermented WPC samples in equal volumes (1:1, v/v), followed by incubation in the dark at room temperature for 30 minutes. After the reaction, absorbance was recorded at 570 nm, and the antioxidant capacity was quantified as ascorbic acid equivalents (mM), using ascorbic acid (Sigma Aldrich) as the standard.
The ferric reducing antioxidant power (FRAP) assay was performed according to the method described by [19]. The FRAP solution for the experiment was prepared as follows: A 300 mM acetate buffer was made by mixing Sodium acetate trihydrate (Sigma Aldrich) with Acetic acid (J.T Baker). A 10 mM TPTZ solution was created by dissolving 2,4,6-tri(2-pyridyl)-1,3,5-triazine (Sigma Aldrich) into 40 mM HCl (DAEJUNG). Additionally, a 20 mM Iron(III) chloride hexahydrate solution was prepared by dissolving Iron(III) chloride hexahydrate 97% A.C.S reagent (Sigma Aldrich) in ethanol (Samchun Chemical). These three solutions were mixed in a 10:1:1 (v/v) ratio. For the assay, 1.5 mL of the FRAP solution, preheated to 37°C, was combined with 50 μL of fermented WPC fraction samples or standard solutions. The mixture was vortexed and allowed to react at room temperature in a dark room. Absorbance was measured at 593 nm, and the results were expressed as Ascorbic acid (Sigma Aldrich) equivalent capacity in mM. The protein concentration of all fermented WPC fraction samples was adjusted to 200 μg/mL.
In the experiment calcium solubilization capacity was measured with slight modifications to the methods reported by [20,21], focusing on the degree of precipitation following calcium phosphate formation. A 10 mM calcium chloride solution (Sigma Aldrich) and a 20 mM sodium phosphate buffer were first prepared. Subsequently, each fermented WPC fraction sample (0.5 mL) was mixed with an equal volume (0.5 mL) of the calcium chloride solution, followed by the addition of 1.0 mL of 20 mM sodium phosphate buffer to the resulting mixture. The solution was incubated at 37°C for 2 hours and subsequently centrifuged at 2,000×g for 30 minutes at 25°C to remove the precipitated insoluble calcium phosphate. Calcium levels were quantified using a calcium colorimetric assay kit (Bioassay Systems), analyzing both the complete reaction mixture and the supernatant obtained after centrifugation. For the colorimetric measurement, 10 μL of each sample (i.e., unseparated mixture and centrifuged supernatant) was transferred into a 96-well microplate, followed by the addition of 90 μL of chromogenic reagent and 60 μL of calcium assay buffer. The mixture was allowed to react in the dark at room temperature for 5 minutes, after which absorbance was measured at 570 nm. Calcium concentration was determined using the first equation described below, and the calcium solubilization capacity was calculated using the second. All fermented whey protein concentrate fractions were adjusted to a uniform protein concentration of 2.0 mg/mL prior to testing.
RAW 264.7 cells were maintained in Dulbecco’s modification of Eagle’s medium (DMEM) supplemented with 10% heat-inactivated FBS at 37°C in a 5% CO2 atmosphere. The medium was replaced every two days. To assess cell protection, RAW 264.7 cells were seeded into 96-well plates at a density of 1 × 10⁵ cells/mL (100 μL per well) for nitric oxide production inhibition and cell viability assays.
Cell viability was assessed using the MTT assay, following the protocols outlined by [22,23]. RAW 264.7 cells were seeded into 96-well plates and allowed to adhere for 24 hours. After the culture medium was removed, cells were treated with various concentrations of the fraction samples diluted in serum-free medium and incubated for an additional 24 hours. Following this treatment, MTT solution (5 mg/mL) was added to each well, and the cells were incubated for 3 hours at 37°C in a 5% CO₂ atmosphere. After incubation, the supernatant was carefully discarded, and the formazan crystals, produced by metabolically active cells, were solubilized using DMSO. Absorbance was recorded at 540 nm with a microplate reader (Bio-Tek Instruments) to evaluate cell viability. The viability percentage was determined by comparing the absorbance values of the treated groups to that of the untreated control group, which was considered to have 100% viability.
Nitric oxide (NO) levels were determined as nitrite using the Griess reaction, based on the method outlined by [11]. RAW 264.7 cells were incubated in serum-free medium with different concentrations of fraction samples for 2–3 hours after removing the existing medium. Subsequently, lipopolysaccharide (LPS; 100 ng/mL) was added in an equal volume of serum-free medium, and the cells were incubated for 20 hours to induce stimulation. Following this, 0.1 mL of the reaction mixture was collected and placed into a 96-well microplate, where Griess reagent was added. The mixture was allowed to react in the dark at room temperature for 15 minutes, and absorbance was measured at 540 nm. NO scavenging activity was calculated as a percentage, comparing the absorbance at 540 nm of the samples to that of the blank experiment.
RAW 264.7 cells were seeded into 96-well plates and cultured for 24 hours. Once the medium was removed, the cells were exposed to different concentrations of fraction samples prepared in serum-free medium and incubated for an additional 2–3 hours. Subsequently, LPS (100 ng/mL) was added using the same volume of serum-free medium to stimulate the cells for 20 hours. After incubation, the supernatants were collected, and cytokine levels (IL-1α, IL-6, and TNF-α) were quantified using a mouse enzyme-linked immunosorbent assay (ELISA) kit (Komabiotech) based on the ELISA method. Absorbance was measured at 450 nm.
The amino acid composition of the purified fraction was analyzed following the procedure outlined by [24]. Fractions that demonstrated strong bioactivity were further examined via high-performance liquid chromatography (HPLC), employing the method reported by [25]. Amino acid separation was carried out on an AccQ-Tag™ column (3.9 × 150 mm; WAT052885, Waters) with a two-eluent system. Sample derivatization was performed using the Waters AccQ-Tag∙Fluor reagent kit. Samples were hydrolyzed in 6 N hydrochloric acid (HCl) 5 mL in sealed test tubes at 110°C for 24 hours. The hydrolysate was dried in an oven at 75°C, reconstituted in 1 mL of triple-distilled water, and filtered through a 0.22 μm sterile syringe membrane filter (SIGL). For derivatization, 10 μL of the filtrate was mixed with 70 μL of AccQ∙Flour borate buffer and 20 μL of AccQ∙Fluor reagent (3 mg/mL in acetonitrile), vortexed for 5 seconds, and incubated at 55°C for 10 minutes in a heating block. The column temperature was maintained at 37°C during the analysis, with a flow rate of 1 mL/min. Fluorescence detection was conducted at an excitation wavelength of 250 nm and an emission wavelength of 395 nm. An automatic amino acid analyzer (Waters) with a Waters 717 autosampler was used for the analysis. The mobile phases consisted of (A) AccQ-Tag eluent A (prepared by mixing 100 mL of AccQ-Tag A concentrate [WAT052890, Waters] with 900 mL of triple-distilled water and adjusting to pH 5.02 using phosphoric acid) and (B) 60% (v/v) acetonitrile (HPLC grade, Thermo Fisher Scientific) in triple-distilled water. Calibration was performed using amino acid standards (Sigma-Aldrich), with sample amounts ranging from 0.02 to 0.08 μg (20–1,000 pmol). The gradient program used for analysis is presented in Table 3, and additional parameters are detailed in Table 4. Before starting the gradient, the column was equilibrated with 100% mobile phase A for 10 minutes. After completing the analysis, the column was washed with triple-distilled water for 30 minutes and conditioned with mobile phase B for 15–20 minutes.
| Time (min) | % A | % B | Curve |
|---|---|---|---|
| 0.00 | 100 | 0 | 6 |
| 0.5 | 98 | 2 | 6 |
| 15.0 | 93 | 7 | 6 |
| 19.0 | 90 | 10 | 6 |
| 32.0 | 67 | 33 | 6 |
| 33.0 | 67 | 33 | 6 |
| 34 | 0 | 100 | 6 |
| 37 | 0 | 100 | 6 |
| 38 | 100 | 0 | 6 |
The fraction sample was examined using liquid chromatography-tandem mass spectrometry (LC-MS/MS) with a Vanquish UHPLC system (Thermo Fisher Scientific) connected to a Q Exactive Plus mass spectrometer (Thermo Fisher Scientific) at Proteinworks. Detailed analytical parameters are outlined in Tables 5 and 6.
| Mobile phase/time (min) | Solvent composition | |
|---|---|---|
| A (%)1) | B (%)1) | |
| 0 | 98 | 2 |
| 2.0 | 98 | 2 |
| 25.0 | 80 | 20 |
| 30.0 | 50 | 50 |
| 31.0 | 2 | 98 |
| 36.0 | 2 | 98 |
| 37.0 | 98 | 2 |
| 45.0 | 98 | 2 |
RESULTS
LAB was isolated from dog feces collected from various dogs. Colonies were observed on MRS agar plates after being subcultured three times at 37°C for 18 to 24 hours. The samples were then stored at –72°C in a mixture of MRS broth and 20% glycerol.
The morphological characteristics of the isolated LAB strains were examined microscopically. Various microorganisms were observed, and all strains were confirmed to be Gram-positive. Seven strains were identified through 16S-rRNA sequencing. Based on the 16S-rRNA sequence analysis, the lactic acid-producing strains were classified as four strains of Lactobacillus acidophilus, one strain of Enterococcus faecalis, one strain of Lactiplantibacillus plantarum, and one strain of Lacticaseibacillus paracasei. The 16S-rRNA gene sequences are detailed in Table 7. After excluding Enterococcus faecalis D4, identified as a potentially harmful intestinal bacterium, the remaining isolated strains were named as follows: Lactobacillus acidophilus D2, D3, D5, and D6; L. plantarum D7; and Lacticaseibacillus paracasei D8.
The ability of LAB strains to survive in artificial gastric juice was evaluated. The selected LAB strains were incubated in the artificial gastric environment for 2 hours, after which viable cell counts were determined before and after treatment using BCP agar. In dogs, the gastric transit time is approximately 120 minutes, with gastric pH ranging from 0.9 to 2.5 and an average of 1.5 [26]. To replicate these conditions, the pH was set to 1.0, 1.5, and 2.5, and an incubation time of 120 minutes at 37°C was used to simulate transit time. The LAB strains showed excellent tolerance under these simulated gastric conditions (Table 8). These results are consistent with the findings of [27], who indicated that probiotic strain tolerance during gastrointestinal passage varies depending on the strain. In addition to gastric tolerance, resistance to intestinal bile salts is a critical criterion in selecting probiotics. A simulated digestive model was employed for in vitro assessment, in which LAB strains were treated with artificial gastric fluid for 2 hours at 37°C. After treatment, viable cells were enumerated to assess their resistance to artificial bile components. The findings revealed that the LAB strains exhibited high survivability under bile salt conditions (Tables 9 and 10).
The proteolytic activity of the bacterial strains was assessed by their ability to produce clear zones on skim milk agar, following the method described by [28]. Using the agar well diffusion technique, it was observed that all seven screened LAB strains demonstrated the capacity to hydrolyze milk proteins. Clear zones were detected around the wells for six of the strains, confirming their proteolytic activity. Among these, L. plantarum D7 exhibited the highest level of proteolytic activity, with a clear zone diameter exceeding 26 mm on skim milk agar (Table 11). These findings identify L. plantarum D7 as the most efficient strain for proteolytic activity among the strains tested.
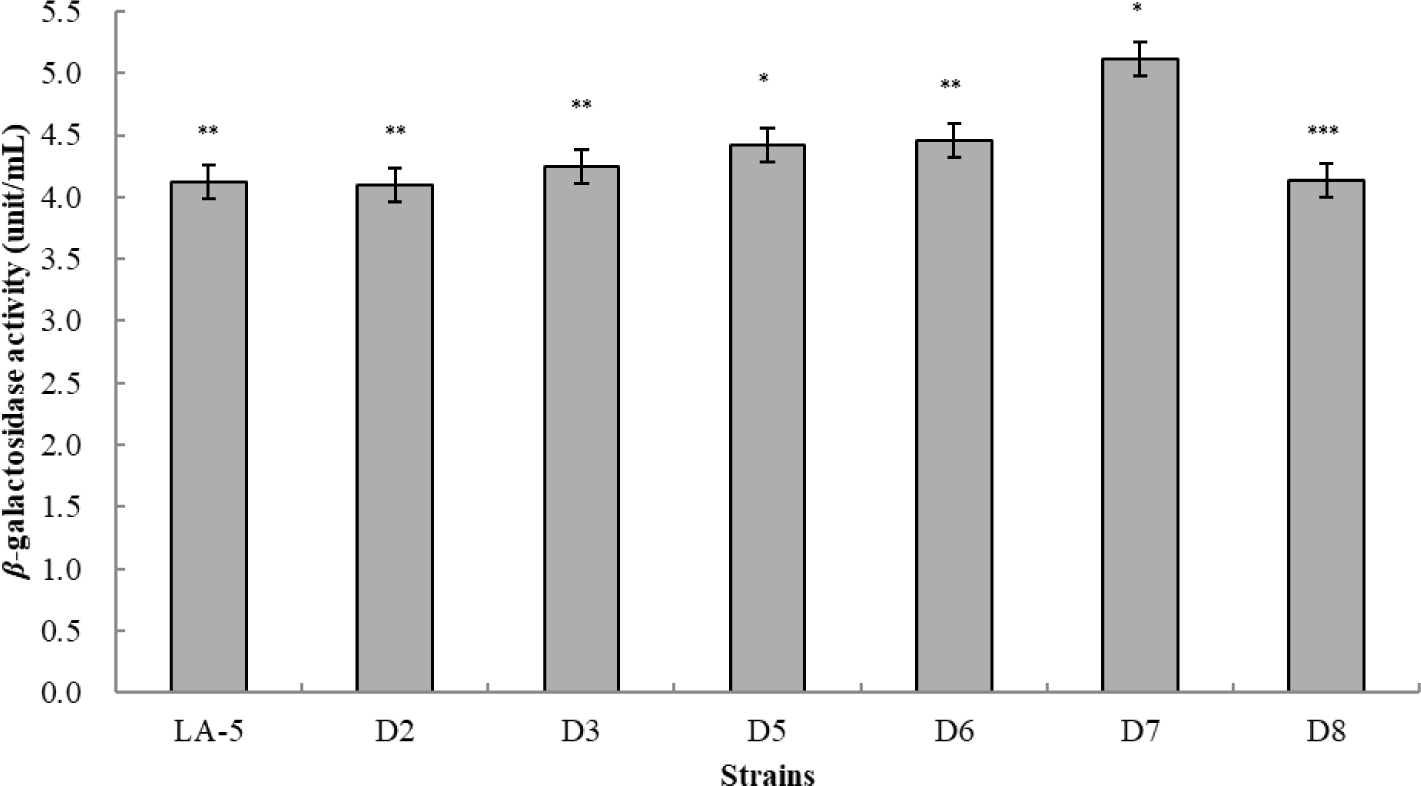
β-Galactosidase is an essential enzyme responsible for lactose hydrolysis, contributing significantly to improved lactose digestion and the conversion of lactose into short-chain fatty acids, which offer various health benefits to the host [29,30]. The activity of β-galactosidase was found to be strongly influenced by enzyme production within the cells, which varied depending on the type of carbohydrate and the availability of nitrogen sources in the medium. Among the tested strains, Lactobacillus acidophilus D3, D5, D6, and L. plantarum D7 demonstrated the highest levels of β-galactosidase activity, as presented in Fig. 1. These findings emphasize the potential of these strains for applications requiring effective lactose hydrolysis.
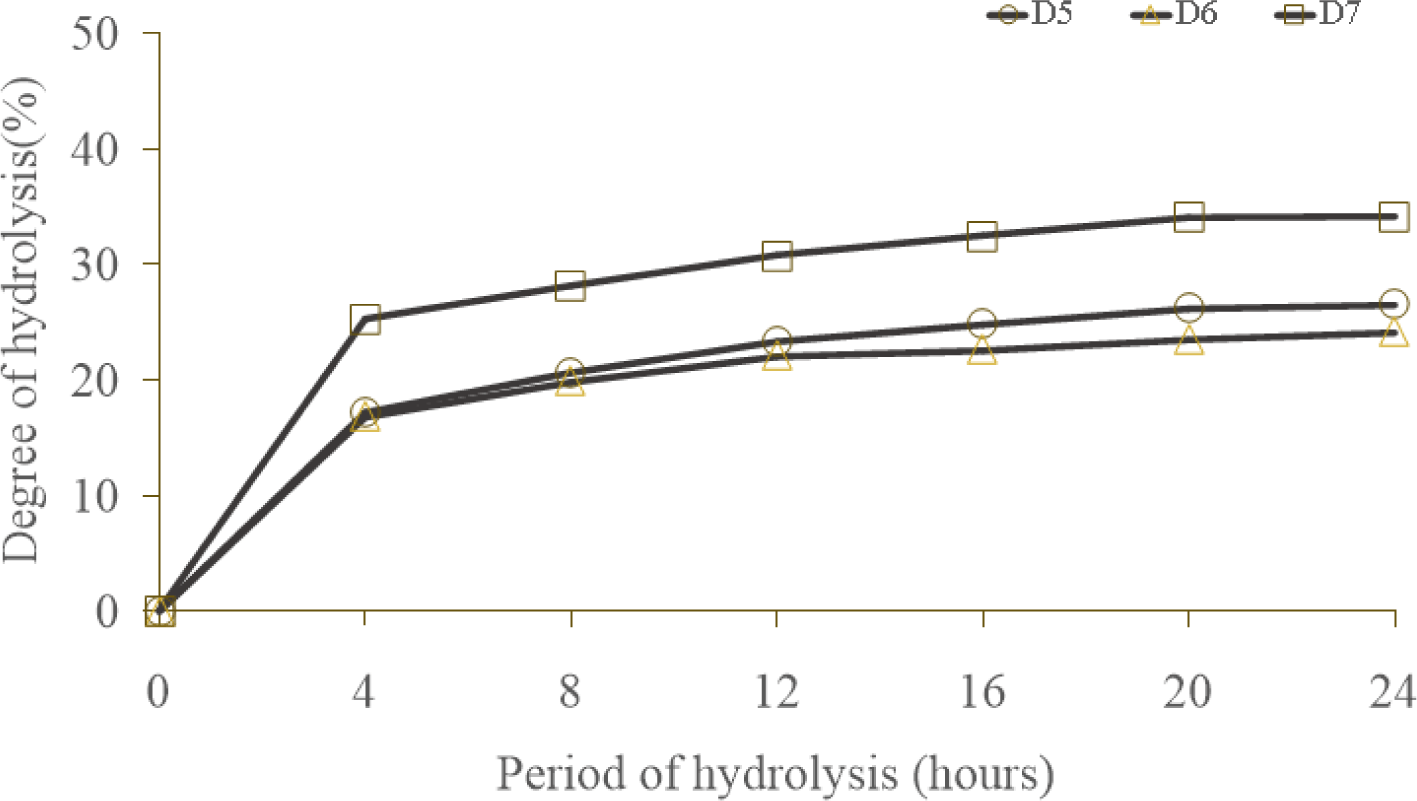
LAB possess the ability to hydrolyze proteins through complex peptidase activity, converting proteins into amino acids and nitrogen, making them a valuable source of nutrients for the body. Protein fermentation was assessed by analyzing soluble protein content and the capacity of primary amino groups for hydrolysis. LAB strains were inoculated into the protein solution, and hydrolysis levels were monitored every 4 hours (Fig. 2). The proteolytic activity of LAB led to an increase in peptide formation and a rise in total free amino group concentration. Within the first 0–4 hours, all three LAB strains exhibited a sharp increase in hydrolytic activity. After this period, hydrolysis progressed more slowly, reaching a plateau around 20 hours, with negligible changes observed beyond that point. These results indicate that LAB strains achieved the highest rate of protein proteolysis after 20 hours and that the extent of proteolysis was time-dependent. This demonstrates that the LAB strains exhibit proteolytic activity in WPC solutions, supporting their role in protein hydrolysis (Fig. 2).
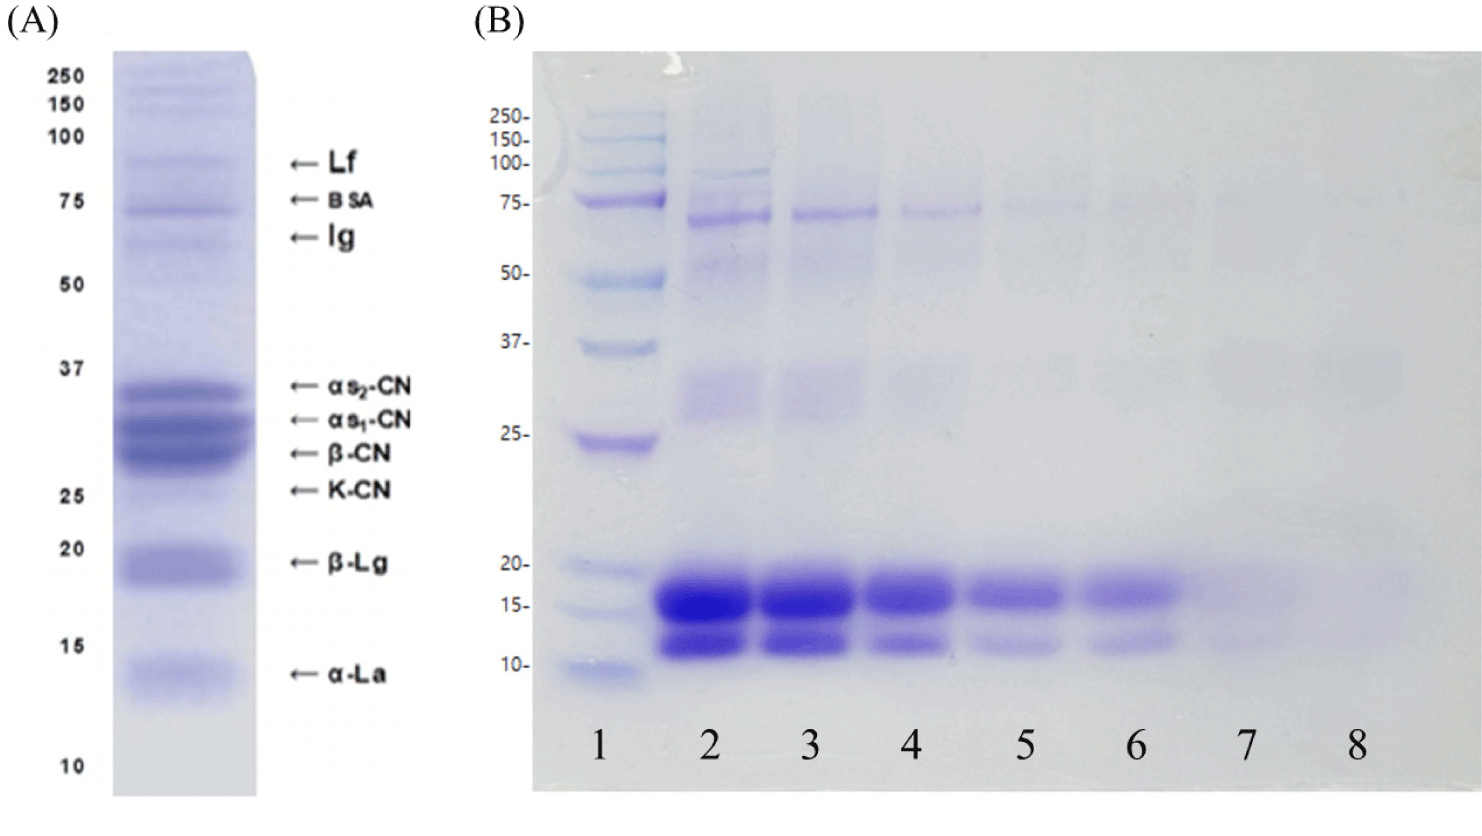
The SDS-PAGE analysis of whey protein hydrolyzed by L. plantarum D7 is shown in Fig. 3. Protein bands with molecular weights ranging from 13 to 250 kDa were identified. Major whey protein components, such as lactoferrin, bovine serum albumin, immunoglobulins, β-lactoglobulin, and α-lactalbumin, appeared as bands within the 13 to 100 kDa range. During the hydrolysis process, higher molecular weight proteins were broken down. After 20 hours of hydrolysis, significant degradation of lactoferrin, bovine serum albumin, and immunoglobulins was observed, demonstrating the efficient proteolytic activity of L. plantarum D7 on whey protein components.
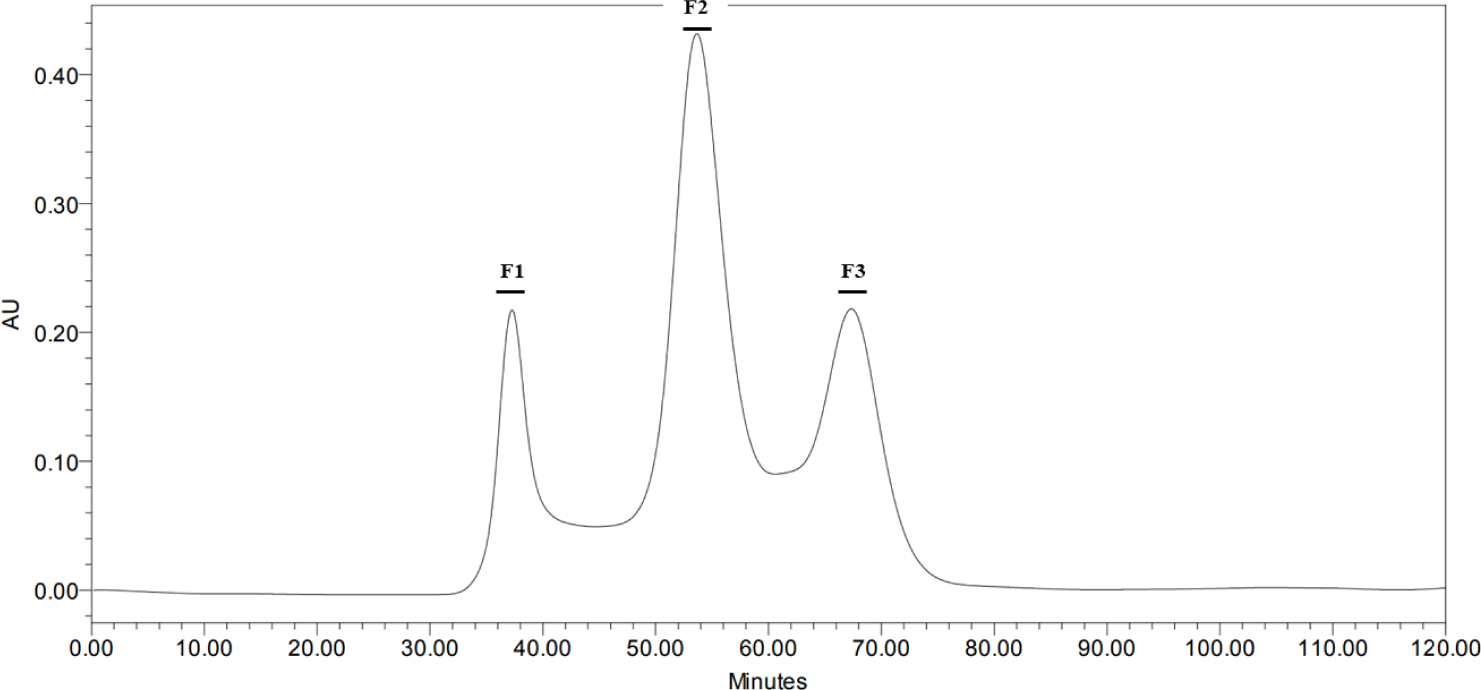
Whey protein hydrolysis pattern was analyzed using SDS-PAGE and subsequently subjected to preparative-scale fractionation for further analysis. The fermentation time was determined based on the degree of hydrolysis and SDS-PAGE results. The fermented WPC was fractionated using a HiPrep 16/60 Sephacryl S-100 HR column connected to a preparative liquid chromatography system. Separation was achieved based on molecular size, yielding three distinct fractions (Fig. 4).
The Trolox equivalent antioxidant capacity assay evaluates a compound’s ability to scavenge or neutralize radicals, using Trolox as the antioxidant reference standard [31]. The ABTS assay results are presented in Fig. 5. All fractions, except for F3, demonstrated greater ABTS radical scavenging activity compared to non-hydrolyzed whey protein. Among the fractions, fraction 2 exhibited the highest activity.
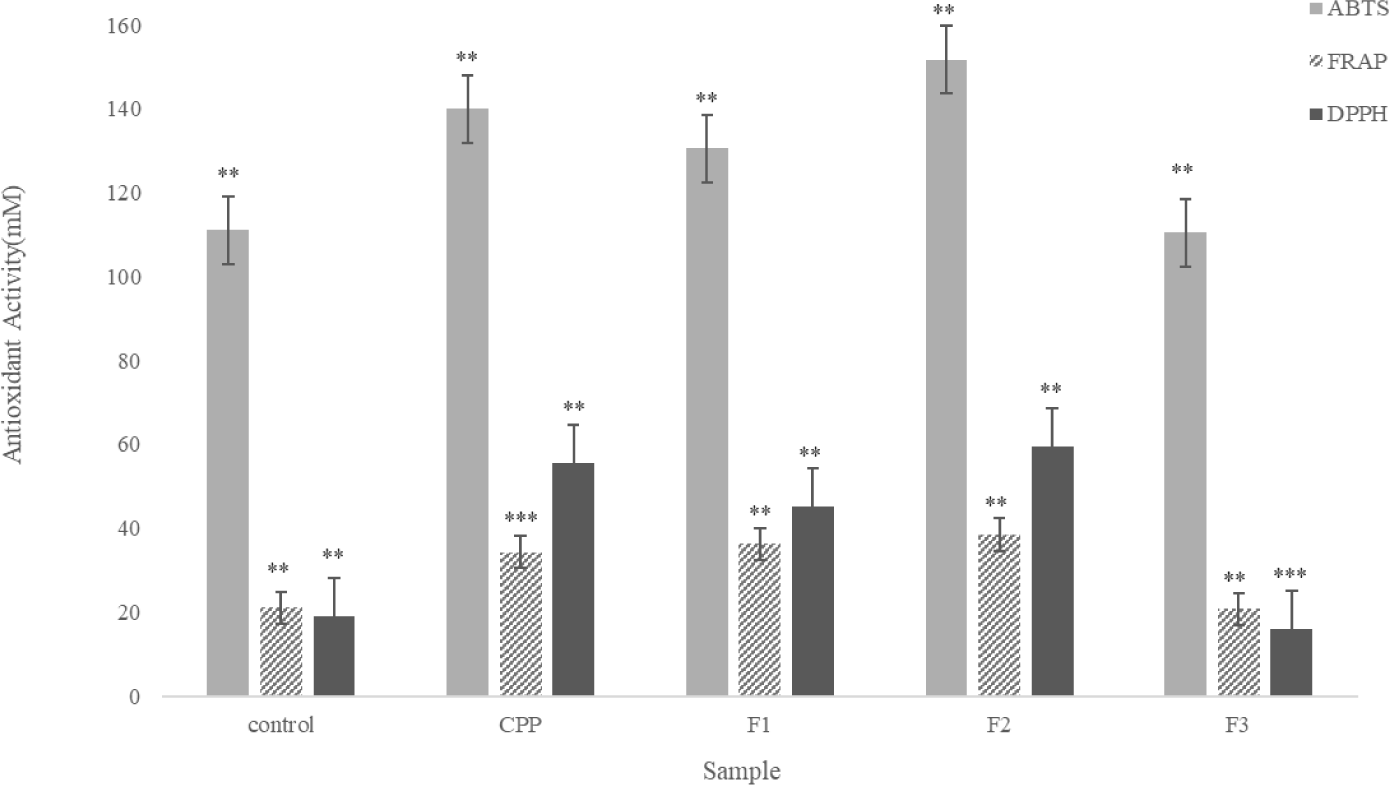
DPPH, a stable free radical, is commonly used to evaluate the free radical scavenging activity of antioxidants [32]. The antioxidant activity of each fraction was assessed by determining its DPPH scavenging capacity. DPPH radical scavenging values were quantified by referencing a standard curve generated using ascorbic acid (Vitamin C), and statistical analysis was subsequently performed. The results, shown in Fig. 5, indicate that fractions 1 and 2 exhibited DPPH radical scavenging activity comparable to that of CPP.
The FRAP assay measures the ability of antioxidants to convert ferric ions (Fe3+) into ferrous ions (Fe2+), producing a blue-colored Fe2+–TPTZ complex that exhibits maximum absorbance at 593 nm. This reaction reflects the electron-donating ability of antioxidants, which plays a crucial role in disrupting free radical chain reactions [32]. The decrease in absorbance is directly associated with the antioxidant content [19]. As shown in Fig. 5, fraction 2 demonstrated ferric-reducing antioxidant power comparable to CPP, underscoring its strong antioxidant potential based on its electron-donating capability and ferric ion reduction ability.
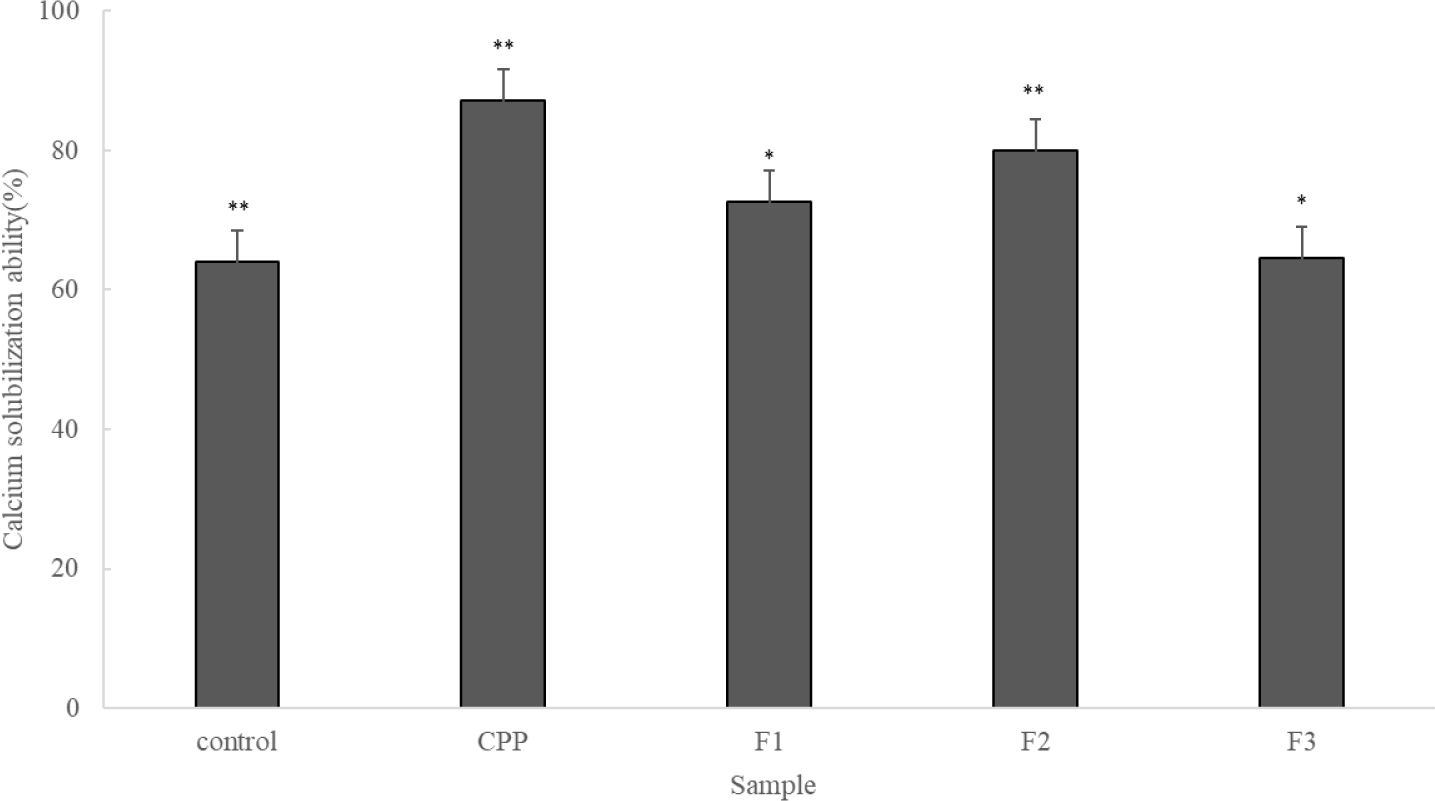
CPP is rich in phosphoserine, which interacts with calcium to enhance its solubility. In this study, calcium solubility was assessed to determine whether the individual fractions exhibited calcium-solubilizing properties similar to those of CPP. The results revealed that CPP achieved a high calcium solubility of 87.15%. The phosphoserine in CPP plays a key role in dissolving calcium and improving its solubility. Although all hydrolysate fractions showed lower calcium solubilization capacity compared to CPP, they demonstrated greater capacity than unhydrolyzed whey protein. Among the fractions, fraction 2 exhibited approximately 80% calcium solubilization capacity, which was slightly lower than CPP but still significant (Fig. 6). These findings suggest that fraction 2 may have potential calcium-solubilizing capabilities.
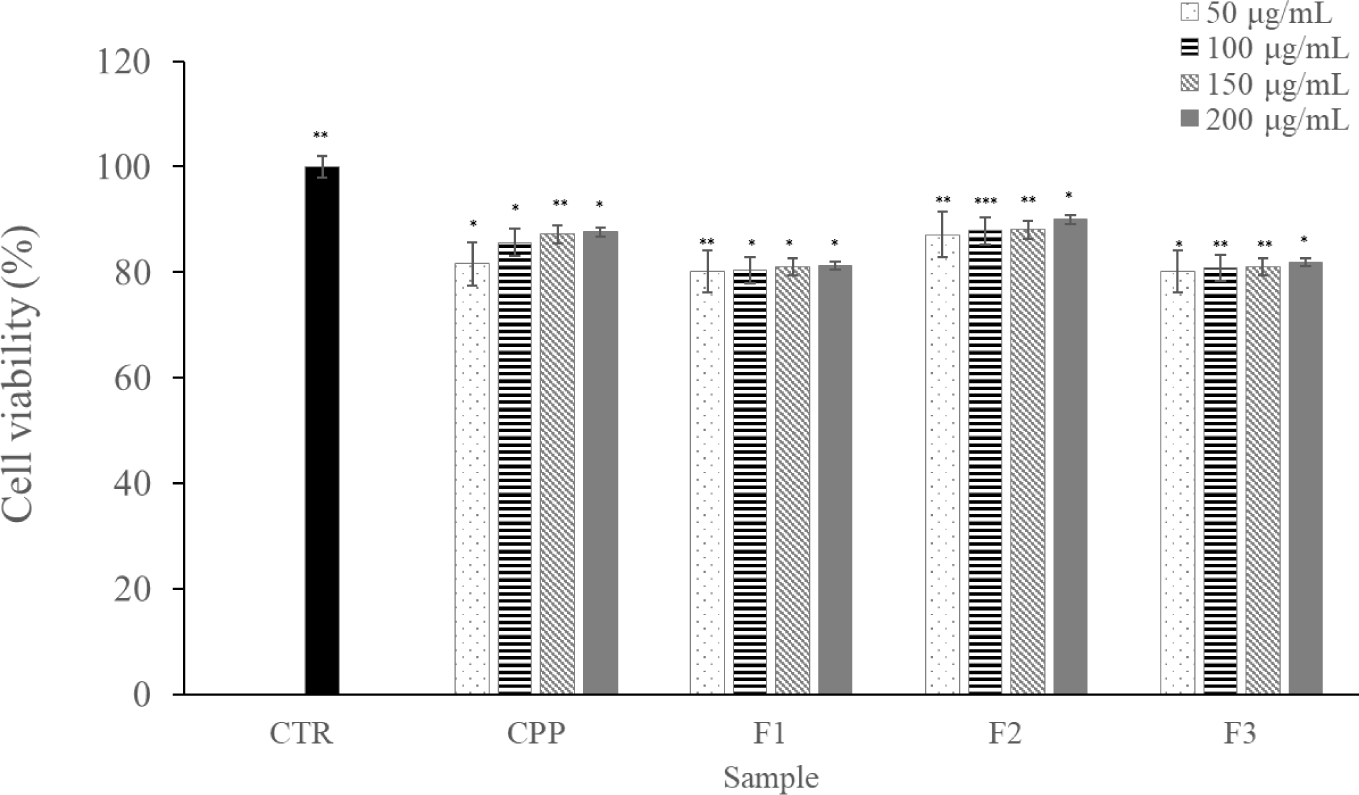
Cytotoxicity tests using the MTT assay are commonly employed in in vitro toxicology studies. The experimental findings demonstrated that higher concentrations enhanced cell viability. Furthermore, all fractions maintained cell viability above 80% (Fig. 7). These results confirmed that the macrophage fractions were non-cytotoxic.
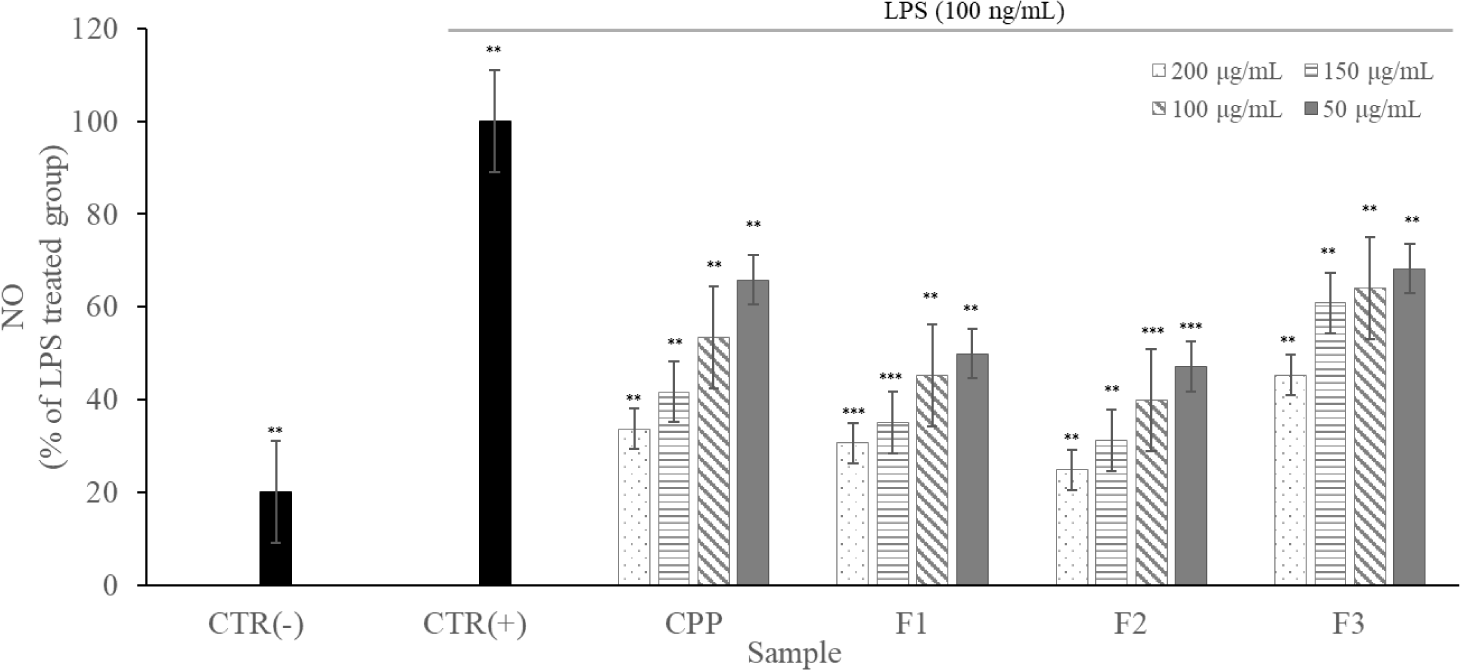
NO plays a crucial role in blood coagulation, blood pressure regulation, and immune responses in cancer cells. However, it is oxidized into reactive oxygen species (ROS), leading to the formation of active NO. These reactive species can further generate oxidants, which may result in cytotoxicity. NO production increases in cells exposed to inflammatory mediators due to tissue damage and inflammatory diseases. The results of this study indicated that NO production was suppressed as the concentration of the fractions increased (Fig. 8). Additionally, MTT assay results confirmed that the inhibition of NO production was not due to cytotoxic effects.
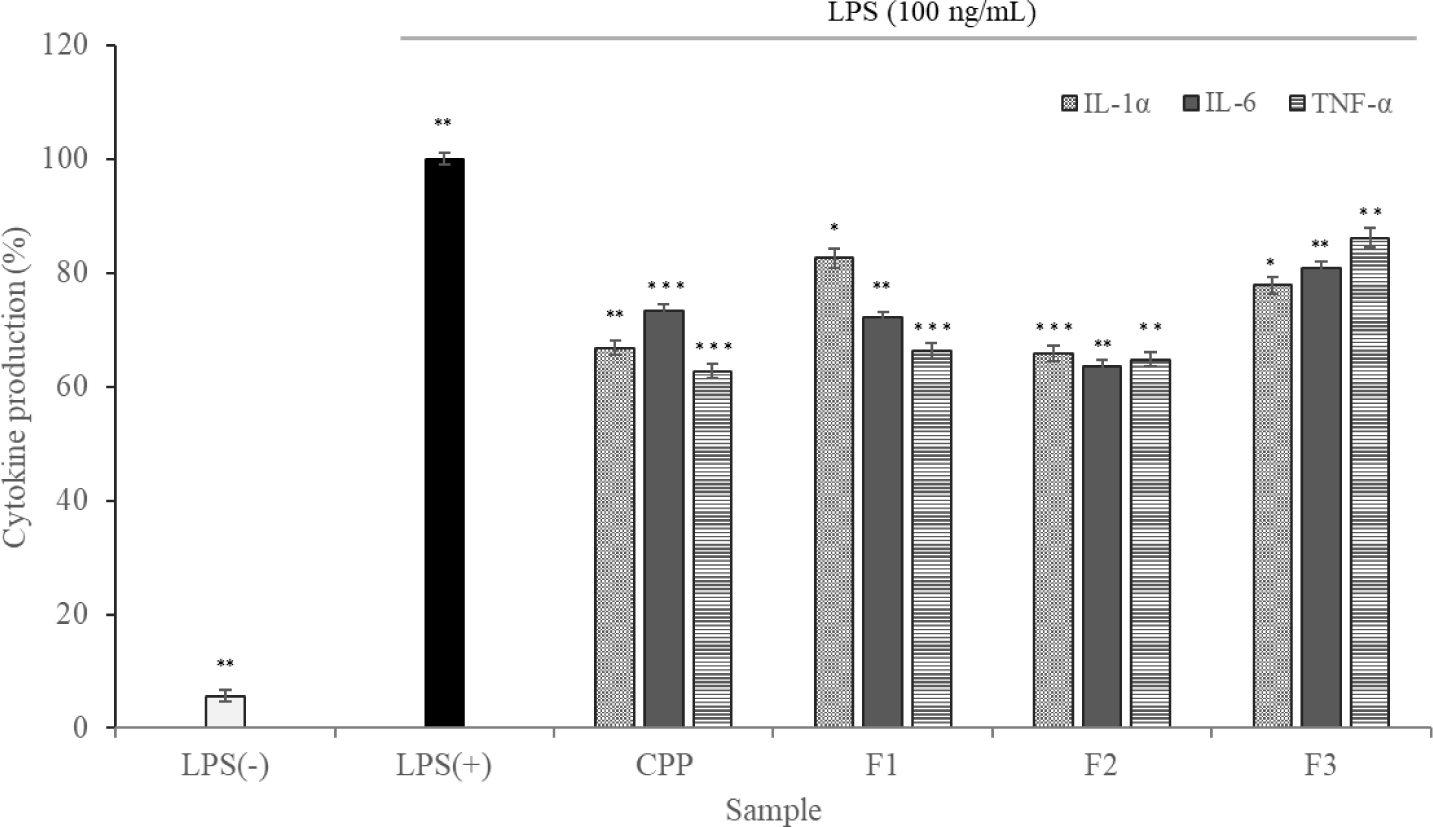
Maintaining immune homeostasis requires either direct or indirect communication between immune cells. Cytokines play a critical role in regulating immune responses by promoting the proliferation, differentiation, and functional modulation of various immune cells. Many diseases are closely linked to inflammatory processes, during which immune cells release proinflammatory cytokines that drive inflammation [33]. In the present study, the expression levels of IL-1α, IL-6, and TNF-α were quantified. ELISA-based cytokine analysis revealed that the production of these three cytokines was significantly reduced in all sample-treated groups compared to the LPS-stimulated positive control. These findings indicate that the fractions of fermented WPC exhibit anti-inflammatory properties. Furthermore, the notably decreased secretion of TNF-α by macrophages treated with the fractions may contribute to the suppression of other proinflammatory cytokines, as TNF-α plays a central role in triggering downstream inflammatory cascades (Fig. 9). This suggests a potential mechanism by which the samples may alleviate inflammatory responses.
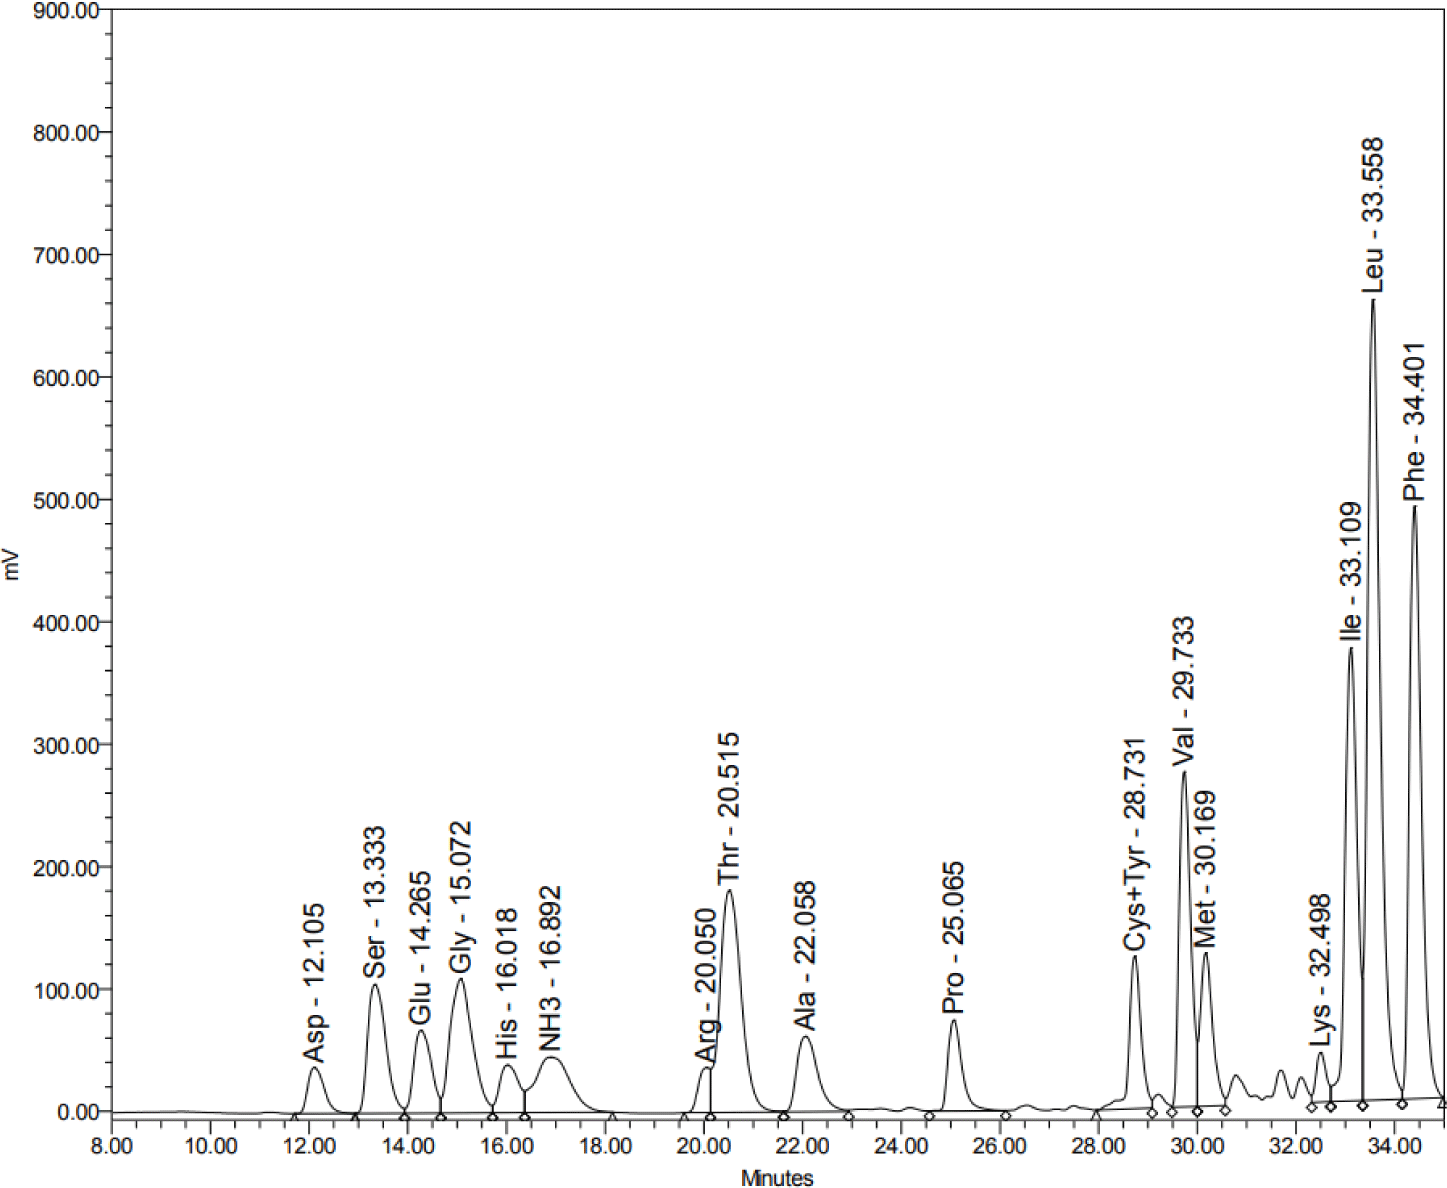
Following these findings, fraction 2 was chosen for further analysis. Using the AccQ-Tag system to determine the amino acid composition of the selected fraction, a total of 17 distinct amino acids were identified, along with several unidentified amino acid components (Fig. 10 and Table 12). Threonine, leucine, phenylalanine, and valine are amino acids that stimulate muscle protein synthesis.
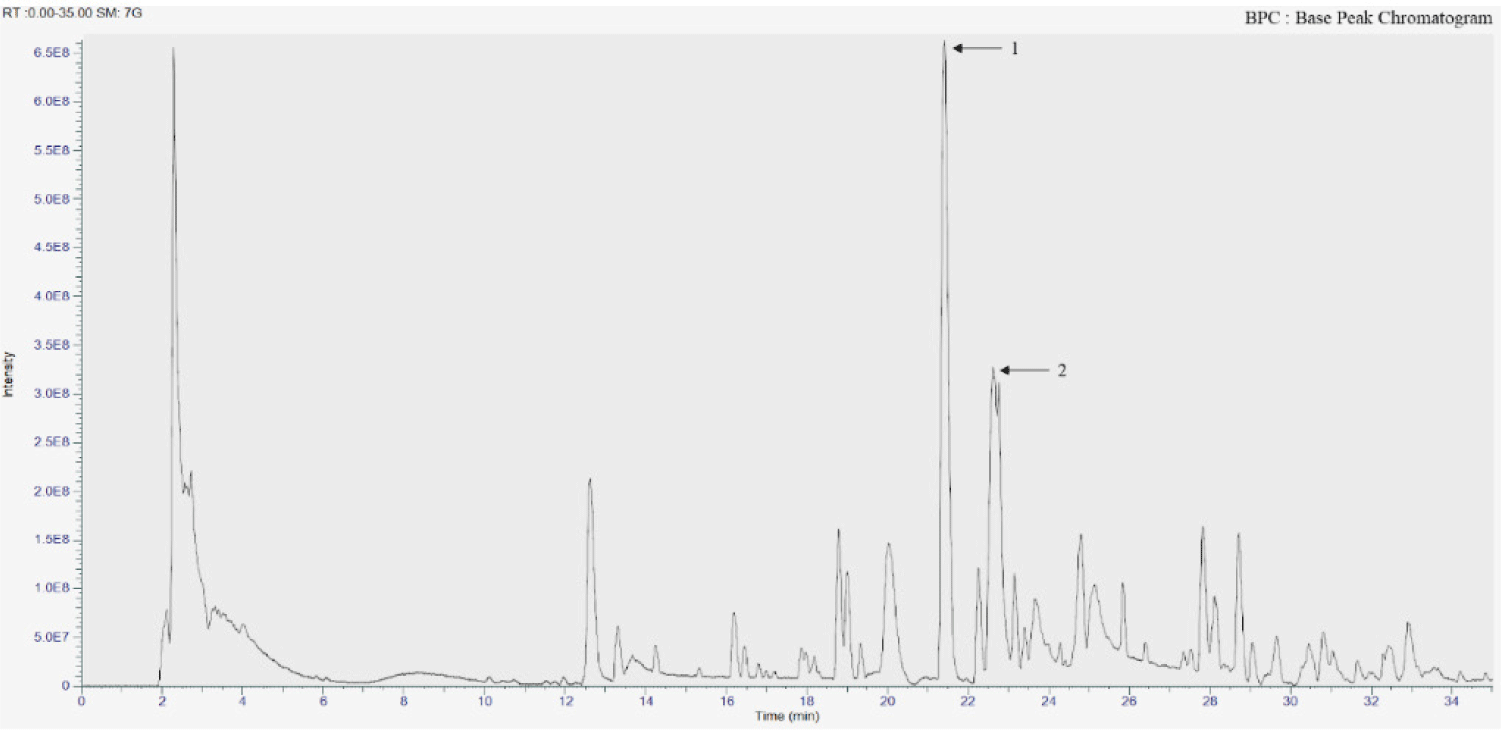
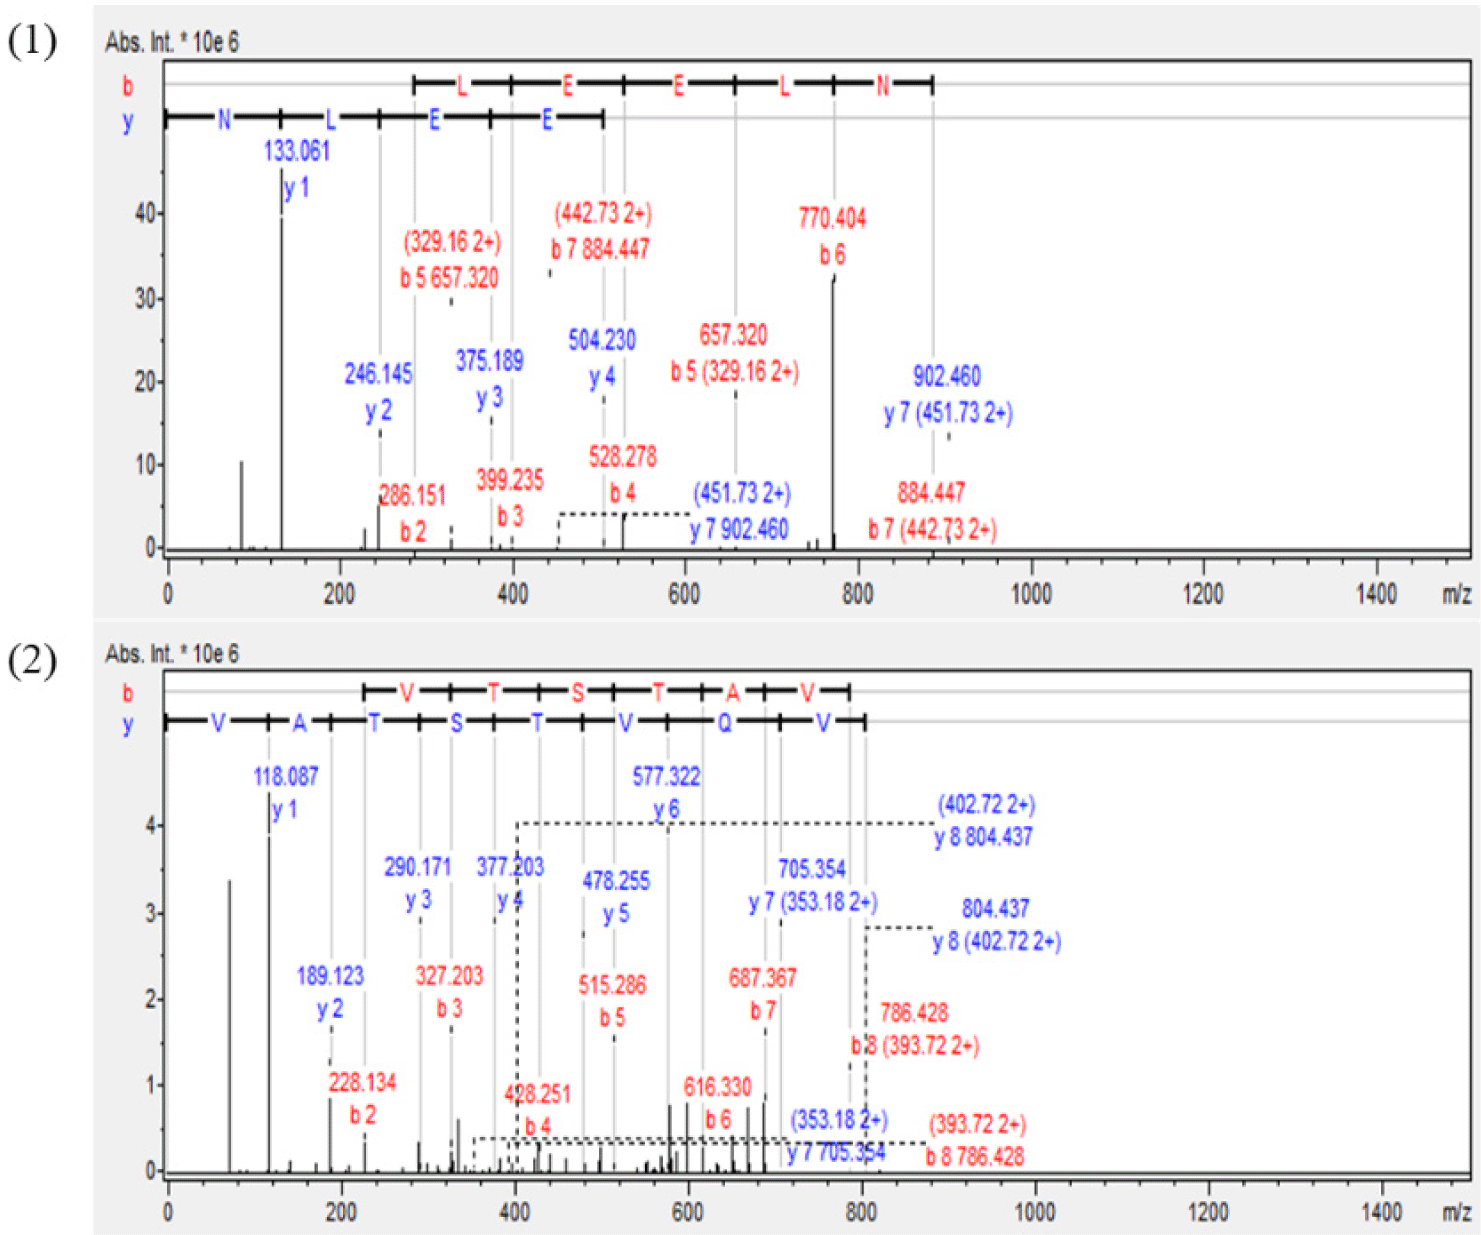
Peptide separation and sequence identification of fraction 2 was performed using LC-MS and LC-MS/MS analysis. Mass spectrometry revealed the presence of numerous peptides, though only two were completely sequenced, indicating that further purification of fraction 2 might be necessary. Two peptides were identified in this fraction (Table 13), with molecular weights of 902.457 Da and 804.446 Da, respectively. The corresponding molecular masses and MS/MS fragmentation patterns are presented in Figs. 11 and 12.
| Peak No. | RT | m/z | Charge | Calc. mass[M+H] | Sequence |
|---|---|---|---|---|---|
| 1 | 21.46 | 451.733 | 2 | 902.457 | RELEELN |
| 2 | 22.75 | 402.727 | 2 | 804.446 | VQVTSTAV |
DISCUSSION
The canine gut microbiome has a unique composition and physiological characteristics that are different from humans and other animals, and previous studies suggest that canine-derived probiotics may be effective in improving gut health and immune function in dogs [34–36]. It is anticipated that the biochemical metabolites produced by strains of canine origin may confer greater benefits to dogs, given their host-specific adaptation and compatibility. In this study, the functional characteristics of whey-derived peptides were examined using LAB isolated from canine feces as fermentation agents.
In the calcium solubilization test, fraction 2 demonstrated a solubilization level of 91.8% relative to CPP.
The superior calcium solubilization capacity of CPP is attributed to their peptide sequences, which are rich in serine (Ser) and glutamic acid (Glu) residues. These residues confer a multi-negative charge, enabling stable chelation with calcium ions [37]. LC/MS sequence analysis of the fermented whey peptide fraction 2, produced using L. plantarum D7, identified two peptide sequences: RELEELN (Arg-Glu-Leu-Glu-Glu-Leu-Asn) and VQTSTAV (Val-Gln-Val-Thr-Ser-Thr-Ala-Val). Notably, RELEELN exhibits a high degree of similarity to the previously reported CPP sequence REELEELN, characterized by multiple glutamic acid (E) residues that impart a negative charge. Furthermore, REELEELN exhibits 71.4% sequence identity (5/7 residues) at the N-terminal region with the β-casein-derived mineral-binding peptide RELEELNVPGEIVESLSSSEESITR, suggesting conserved structural homology that may underpin shared calcium-chelating functionalities [38]. Although this sequence does not directly correspond to the phosphorylation sites of conventional CPP, its structural resemblance suggests potential functionality related to calcium ion binding.
Amino acid analysis of fraction 2, a whey peptide fraction fermented with L. plantarum D7, revealed a composition enriched with leucine, valine, isoleucine, serine, threonine, and aromatic amino acids such as phenylalanine and tyrosine. Notably, the branched-chain amino acids (BCAAs) leucine, valine, and isoleucine are known to regulate calcium absorption, suggesting that fraction 2 may exhibit a high calcium absorption rate [39]. This hypothesis is further supported by previous studies indicating that peptides with sequences similar to CPP can enhance calcium absorption [40,41]. In addition, fraction 2 was found to contain arginine and lysine that are absent in conventional CPP but are critical for osteoblast formation highlighting its potential as an alternative calcium absorption enhancer. Among the amino acids in fraction 2, threonine was the most abundant. Threonine is not only essential for muscle function and bone formation [42] but also plays a crucial role in mucosal immunity and immune modulation. The high content of serine, an amino acid critical for phosphorylation and calcium binding in CPP, further indicates a strong potential for mineral-binding capacity. Furthermore, the presence of aromatic amino acids, which are known for their antioxidant properties, contributes to the overall bioactivity of fraction 2.
The antioxidant activity test revealed that whey peptides fermented with L. plantarum D7 exhibited significant antioxidant activity. These findings are consistent with previous studies that have demonstrated the antioxidant effects of whey fermented with L. spp strains [43,44]. This antioxidant effect can be attributed to the presence of aromatic amino acids, such as phenylalanine and tyrosine, which are known for their radical-scavenging properties. Specifically, these aromatic amino acids can donate hydrogen atoms to electron-deficient radicals through a process known as resonance stabilization, thereby enhancing the radical-scavenging capacity of the peptides [45].
The anti-inflammatory activity of fraction 2 was also confirmed in this study. Fraction 2 was found to suppress the secretion of pro-inflammatory cytokines and their associated mediators, highlighting its potential role as an anti-inflammatory peptide. While the REELEELN sequence shares structural homology with immunomodulatory peptides, direct evidence for its anti-inflammatory activity remains limited in current literature. In contrast, VQTSTAV is recognized as a bioactive peptide with notable antioxidant, antimicrobial, and immunomodulatory properties [46]. This sequence analysis indicates that the peptides identified in fraction 2 may serve as alternatives to conventional CPP, offering not only enhanced antioxidant and antimicrobial activities but also immunomodulatory capacity.
The fermented peptides demonstrated antioxidant, calcium-solubilizing, and anti-inflammatory properties through in vitro assays, highlighting their potential as functional ingredients. However, as these findings are based solely on in vitro evaluations, they may not fully reflect the complex physiological conditions of living organisms. To address this limitation, in vivo validation particularly in companion animals such as dogs is essential. Previous studies have shown that CPP administration in beagle dogs can enhance immune function by increasing serum cytokine and immunoglobulin levels, without inducing toxicity [47]. These results suggest that similar bioactive peptides may confer physiological benefits in canines. Despite this potential, in vivo studies remain scarce. To bridge this research gap, we plan to conduct well-designed in vivo trials to evaluate the health effects of whey derived peptides in dogs. Our future investigations will focus specifically on their roles in alleviating joint inflammation and supporting muscle health both of which are critical for canine well-being. These studies will not only confirm the in vivo bioactivity of the peptides but also provide insights into their bioavailability, metabolic pathways, and applicability in functional food development. Ultimately, this research aims to support the creation of targeted dietary solutions to promote canine health. The findings of this study serve as a foundational step toward the development of functional food ingredients specifically designed to support the well-being of companion animals.