INTRODUCTION
Animal nutritionists are actively exploring various strategies to mitigate the environmental impact of animal production. In this context, it is notable that ruminants exhibit lower nitrogen utilization efficiency than non-ruminants. Approximately 70%–75% of the nitrogen ingested by ruminants is excreted in manure [1]. The excreted nitrogen can lead to environmental problems, including the production of nitrous oxide, a significant greenhouse gas, and soil eutrophication [2-4].
Rumen-protected protein (RPP) is a protein-rich ingredient that is artificially treated using physical and chemical methods to increase the proportion of ruminal undegradable protein (RUP). Recent studies have focused on evaluating combinations of physical and chemical treatments for the development of RPP. Rigon et al. [5] and Molosse et al. [6] reported that combining heat treatment with xylose increased the RUP content in peanut and cottonseed meals. Díaz-Royón et al. [7] suggested that applying malic acid or orthophosphoric acid in combination with heat treatment decreased rumen degradation of sunflower meal and spring peas. Venegas et al. [1] observed that the combined application of malic acid and heat treatment to sunflower seeds and sunflower meal did not negatively affect rumen fermentation and was effective in reducing ammonia-nitrogen (NH3-N) concentrations. Although treating protein feed with a combination of heat and sugars or heat and acid solutions can effectively inhibit microbial degradation in the rumen, the efficacy of these treatments varies depending on several factors, such as the type of protein feed, type and concentration of sugars and acids, and the intensity and duration of heat [1,5,6].
In this study, citric acid (CA) and heating were applied to soybean meal (SBM) since CA offers the advantage of being relatively cheaper compared to commonly used organic acids such as malic acid and orthophosphoric acid. CA has been suggested to act as a catalyst for rumen microbial metabolism when used as a feed additive [8]. Packett and Fordham [9] reported that adding 2% sodium citrate to lamb feed increased weight gain by 47% and feed efficiency by 23%. Additionally, Kazemi-Bonchenari et al. [10] found that treating barley grains with CA improved fiber digestibility in total mixed rations, and enhanced weight gain and feed efficiency in Holstein male calves. Sun et al. [11] proposed that citrate may have the potential to mitigate methane emissions. However, our literature investigation estimated that no studies have evaluated methane production following CA supplementation in in vitro or in vivo experiments. In contrast, Vanegas et al. [1] reported that a combined heat and malic acid treatment of sunflower seeds and sunflower meal was effective in reducing methane emissions. SBM was selected as the protein source because it is a major protein ingredient in Korea [12] and has a better amino acid composition than the other sources used in previous RPP studies. Therefore, this study aimed to evaluate the effects of CA and heat-treated SBM (HCSBM) on rumen fermentation characteristics, methane production, and microbiota using in vitro experiments.
MATERIALS AND METHODS
Protocols for animal use in this study were reviewed and approved by the Animal Research Ethics Committee of Pusan University (PNU-2022-3168).
The SBM and CA used for the in vitro experiments were provided by GeneBiotech (Gongju, Korea). The experimental treatments included untreated SBM, heat-treated SBM (HSBM), CA-treated SBM (CSBM), and HCSBM. HSBM was produced by heat-treating 100 g of SBM at 160°C for 1 h using a roaster (FEC-006, Biotech, Gimpo, Korea). CSBM was prepared by mixing 100 g of SBM with 0.4 mL of 1.5 mol L-1 CA solution per gram of SBM. HCSBM was formulated by adding 0.4 mL of 1.5 mol L-1 CA solution per gram to 100 g of SBM, followed by heat treatment at 160°C for 1 h using a roaster. All experimental feeds were dried at 60°C for 72 h and then ground using a cyclone mill (Foss Tecator Cyclotec 1093, Foss, Hillerød, Denmark) equipped with a 1 mm screen. Crude protein ([CP] method #990.03), ether extract ([EE] method #920.39), and ash (method #942.05) were analyzed according to AOAC standards [13]. Neutral detergent fiber (NDF) and lignin contents were determined using the method described by Van Soest et al. [14]. Gross energy was measured using a Parr 6400 Automatic Isoperibol Calorimeter (Parr Instrument, Moline, IL, USA) in accordance with the manufacturer’s guidelines.
Rumen fluid was collected from two cannulated Holstein steers (body weight: 650 ± 12.3 kg). The steers were fed a diet consisting of commercial concentrate (Famsco, Chilgok, Korea) and oat hay in a 6:4 ratio twice daily. Water and mineral blocks were provided ad libitum. Rumen fluids were collected from various regions of the rumen 1 h before the morning feeding. The collected rumen fluid was immediately stored in a 4 L thermos bottle and transported to the laboratory within 30 min. It was then filtered through a mesh filter with a pore size of 250 µm while maintaining a temperature of 39°C, diluted at a 1:4 ratio with in vitro buffer [15], and bubbled with O2-free CO2 to maintain strictly anaerobic conditions until inoculation.
We conducted an in vitro batch culture experiment in two consecutive runs. Each experiment included three blanks, and each treatment was performed with four replicates. The experimental substrates (dry matter [DM], 1.0 g) were placed in 250 mL serum bottles. While flushing with O2-free CO2 gas, 100 mL of buffered rumen fluid was allocated into 250 mL serum bottles that contained the substrates. The bottles were completely sealed using butyl rubber stoppers and aluminum caps, then incubated at 39°C in a rotary shaker (JSSI-300T, JS Research, Gongju, Korea) at 80 rpm for 24 h.
Gas production was measured at 3, 6, 9, 12, and 24 h using a pressure transducer (XP01KPS1C1G; Honeywell, Charlotte, NC, USA) as described by Theodorou et al. [16]. After each measurement, all headspace gas was collected in evacuated gas sampling bags (Best Pack, Seoul, Korea) to prevent the inhibition of microbial activity due to headspace gas pressure and for methane analysis. The gas production profiles obtained during incubation were analyzed using a simple exponential model [17] to determine the fractional rate constant for gas production (Kg) and theoretical maximum gas production (Vmax). The concentrations of methane after 24 h were analyzed using a gas chromatograph (YL6500 GC System, Young-In Chromass, Anyang, Korea) equipped with a thermal conductivity detector and packed columns (3.05 m × 0.125 mm × 2 mm, Carboxen-1000, Agilent Technologies, Santa Clara, CA, USA). Helium was used as a carrier gas at a flow rate of 30 mL/min. The injector operated at room temperature, and the detector temperature was set to 130°C. The column oven was programmed to ramp at a rate of 15°C/min from an initial temperature of 60°C to a final temperature of 180°C, and the final temperature was maintained for 2 min. After 24 h of incubation, the serum bottles were opened, and the feed substrates were filtered using nylon bags (10 × 14 cm) with a pore size of 22 µm (Supply Filter Tech , Ansan, Korea). The nylon bags were dried at 60°C for 72 h to determine DM degradability (IVDMD). The CP content of the weighed bags was determined using the Kjeldahl method to assess CP degradability (IVCPD). Approximately 50 mL of the cultures were centrifuged at 3500 rpm for 20 min at 4°C. The supernatant was then separated into aliquots for the analysis of pH, volatile fatty acids (VFA), and NH3-N. The pH was measured using a pH meter (FP20, Mettler Toledo, Columbus, OH, USA). Pretreatment and analysis of VFA and NH3-N were conducted according to the methods described by Yoo et al. [18]. microbial crude protein (MCP) analysis was conducted with slight modifications to the method described by Makkar et al. [19]. Briefly, 10 mL of liquid culture was centrifuged at 500×g for 5 min at 4°C. The resulting supernatant was centrifuged at 20,000×g for 15 min to obtain a pellet. The pellet was resuspended in 10 mL 1× phosphate-buffered saline solution and centrifuged at 20,000×g for 15 min. The washing step was repeated twice. The final pellet was analyzed using the Kjeldahl method. Microbial DNA was sampled for the second experiment. A 1.8 mL sample of rumen fluid was placed into a 2 mL collection tube and centrifuged at 20,000×g for 20 min at 4°C. After centrifugation, the supernatant was discarded, and the remaining pellet was stored at −80°C until microbial DNA extraction.
Total DNA was extracted from the pellet according to the manufacturer’s protocol (QiAamp Fast DNA Stool Kit, QIAGEN , Hilden, Germany). Following DNA extraction, quantity and quality were assessed using a NanoDrop spectrophotometer (ND-200, Allsheng, Hangzhou, China). The purified DNA was stored at −20°C until used for 16S rRNA gene sequencing.
The sequencing libraries were generated using a universal primer set with Illumina adapter overhang sequences, targeting the V3 and V4 regions of the 16S rRNA gene (V3-F: 5´-CCTACGGGNGGCWGCAG-3´ and V4-R: 5´-GACTACHVGGGTATCTAATCC-3´) as described by Herlemann et al. [20]. Paired-end sequencing (2×300 bp) was performed by Macrogen (Seoul, Korea) on the MiSeq™ platform. Barcode sequences were trimmed using Cutadapt (Martin, 2011, version 4.1). Amplicon sequences were processed using Quantitative Insights into Microbial Ecology 2 (QIIME2, version 24.02) [21]. Initially, the Divisive Amplicon Denoising Algorithm 2 (DADA2) plugin was used to remove primer sequences, filter out low-quality reads (Q score < 25), merge paired-end reads, and eliminate chimeric sequences [22]. The amplicon sequence variants (ASVs) were classified taxonomically with the Silva 16S rRNA gene database [23], version SSU138.1. Several ASVs, including those that were taxonomically unassigned, eukaryotes, mitochondria, and chloroplasts, were excluded from the analysis. The alpha diversity of each sample was evaluated using the Shannon index, Simpson index, Faith’s phylogenetic diversity, observed ASVs, and evenness based on rarefied ASV tables with 28,819 randomly selected ASVs per sample. Good’s coverage was greater than 99.7% for all samples. Principal coordinate analysis (PCoA) was conducted using unweighted and weighted UniFrac distance matrices to evaluate the overall differences in ruminal microbiota among various treatments. Visualizations were performed using the Plotly package in R (version 4.3.3). Functional profiles derived from 16S rRNA gene sequences were predicted using ASVs and the corresponding biological observation matrix (BIOM) table through phylogenetic investigation of communities by reconstruction of unobserved state 2 (PICRUSt2, version 2.5.2) [24]. The updated Kyoto Encyclopedia of Genes and Genomes (KEGG) was used to infer KEGG orthologs and the KEGG modules were mapped using the hierarchical database. Principal component analysis (PCA) was conducted to evaluate the overall variance in the predicted KEGG orthologs across treatments, utilizing Bray-Curtis dissimilarities for comparison. The PCA plot was generated and visualized using the ggfortify package in R [25].
Normality of the data distribution was verified using the Shapiro-Wilk test via the UNIVARIATE procedure in SAS 9.4 (SAS Institute, Cary, NC, USA). Data on gas production, methane emissions, and fermentation characteristics were analyzed using the R software (version 4.3.3). A two-way analysis of variance (ANOVA) was employed to evaluate the main effects of heat treatment, CA treatment, their interactions, and experimental runs as blocking factors. The statistical model used was as follows:
where Yijk is the response variable, μ is the overall mean, Hi is the fixed effect of heat treatment (i = 1, 2), Cj is the fixed effect of CA treatment (j = 1, 2), (H×C)ij is the interaction effect of heat and CA treatment, Bk is the random effect of the block (experimental run) (k = 1, 2), and εijk is the random error term. When significant effects were observed, Tukey’s post-hoc test was used to compare the differences between treatments. Alpha diversity metrics that followed a normal distribution were analyzed using QIIME2. To assess the statistical differences in the PCoA and PCA results among treatments, a permutational multivariate analysis of variance (PERMANOVA) was conducted with 9,999 random permutations in both QIIME2 and R. Analysis of the composition of microbiomes with bias correction (ANCOM-BC) was utilized to identify differentially predominant microbiota (phyla and genera) and predict microbial functions across treatments, employing 1,000 maximum iterations and excluding structural zeros [26]. A significance threshold was set at p < 0.05, with trends noted for 0.05 ≤ p < 0.10.
RESULTS
The results of the chemical composition analysis of each treatment are presented in Table 1. The DM content increased in the heat-treated groups (HSBM: 99.5%, HCSBM: 97.4%) compared to the SBM (90.3%). The CP content in the CA-treated groups (CSBM: 47.7%DM, HCSBM: 47.9%DM) was lower compared to the SBM (51.6%DM). The NDF content was higher in the heat-treated groups (HSBM: 16.7%DM, HCSBM: 13.4%DM) compared to the SBM (8.51%DM). Similarly, lignin content was also greater in the heat-treated groups (HSBM: 2.43%DM, HCSBM: 2.03%DM) than in the SBM (0.80%DM).
The results for gas production, gas parameters, and methane emissions are presented in Table 2. The 3 h gas production was significantly higher in the CSBM (p < 0.01). At 6 h, gas production was significantly lower in the heat-treated groups (p < 0.01). The interaction effect of heat and CA resulted in the lowest gas production and Vmax in the HCSBM between 9 and 24 h (p < 0.01, respectively). Kg was the lowest in the groups treated with CA (p < 0.01). Methane production (%) was the lowest in the groups treated with CA (p < 0.01), and HCSBM showed the lowest methane production (mL/g DM) (p < 0.01).
Results for in vitro ruminal fermentation characteristics are shown in Table 3. IVDMD and IVCPD were lower in groups of heat treatment (p < 0.01). The highest pH was observed in SBM (p < 0.01). The NH3-N concentration was significantly lower in the HCSBM (p < 0.01), although no significant interaction was observed. As a result of the interaction effect, MCP and total VFA production, as well as the molar proportions of propionate and butyrate, were the lowest in the HCSBM (p < 0.01, respectively), while the molar proportion of acetate was the highest (p < 0.01). The molar proportions of iso-butyrate and iso-valerate were the lowest in the heat-treated groups (p < 0.01, respectively), while the valerate levels were significantly lower in the CA-treated groups (p < 0.01).
SBM, untreated soybean meal; HSBM, heat-treated soybean meal; CSBM, citric acid-treated soybean meal; HCSBM, heat and citric acid-treated soybean meal; IVDMD, dry matter degradability; IVCPD, crude protein degradability; NH3-N, ammonia nitrogen; MCP, microbial crude protein; TVFA, total volatile fatty acids; VFA, volatile fatty acids; A:P ratio, acetate to propionate ratio.
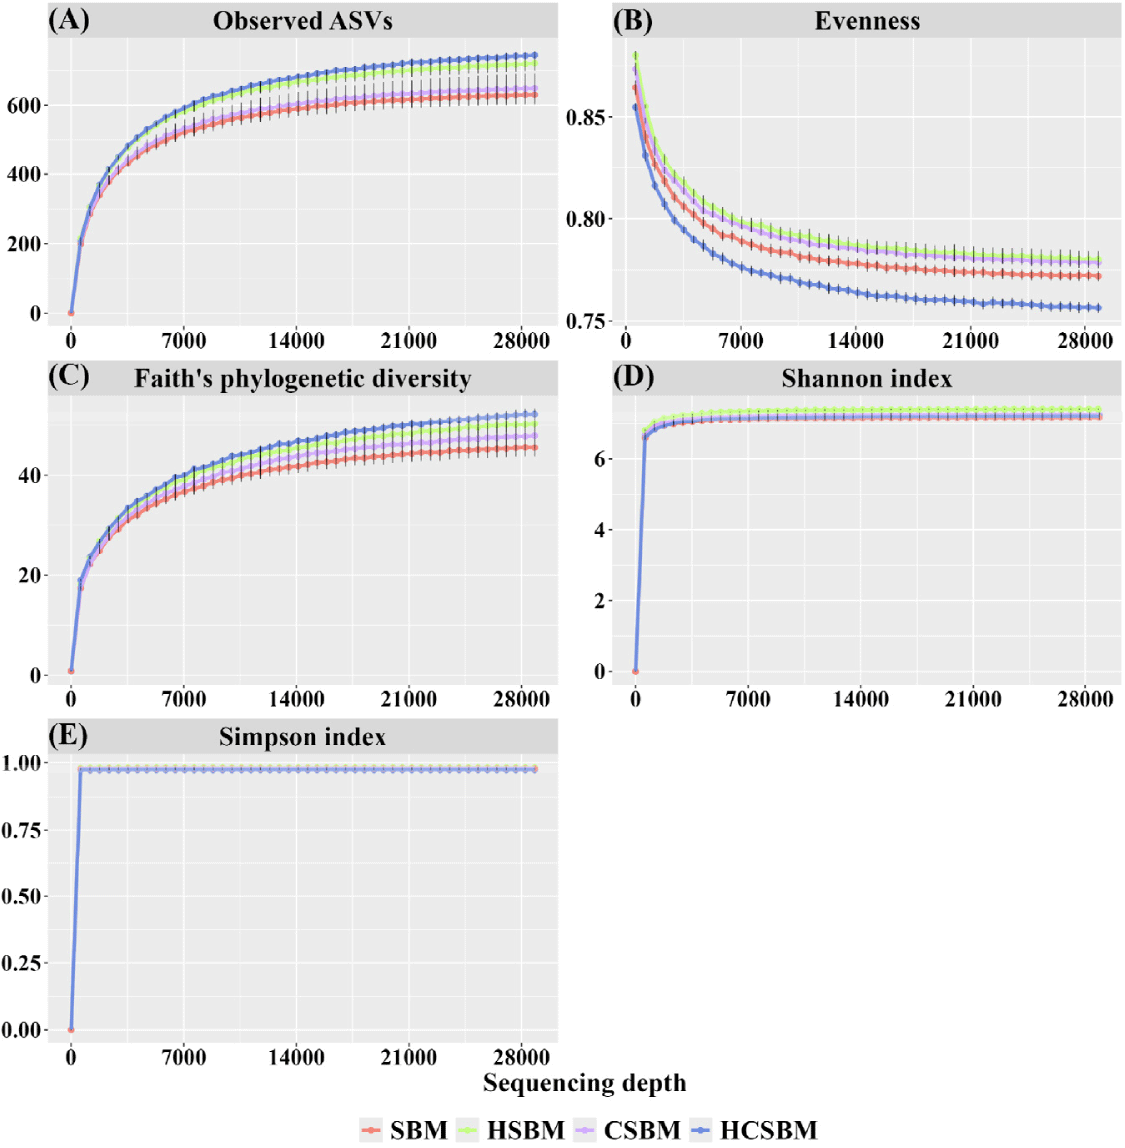
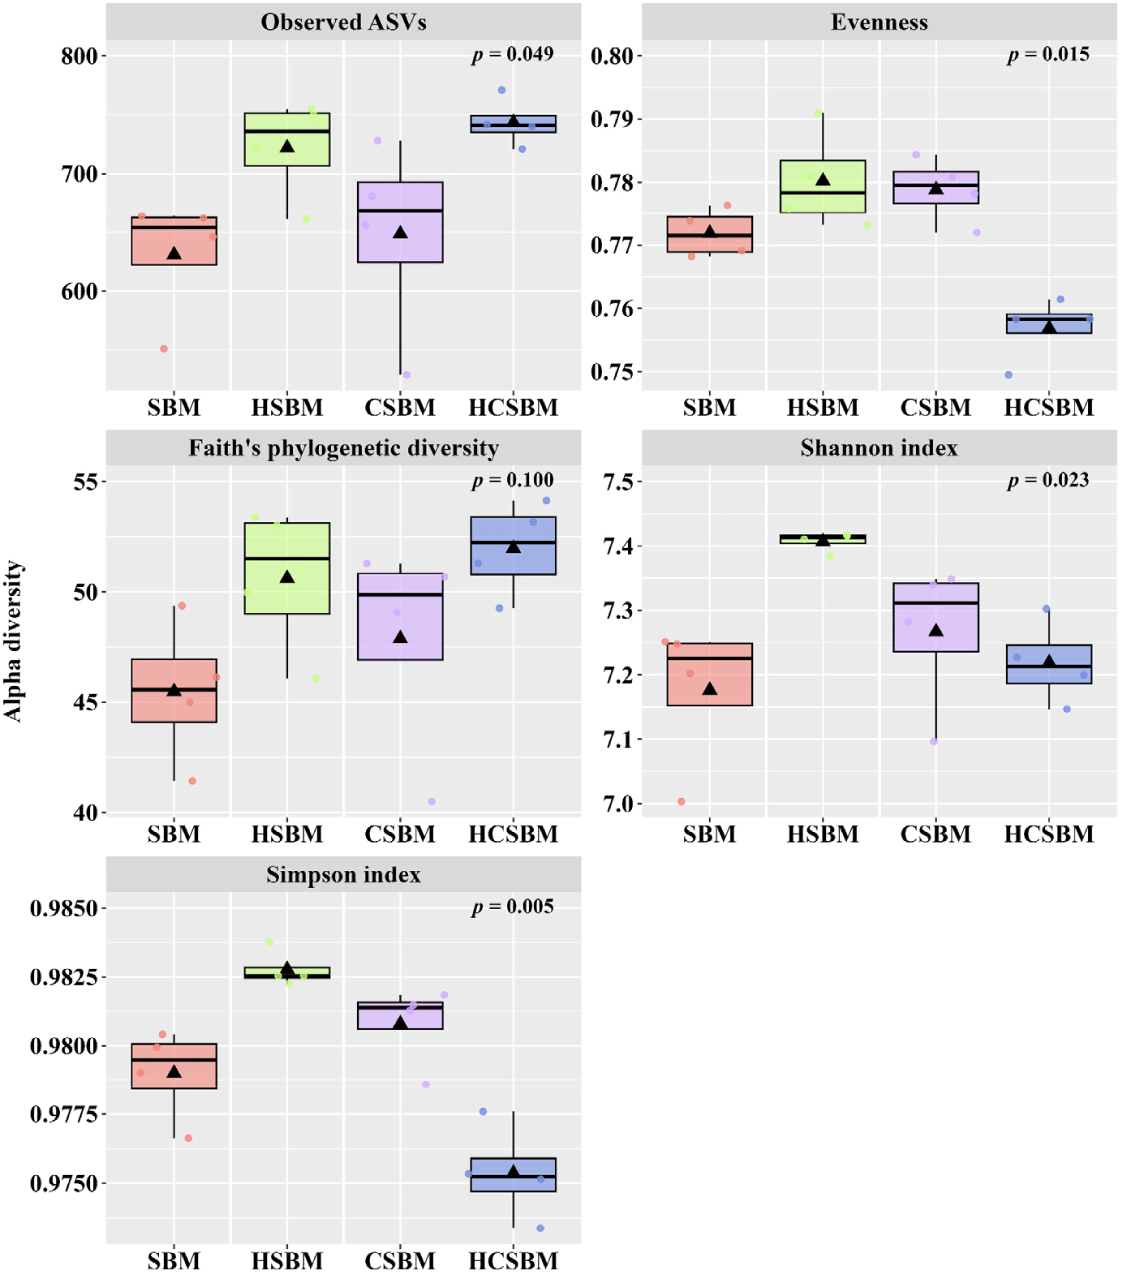
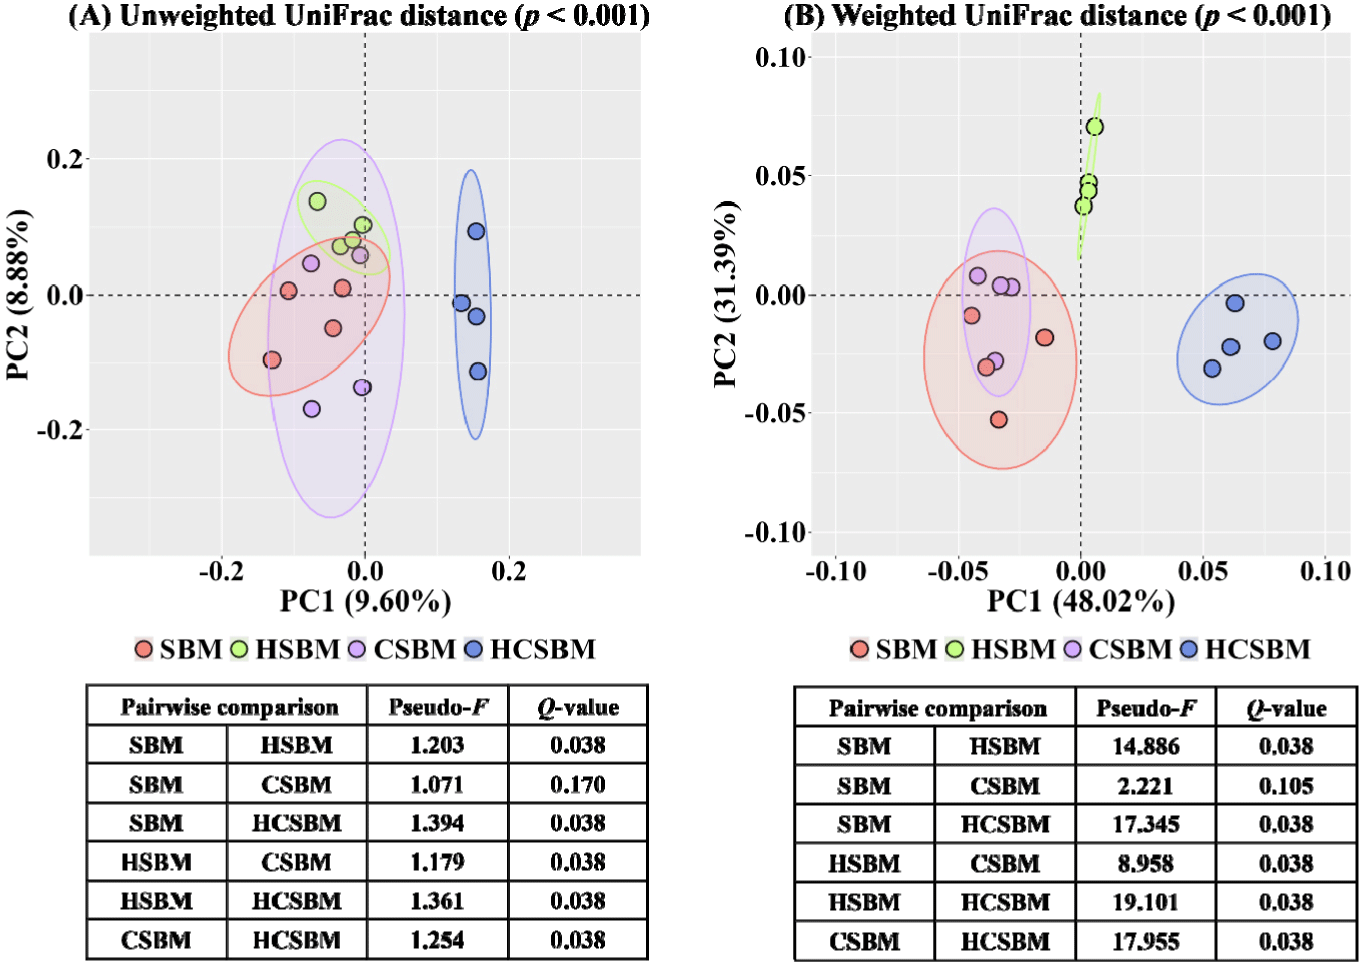
The rarefaction curves based on the alpha diversity indices tended to plateau, indicating that the sequencing depth adequately captured the overall ASVs for each treatment (Fig. 1). In the rumen microbiota, the evenness index was significantly lower in HCSBM than in SBM, HSBM, or CSBM (Fig. 2, p < 0.05). The Shannon and Simpson indices were significantly higher in the HSBM group than in the SBM, CSBM, and HCSBM groups (Fig. 2, p < 0.05). Overall differences in rumen microbiota were estimated using PCoA based on UniFrac distance matrices (Fig. 3). Regardless of the UniFrac matrix type, SBM and CSBM did not separate distinctly (pairwise comparison, Fig. 3; (A) unweighted UniFrac distance, Q-value = 0.170; (B) weighted UniFrac distance, Q-value = 0.105). However, a significant separation was observed among the SBM, HSBM, and HCSBM groups in the overall rumen microbiota (Fig. 3; (A) unweighted UniFrac distance, p < 0.05; (B) weighted UniFrac distance, p < 0.05).
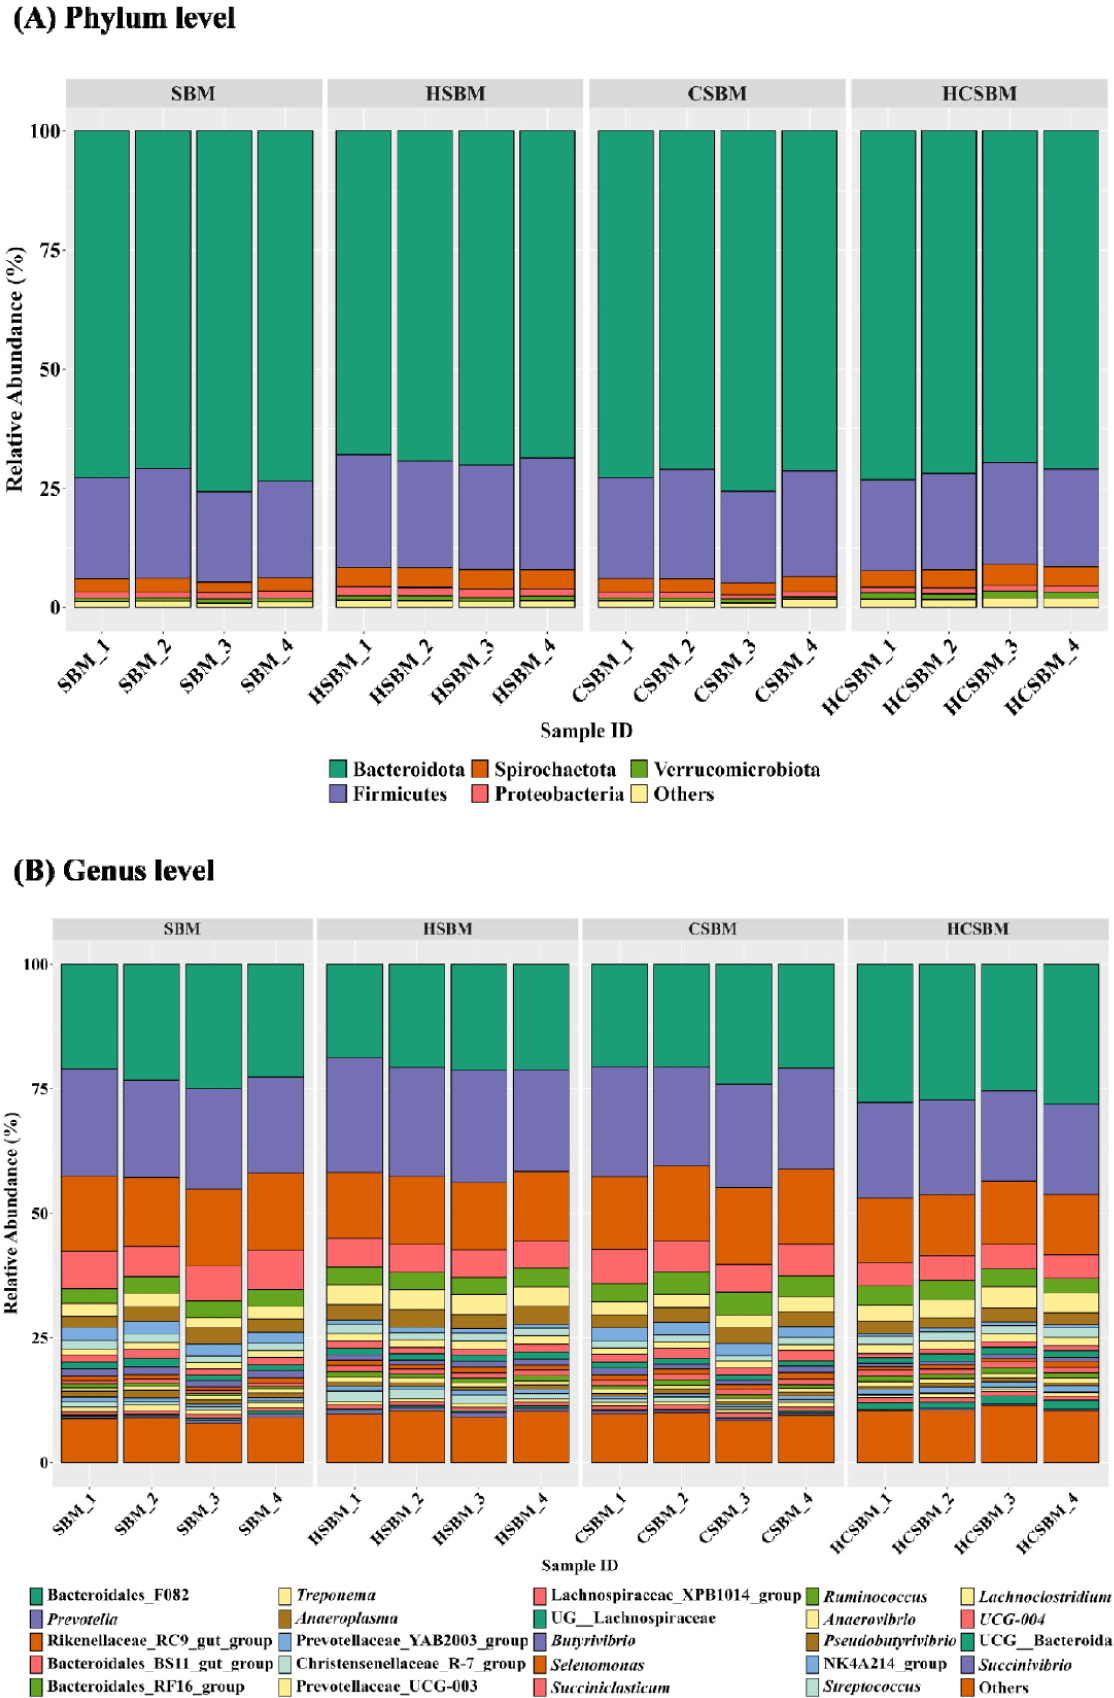
Predominant rumen microbiota at the (A) phylum and (B) genus levels were presented only for taxa with an occurrence rate of ≥ 30% and a relative abundance of ≥ 0.5% in at least one treatment (Fig. 4). The major rumen phyla were primarily assigned to five taxonomic groups (Fig. 4A): Bacteroidetes (71.6%), Firmicutes (21.4%), Spirochaetota (3.4%), and Verrucomicrobiota (0.9%). At the genus level, Bacteroidales_F082 and Prevotella were dominant, accounting for at least 20.5% and 18.6% of the total rumen microbiota, respectively, regardless of the treatment. Approximately 89.4% of rumen microbiota was assigned to 24 major genera (Fig. 4B).
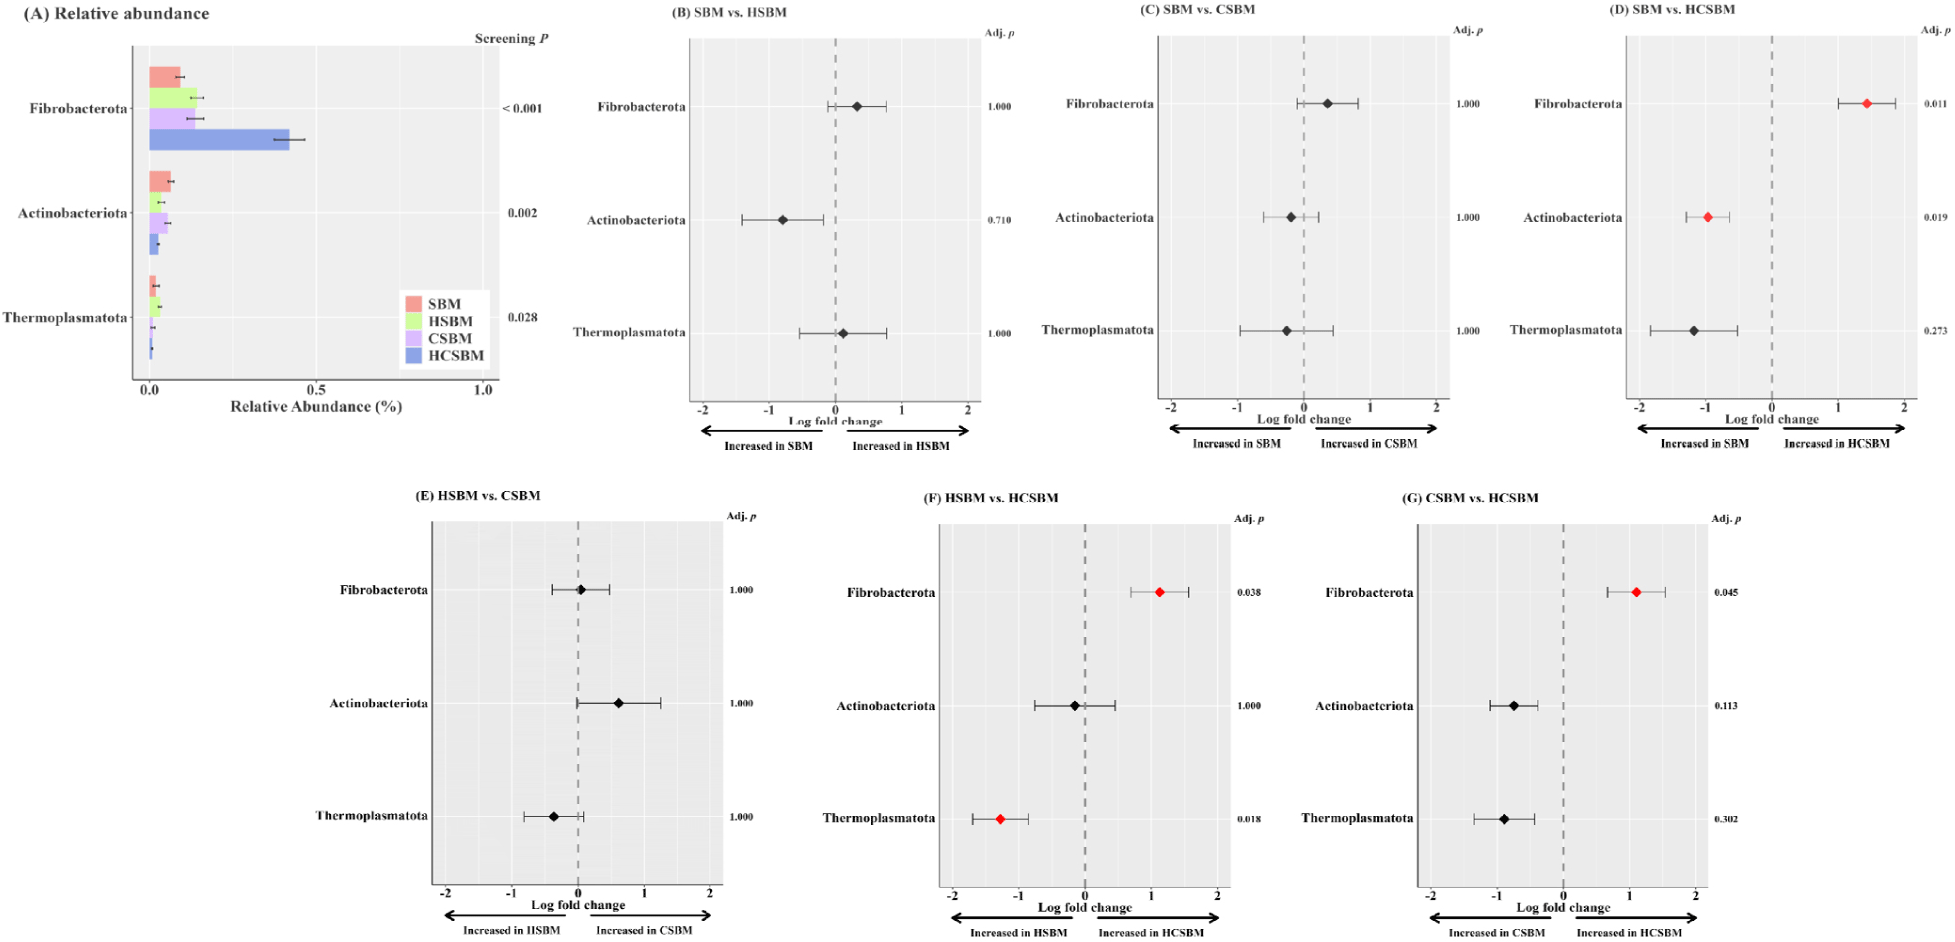
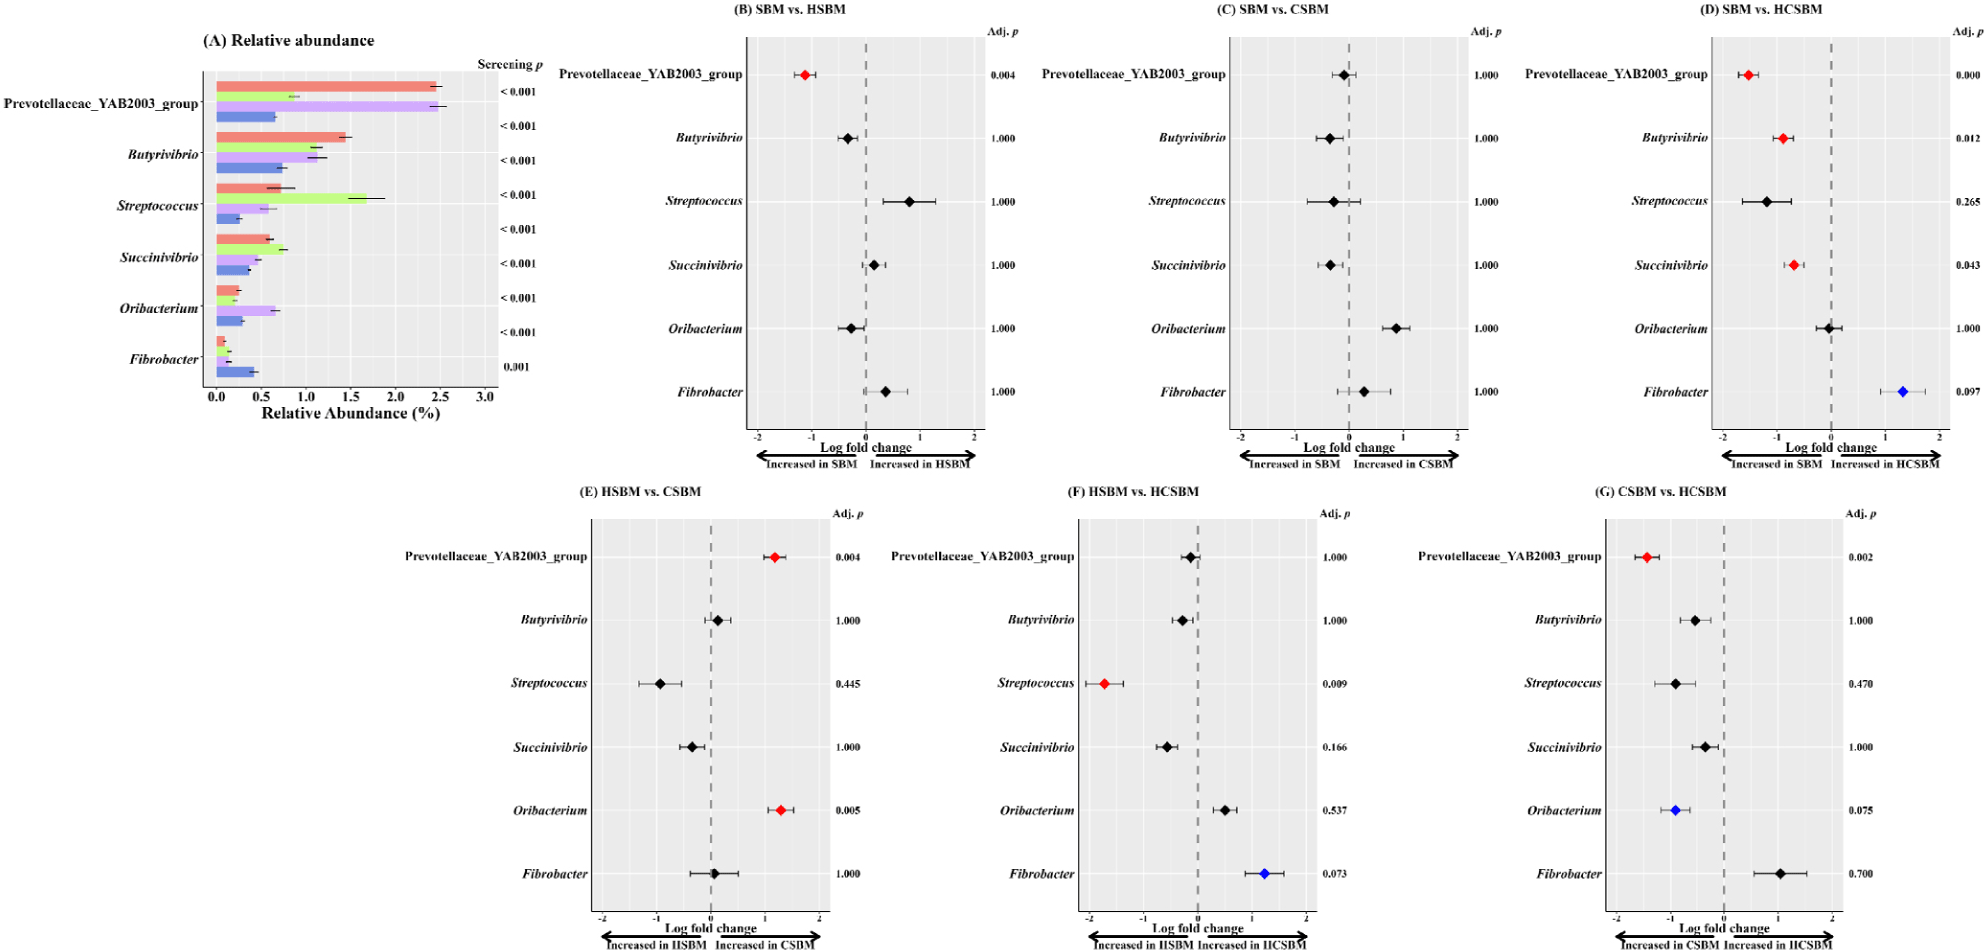
ANCOM-BC analysis was performed on rumen samples to identify differentially abundant taxa across treatments, as shown at the phylum level in Fig. 5 and the genus level in Fig. 6. At the phylum level, no significant differences in enriched taxa were observed among the SBM, HSBM, and CSBM groups. Fibrobacterota was significantly enriched in HCSBM. At the genus level, the Prevotellaceae_YAB2003_group was enriched in both the SBM and CSBM groups. Butyrivibrio and Succinivibrio were more abundant in the SBM. Oribacterium was more enriched in CSBM. Streptococcus showed more absolute abundance in HSBM. Fibrobacter showed a tendency toward increased absolute abundance in HCSBM.
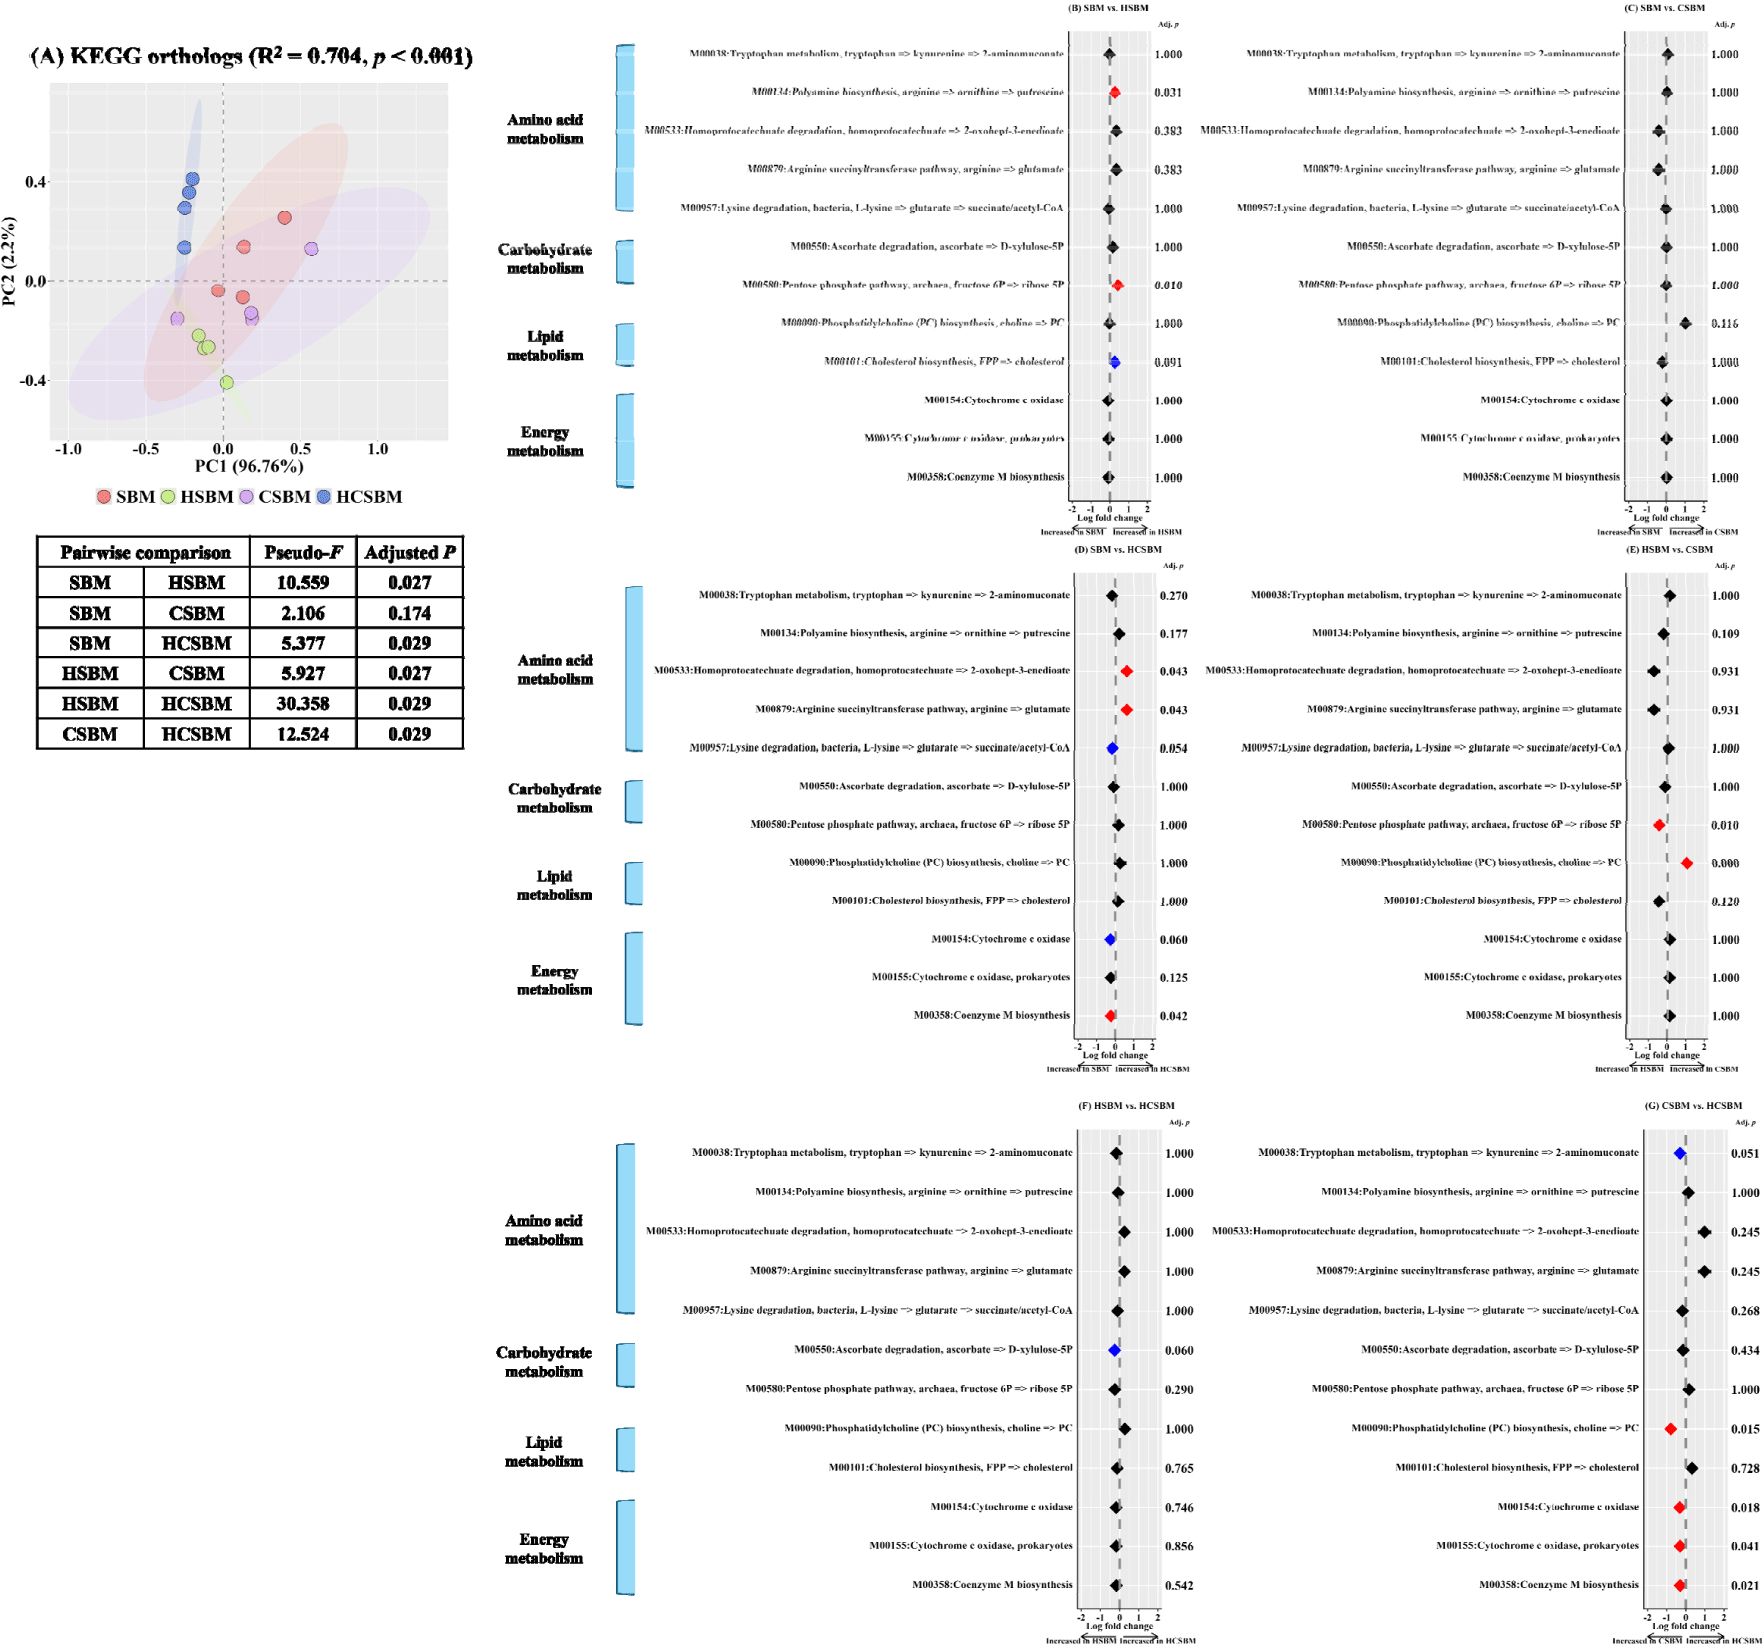
To compare the differences in microbial functional profiles, we estimated 16S rRNA gene sequencing data using PICRUSt2. Significant differences were detected in the overall distribution of microbial functions at the KEGG ortholog level (Fig. 7A; PERMANOVA, R2 = 0.704, p < 0.001). While the SBM cluster was not significantly different from the CSBM cluster, it showed distinct differences from the HSBM and HCSBM clusters (Fig. 7A, SBM vs. HSBM, Pseudo-F = 10.559, p < 0.05; SBM vs. HCSBM, Pseudo-F = 5.377, p < 0.05). The clusters of HSBM, CSBM, and HCSBM showed distinct differences (Fig. 7A, HSBM vs. CSBM, Pseudo-F = 5.927, p < 0.05; HSBM vs. HCSBM, Pseudo-F = 30.358, p < 0.05; CSBM vs. HCSBM, Pseudo-F = 12.524, p < 0.05). In pairwise comparisons, the amino acid metabolism module (M00134: Polyamine biosynthesis, arginine => ornithine => putrescine) and carbohydrate metabolism module (M00580: Pentose phosphate pathway, archaea, fructose 6P => ribose 5P) were notably enriched in the HSBM treatment compared to the SBM treatment (Fig. 7B, adjusted p < 0.05, respectively). No significant differences were observed between the SBM and CSBM groups. In the HCSBM, two amino acid metabolism modules (M00533: Homoprotocatechuate degradation, homoprotocatechuate => 2-oxohept-3-enedioate; M00879: Arginine succinyltransferase pathway, arginine => glutamate) were enriched compared to the SBM (Fig. 7D, adjusted p < 0.05, respectively). Conversely, the energy metabolism module (M00358: Coenzyme M biosynthesis) was enriched in the SBM (Fig. 7D, adjusted p < 0.05). The carbohydrate metabolism module (M00580: Pentose phosphate pathway, archaea, fructose 6P => ribose 5P) was more enriched in the HSBM than in the CSBM (Fig. 7E, adjusted p < 0.05), whereas the lipid metabolism module (M00090: Phosphatidylcholine (PC) biosynthesis, choline => PC) was more enriched in the CSBM (Fig. 7E, adjusted p < 0.01). The lipid metabolism module (M00090: PC biosynthesis, choline => PC) and three energy metabolism modules (M00154: Cytochrome c oxidase; M00155: Cytochrome c oxidase, prokaryotes; M00358: Coenzyme M biosynthesis) were significantly enriched in CSBM compared to HCSBM (Fig. 7G, adjusted p < 0.05, respectively).
DISCUSSION
Heat treatment of protein sources has been shown to enhance Maillard reactions or non-enzymatic browning, leading to an increased content of RUP [27]. Similarly, acid treatment has been suggested to induce structural alterations in proteins, potentially improving protection against ruminal degradation [28,29]. Furthermore, when heat and acid treatments are applied together, the protective effect against ruminal degradation is greater than with either treatment alone. Previous studies evaluating RPP using a combination of heat and organic acids have primarily focused on applying heat and malic acid or orthophosphoric acid [1,7,29–32]. The efficacy of these treatments can vary depending on several factors, including the type of acid and heating method used. In this study, we employed a combination of CA and heat to specifically target SBM. We hypothesized that treatment of SBM with heat and CA would reduce ruminal degradation and lower methane emissions. Wright [33] reported that ruminal microbes rapidly metabolize CA to CO2 and acetate. In our study, the highest gas production observed in the CSBM during the initial 3 h was likely due to the rapid degradation of CA. Additionally, Kg was the highest in CSBM and HCSBM, which may be attributed to the effect of CA supplementation. In vitro fermentation experiments measuring gas production have been widely used to evaluate feed degradability and rumen fermentation kinetics [34,35]. After 6 h, both HSBM and HCSBM exhibited minimal gas production. However, as fermentation progressed beyond 9 h, HCSBM consistently demonstrated the lowest gas production. Furthermore, the Vmax was significantly lower in the HCSBM group. These findings indicate that HCSBM provided the most effective protection against ruminal degradation among all treatments.
Methane production (%) was the lowest in CSBM and HCSBM. Despite these observed differences in methane production (%), our investigation into microbial ecology revealed no significant variations in the community structure between SBM and CSBM at the phylum and genus levels. Similarly, the microbial functional profiles did not differ between the SBM and CSBM. Wu et al. [36] suggested that coenzyme M plays a critical role in the archaeal methanogenic pathways as a cofactor required for the final step of methanogenesis. Notably, the enrichment of methane metabolism (M00358: Coenzyme M biosynthesis) was significantly lower in the HCSBM than in both the SBM and CSBM. The significant reduction of the M00358 module (Coenzyme M biosynthesis) in the HCSBM indicates that the combination of heat and CA treatments may inhibit methanogenic activity by limiting the availability of this crucial cofactor. Furthermore, the HCSBM group showed lower methane production (%) than the HSBM group, which was accompanied by a significant reduction in the absolute abundance of Thermoplasmatota at the phylum level. Thermoplasmatota, a phylum primarily represented in the archaeal community, is still not fully understood [37]. This reduction in key methanogenic pathways suggests that HCSBM has the potential to modulate microbial metabolism, thereby reducing methane production. However, given that there was no significant difference in methane production (%) between the CSBM and HCSBM groups, further research is required to elucidate the effect of CA supplementation on methane reduction. In particular, mechanistic studies are needed to investigate how heat treatment and CA interact to influence coenzyme M biosynthesis and other key methanogenic pathways. The lowest methane emission (mL/g DM) observed in the HCSBM may be due to a reduction in methane production (%) and decreased total gas production resulting from inhibited ruminal degradation of the substrate. The IVCPD was significantly lower in the HSBM and HCSBM groups, with no significant interaction effects observed. Heat treatment is the most effective physical protection method because it produces amino-sugar complexes via the Maillard reaction, resulting in resistance to microbial enzymatic hydrolysis [27]. Additionally, Lin and Kung [27] found that roasting soybeans at temperatures between 100°C and 160°C yielded the highest RUP content at 160°C. Consequently, it is believed that the structural changes in proteins induced by heat treatment reduce their degradation in the rumen. The concentration of NH3-N was positively correlated with IVCPD. Based on the IVCPD results, we predicted that the NH3-N concentrations would be similar in the HSBM and HCSBM. However, the NH3-N concentration was the lowest in the HCSBM. According to Russell et al. [38], fibrolytic bacteria rely exclusively on NH3-N as their nitrogen source. In our study, the absolute abundance of Fibrobacter was higher in HCSBM than in HSBM. Thus, the lower NH3-N concentration in HCSBM might be due to the increased utilization of NH3-N by Fibrobacter.
MCP was the lowest in the HCSBM group. When nitrogen is sufficiently available, the fermentation of carbohydrates in the rumen is the primary factor influencing MCP synthesis efficiency [39]. Zhang et al. [40] noted that a higher content of non-structural carbohydrates in the feed enhanced total VFA production and MCP synthesis. Similarly, Berthiaume et al. [41] confirmed that increasing non-structural carbohydrate levels in alfalfa improved microbial nitrogen synthesis in the rumen. Total VFA production, primarily resulting from the microbial fermentation of carbohydrates [42], was significantly lower in HCSBM, with a particularly marked reduction in the proportion of propionate generated by the microbial degradation of non-structural carbohydrates [43]. Therefore, the lower MCP might be due to the reduced non-structural carbohydrate content following the combined heat and CA treatment. The proportion of acetate was the highest in HCSBM. Previous studies have noted that CA supplementation increases acetate production [8,10]. HCSBM contained a significantly higher proportion of acetate than CSBM. This observation may be linked to the significant enrichment of Fibrobacterota in the HCSBM. Fibrobacterota is a key bacterial phylum responsible for cellulose degradation and primarily produces acetate and succinate as the main fermentation products [44]. Therefore, the enriched Fibrobacterota in HCSBM may have promoted fiber degradation, potentially contributing to the increased proportion of acetate production. Nevertheless, because this study did not evaluate fiber degradability, further investigation is required to establish a connection between fiber degradation and acetate production. Iso-butyrate and iso-valerate, classified as branched-chain VFA, are produced through the deamination of branched-chain amino acids and are considered indicators of protein fermentation [45]. HCSBM and HSBM exhibited the lowest CP degradation. Similarly, the proportions of iso-butyrate and iso-valerate production were the lowest between the two treatments. Moreover, no differences in amino acid metabolism were observed between HCSBM and HSBM.
Overall, our findings suggest that HCSBM reduces methane emissions by decreasing the enrichment of the methane metabolism pathway (M00358: Coenzyme M biosynthesis) and lowering the absolute abundance of the phylum Thermoplasmatota. Although HCSBM and HSBM exhibited similar IVCPD and proportions of branched-chain VFA production, the increased abundance of fiber-degrading bacteria in HCSBM may have contributed to the lowest observed NH3-N concentration. In conclusion, treating SBM with a combination of heat and CA showed the potential to reduce ruminal protein degradation and methane emissions, suggesting the need for additional in vivo studies to confirm these results.


