INTRODUCTION
Pork is the second most consumed meat globally, with chicken, pork, and beef collectively contributing to 92% of the world’s meat production [1]. Compared to traditional approaches, achieving precision management in pig farming requires the implementation of advanced methodologies like precision livestock farming (PLF) [1,2], and monitoring and recognizing pig behavior through PLF is essential for enhancing production efficiency.
The behavior of pigs serves as an indicator of their health and development, playing a crucial role in the overall productivity and economic outcomes of pork production [3–5]. Indeed, animal behavior research is booming with the synergy of sensors, artificial intelligence (AI), and big data, offering exciting insights into their farm lives [1,6]. By integrating sensors, AI, and data processing, researchers can monitor animal behavior in unprecedented detail, unlocking discoveries and improving animal welfare [7,8]. For instance, real-time monitoring of prenatal behavior characteristics and activities during parturition in sows has been achieved using three-axis acceleration [9] and pressure sensors [10], while radio frequency identification (RFID) technology is replacing conventional ear tags, facilitating precision feeding [11]. A comprehensive review has outlined diverse tail postures in pigs, correlating these with physical and emotional states as well as injury behaviors [12]. Additionally, pig postures often reflect the impact of various external factors [13–15] that are typically under the farmer’s control.
As pig farming operations grow in scale and intensity, keeping a watchful eye on individual animals becomes increasingly challenging [16]. Indeed, traditional methods and sensor technologies often rely on direct observation, which can be time-consuming, subjective, and stressful for both the pigs and the farm workers [17]. Furthermore, despite technological advances, the use of external devices—such as sensors and wearables—can lead to reduced levels of contact between animals, feed intake, and reliability of movement data, as well as altered physiological parameters (e.g., heart rate variability), and changes in behavior that reveal discomfort and potential stress [18–20]. In some sensor installations, it can even lead to the need for breeder intervention [21].
However, the rise of non-contact computer vision technology offers a promising potential solution. This innovative approach has gained popularity as researchers have effectively implemented computer vision systems to monitor the day-to-day activities of pigs. These systems demonstrate remarkable capabilities in recognizing behaviors such as aggressive behavior [22], drinking [23], mounting [24], tracking [25], and feeding [26]. Their suitability is particularly pronounced in the context of the evolving commercial pig farming model, as they enable a non-intrusive and efficient means of tracking and understanding pig behavior, providing valuable insights for improved management and productivity in large-scale pig farming operations.
Deep learning has significantly advanced the field of computer vision, particularly in the tasks of image classification and object detection [27]. Object detection is a key area in computer vision, which involves recognizing object classes and identifying their locations within an image [28]. Deep learning-based object detection is divided into two-stage and one-stage algorithms. Two-stage algorithms—such as regions with convolutional neural networks (R–CNN) [29], Faster R–CNN [30], and SPPNet [31]—first generate anchor boxes and then perform object detection; they offer high accuracy but are relatively slow. In contrast, one-stage algorithms—including you only look once (YOLO) [32], single shot detecor (SSD) [33], and CenterNet [34]—directly extract features to predict the position and class probability of objects, striking a better balance between speed and accuracy.
The use of deep learning models for object detection is now widely accepted and has led to significant breakthroughs in the field. These models are trained with large datasets and have greatly improved the speed and accuracy of object detection [35]. The application of deep neural networks, particularly CNNs, has also played an important role in achieving rapid and accurate results in object detection [36], while the availability of labeled datasets (e.g., MS COCO [37], Caltech [38], KITTI [39], and PASCAL VOC [40]) has facilitated the training of custom deep learning object detection algorithms. Additionally, commercial tools offer the capability of running trained deep learning models [41] on input rasters to detect objects and produce a feature class containing them.
Typical pig postures—including standing, lying on their sides, and sitting—are indicative of their developmental state and comfort level in their environment [42]. Furthermore, continuous monitoring of eating behavior is essential for understanding how feeding patterns influence overall health. Posture monitoring plays a vital role in the rapid detection of pig diseases, providing early identification of potential threats to their health and assessment of their comfort [43].
Posture-focused detection algorithms serve as a foundation for pig behavior analysis and management decision-making. Nasirahmadi et al. [44] proposed three deep learning-based methods for detecting the standing and lying (on the belly and the side) postures of pigs in commercial farm conditions. They utilized Faster R–CNN, SSD, and R–FCN combined with Inception V2, ResNet, and Inception ResNet V2 for feature extraction from RGB images. The experimental results indicated that the R–FCN ResNet–101 method outperformed the others, achieving higher average precision (AP) of 0.93, 0.95, and 0.92 for standing, lying on the side, and lying on the belly postures, respectively. The mean average precision (mAP) exceeded 0.93. Riekert et al. [45] designed a deep learning system for pig position and posture detection using standard 2D camera imaging, employing Faster R–CNN and Neural Architecture Search (NAS). Trained on a dataset from 21 cameras, the system achieved 87.4% AP for position and 80.2% mAP for position and posture detection. Under challenging conditions with limited similar images, an AP for position detection was maintained above 67.7%, while the mAP for position and posture detection ranged from 44.8% to 58.8%. Alameer et al. [46] detected individual postures, including the sitting posture, implementing the identification and tracking of pigs without the use of physical marks or sensors. Their study concluded that YOLOv2 surpassed Faster R–CNN in both mAP and speed, achieving an mAP above 98%.
Shao et al. [47] designed an assembled model for pig detection, segmentation, and classification using YOLOv5, DeepLabv3+, and Resnet, respectively. They achieved a classification accuracy of 92.26% for four postures. Kim et al. [48] constructed high-quality pig posture datasets for deep learning models, revealing that YOLOv2 achieved a remarkable AP of 97%. Sivamani et al. [49] trained the tiny YOLOv3 model on datasets from nine pens, outperforming two-stage deep learning models like Faster R–CNN and R–FCN, as well as machine learning models like support vector machine (SVM), with a high mAP of 95.9%. Brünger et al. [50] demonstrated effective pig contour extraction using neural networks for binary segmentation and instance segmentation; this approach achieved pixel-level accuracy for individual pig extraction, facilitating future posture recognition. Ocepek et al. [51] used Mask R–CNN for pig body segmentation to differentiate curved and straight postures; they also employed a YOLOv4 [52] model for tail detection, achieving an AP of around 90% as an alternative to Mask R–CNN.
While these pig posture detection methods exhibit high accuracy and efficiency in controlled settings, they face several limitations. Key challenges include generalization to diverse farm environments, robustness to variations in pig postures, dependency on image quality, computational complexity, the need for annotated datasets, limited adaptability to novel postures, and a lack of explainability. Additionally, the methods struggle to cope with real-time applications, and some are sensor-dependent. Addressing such limitations is crucial to achieving practical and widespread implementation of pig posture detection systems in agricultural settings, emphasizing the importance of ongoing improvements, adaptability, and the consideration of real-world challenges. Against this background and the growing need for smart pig health management, the study aimed to investigate and implement an instance segmentation approach for accurately delineating and categorizing various pig postures in a closed farm.
MATERIALS AND METHODS
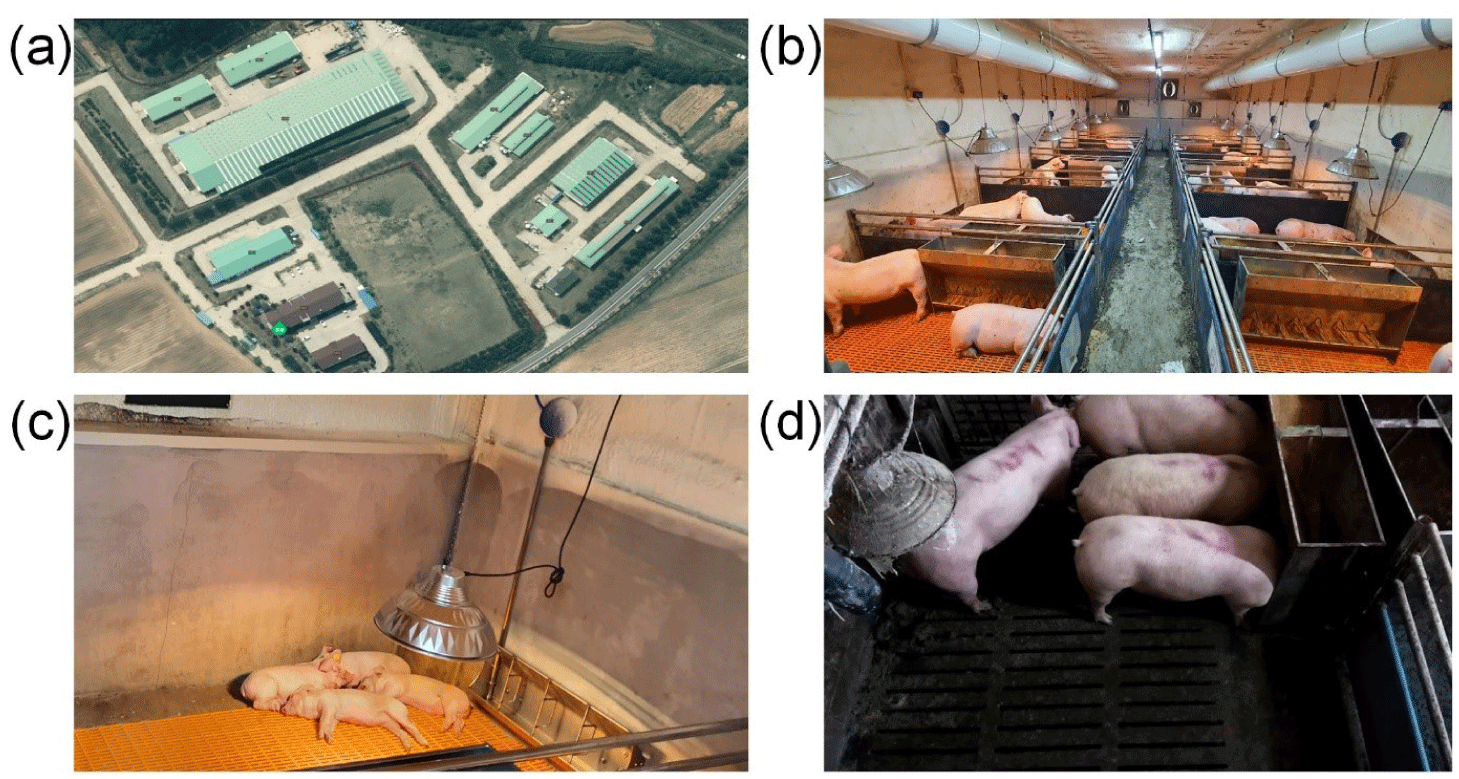
The pig farm used in this experiment was located in the Animal Resources Research Center, Chungnam National University, Cheongyang, Korea (see Fig. 1A). The pig room was 9.60 m × 5.00 m × 2.30 m. Each room contained twelve pig pens, with each pen size being 1.60 m × 2.30 m (Fig. 1B) and each pen containing four pigs. The environmental conditions (e.g., temperature, humidity, and ventilation) were maintained using an automatic control system to ensure consistency and optimal conditions for the pigs throughout the experiment.
Data were collected from the pig pens that consisted of a total of 4 weaned piglets and pigs ([Landrace × Yorkshire] × Duroc), which were used as test animals. The starting age was 3 weeks for weaned piglets and 9 weeks for pigs, with average weights of 7.02 ± 0.63 and 25.0 ± 0.27 kg, respectively. The data were gathered over three weeks (November 19, 2021–December 16, 2021) and consisted of 10 videos (top and side views) from each pen. As the intention was to identify pig postures and disease monitoring, the data were mainly collected at 11:00–13:00 and 15:00–17:00, the operative feeding times of the day [43].
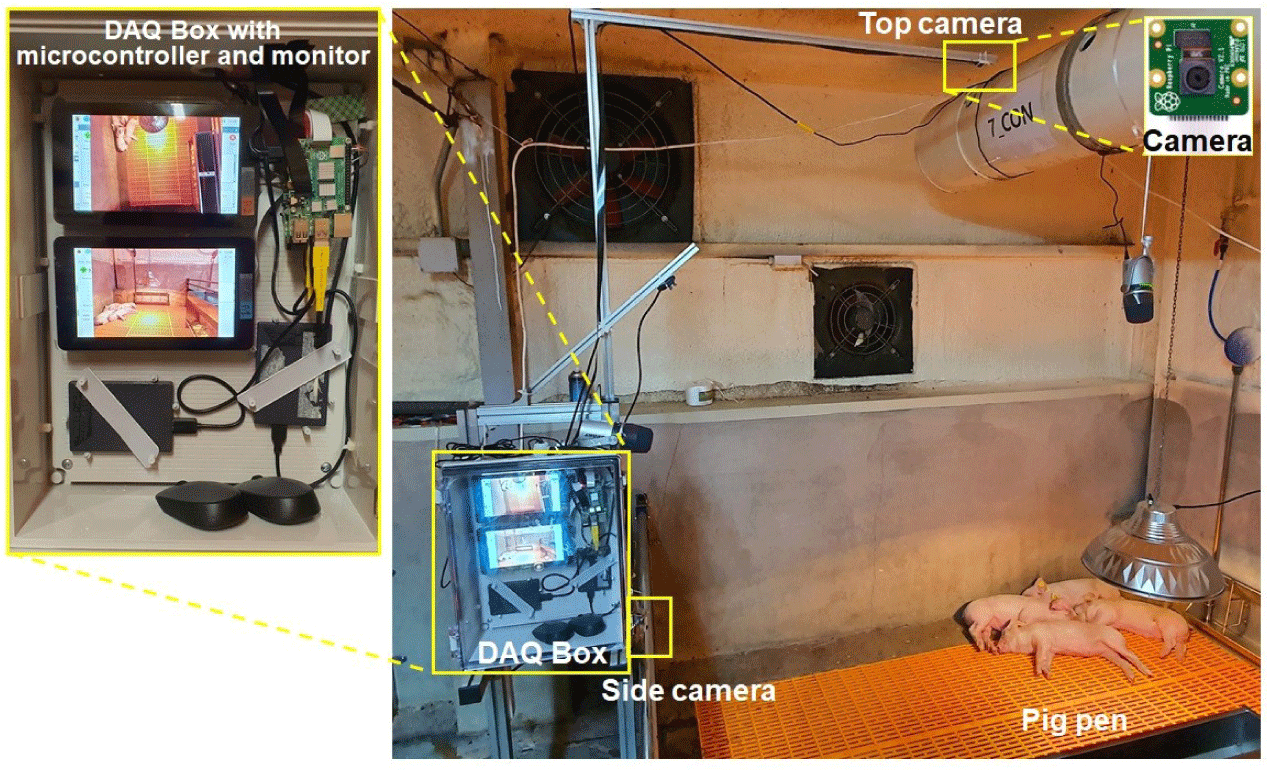
Two RGB cameras (Raspberry Pi V2, Raspberry Pi Foundation, Cambridge, UK) were used to record footage from the side and top perspectives, as shown in Fig. 2. Both cameras were attached to a commercial microcontroller board (Raspberry Pi 4B, Raspberry Pi Foundation) and a monitor. A Python-based program for automated video capture was utilized to store the video files. The system can remotely monitor and capture video or static images using a virtual network computing viewer, an open-source remote access application. It allows the device to work remotely using the microcontroller’s graphical user interface display of the microcontroller to guarantee automated viewer startup. For video capture, the cameras were mounted on the top and side of the pig pen, and the camera angle from both sides was horizontal. The obtained footage was 640 × 480 pixels at 30 frames per second. All the video data were recorded in H.264 format using an external hard disk drive linked to the microcontroller board. The specifications of the microcontroller and the camera are shown in Table 1.
As the video recordings from each location spanned 3 weeks, a random selection was made to extract one-of-a-kind images from the video files. As we collected the images during the active hours of the day, the dataset included a diverse collection of postures. The dataset was then divided into two subsets: the training set had 600 photos, while the testing set contained 160 images. In addition, a further 100 testing images were obtained from a variety of settings and were used to test the proposed method. There was no image processing prior to training to preserve the environmental features of the pig farms.
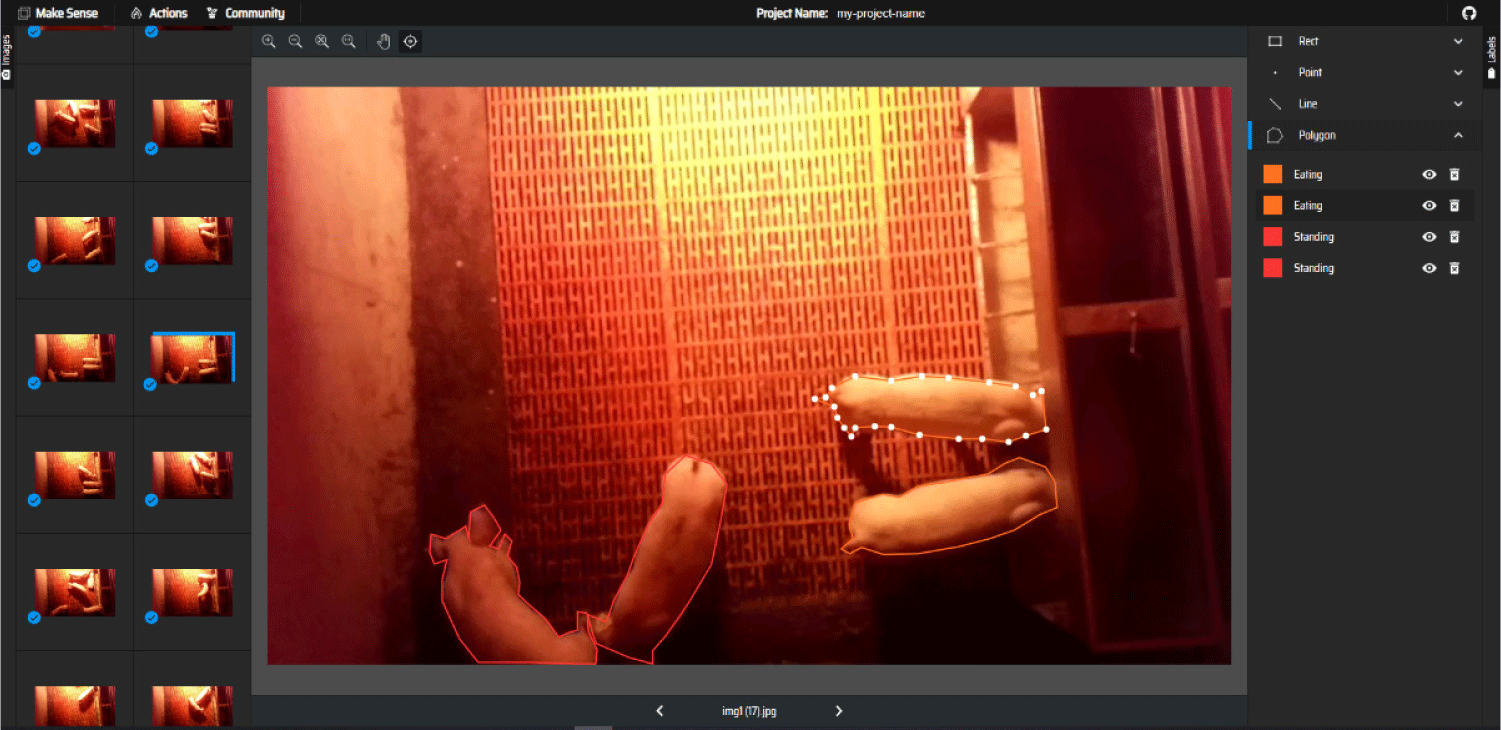
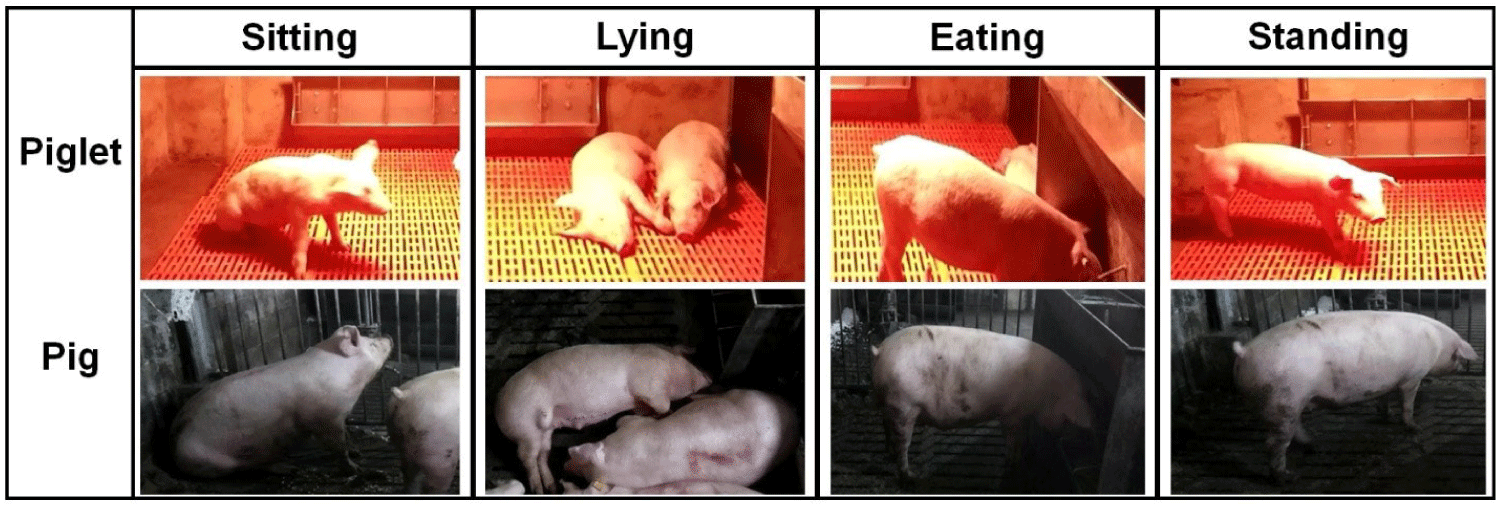
Pig postures were categorized (by positioning, orientation, and key body elements) into four individual classes: standing, sitting, lying, or eating. The annotation was done manually since the morphology of the pig posture varied across different places and times. The annotation was done using MakeSense.ai (https://www.makesense.ai), a web-based and open-source annotation tool that does not call for any specialized installation. Fig. 3 illustrates the images with manual annotation of different pig postures, while Fig. 4 demonstrates these postures in both piglets and mature pigs. The sitting posture involved the pig resting with its hindquarters on the ground and its front legs extended, while the lying posture reflected a fully reclined position, often indicating rest. The eating posture captured pigs engaging in feeding, with their heads directed toward the food source. The standing posture represented the pigs being fully upright, supported by all four legs, and was often associated with movement or alertness. This classification as shown in Table 2, which is crucial for automated monitoring and behavioral analysis, aids in understanding pig welfare and optimizing farm management practices through image-based techniques.
| Parameters | Configuration |
|---|---|
| Standing | Upright body position on extended legs, with only the hooves in contact with the floor [42]. |
| Lying | Lying on the abdomen/sternum with front and hind legs folded under the body; the udder is obscured, on either side with all four legs visible (right side, left side); or visible [42]. |
| Sitting | Partly erect on stretched front legs with caudal end of the body in contact with the floor [42]. |
| Eating | Extended legs with only the hooves in contact with the floor and head lower/towards the food pen or drinking water. |
Instance segmentation combines the principles of object detection and semantic segmentation. Like object detection, instance segmentation was designed to categorize and pinpoint all instances of objects within predefined classes. However, it extends beyond object detection by not only identifying objects but also precisely outlining each object’s boundary, generating individual masks for each object instance based on the specific pixels that belong to it.
The Mask R–CNN model [53] represents a significant advance in computer vision algorithms. It leverages a fusion of two fundamental approaches to perform instance segmentation: the Faster R–CNN object detection algorithm [30] and the Fully Convolutional Network (FCN) [54] segmentation method. In simpler terms, Mask R–CNN combines the robustness of object detection with the fine-grained segmentation capabilities of FCN. In this study, the Mask R–CNN instance segmentation model was used to address a unique challenge: recognizing and detecting various postures of pigs within a pig farm environment. The structure of the model is shown in Fig. 5.
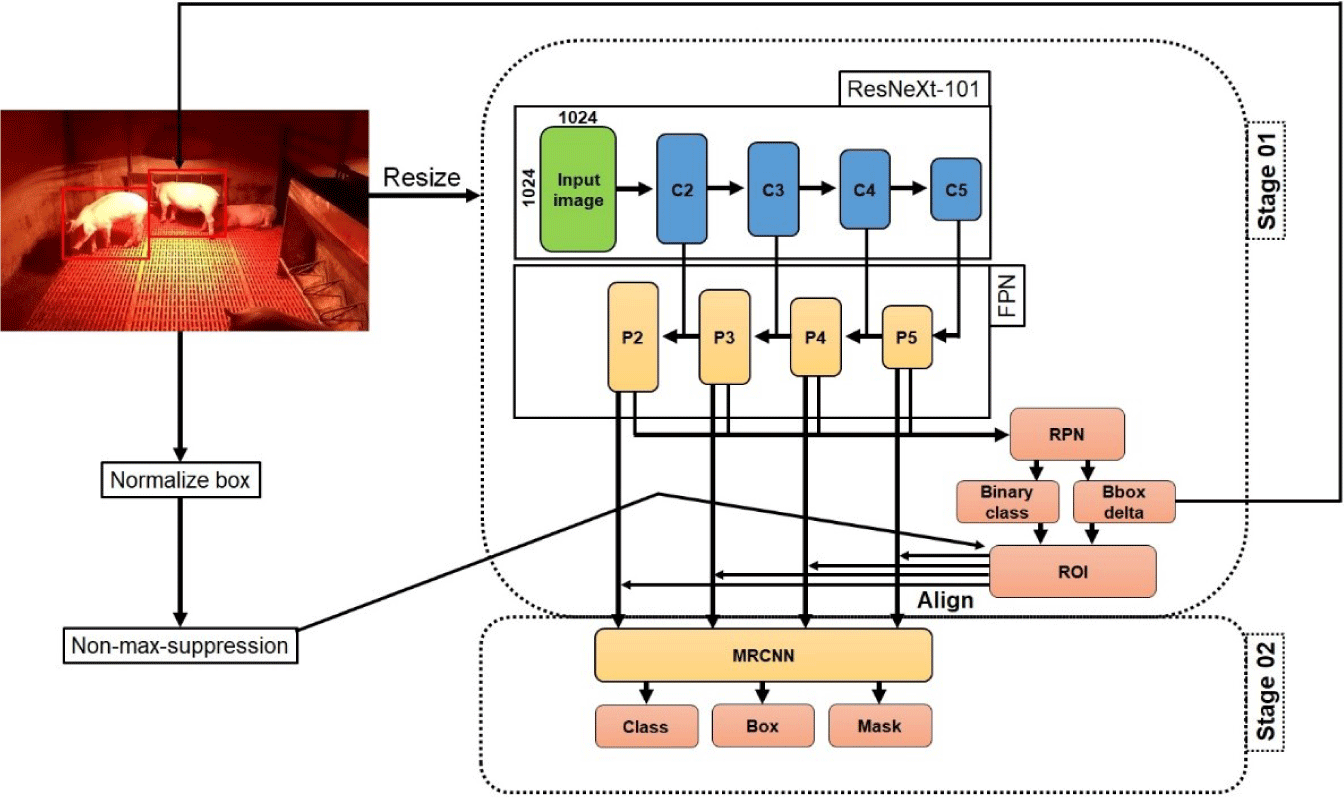
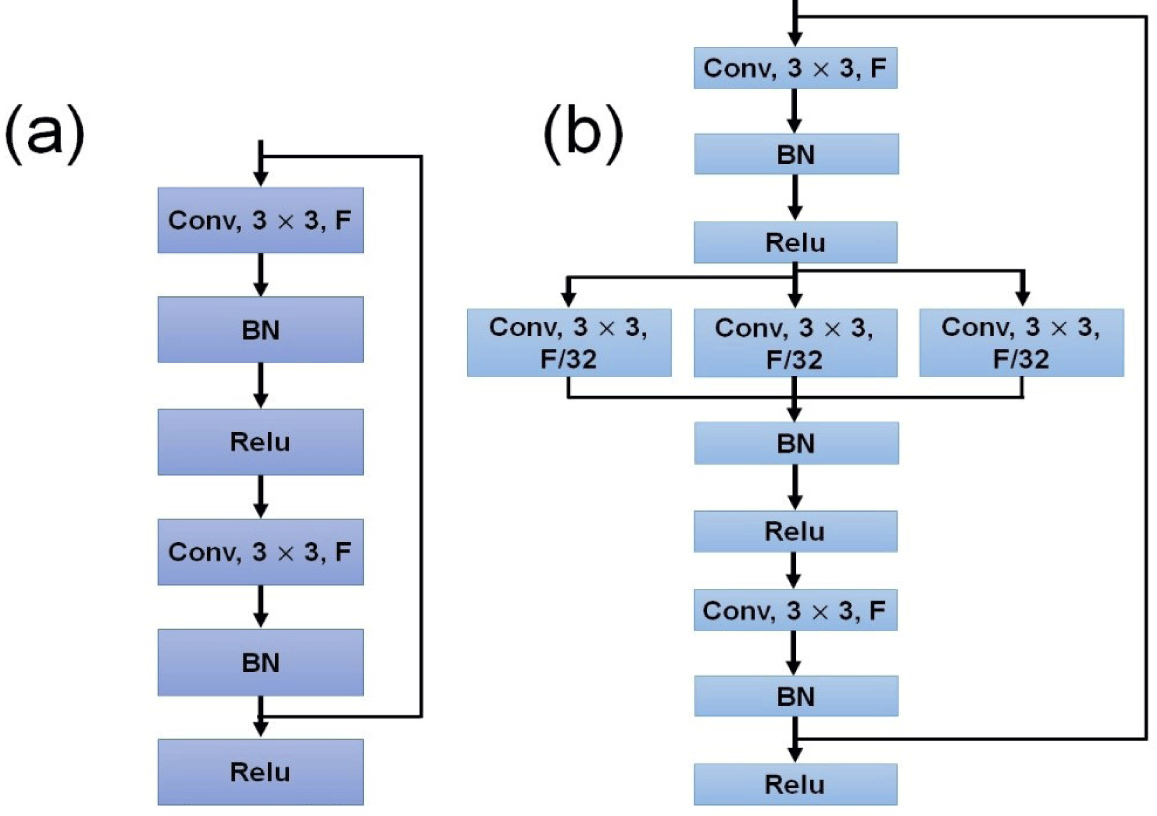
To enhance the model’s accuracy and expedite training, the ResNeXt [55] network was used to replace the traditional ResNet [56] network. ResNeXt is distinctive in being a combination of ResNet and Inception [57] architectures, as shown in Fig. 6. The feature extraction network, specifically designed for processing images of pig postures, incorporates ResNeXt and the Feature Pyramid Network (FPN) algorithms. This combination efficiently extracts both low-level features (e.g., contours of adjacent pigs, corners in low light conditions) and high-level features (i.e., the background, piglets, and pigs) from the input pig image. These features contribute to five layers of different sizes and dimensions of feature maps. By utilizing these feature maps, the FPN constructs a multi-scale feature fusion process, enhancing the model’s ability to recognize and distinguish objects in the images across different scales and resolutions.
The process begins by inputting the feature map of the pig’s posture image into the Regional Proposal Network (RPN). Using 3×3 anchor frames with varying aspect ratios, these anchors are slid across the feature map to identify regions of interest (RoI). After this initial assessment, the system determines whether the proposed frame contains an object and adjusts the parameters of the proposed bounding box accordingly. Next, a regional feature aggregation method known as RoIAlign is applied. RoIAlign avoids the need to quantify the boundary of each RoI. RoIs are divided into a grid of a*a units, with unquantified boundaries for each unit. Four coordinates are established for each unit. Subsequently, values at these positions are computed through bilinear interpolation. Finally, a maximum pooling operation is carried out. RoIAlign effectively adapts the RPN-generated regions to a fixed-size feature map with minimal error, enhancing the efficiency of detecting small targets in the process.
Mask R–CNN is a two-stage technique. The first stage generates RoIs from the RPN, while the second uses the generated RoIs to output class, box offset, and binary mask. The mask branch generates a Km2 dimensional output for each RoI, where K is the number of classes, and m is the size of the mask. The mask branch computes the output for each of the K classes, and only the masks with the classes outputted by the class branch compute the loss. The multi-task loss for each RoI is computed during training. The Mask R–CNN loss function is then calculated as follows:
where, La signifies the overall cost loss function of the model, Lc denotes the classification loss associated with the prediction box, Lb represents the regression loss pertaining to the prediction box, and Lm corresponds to the average binary cross-entropy loss.
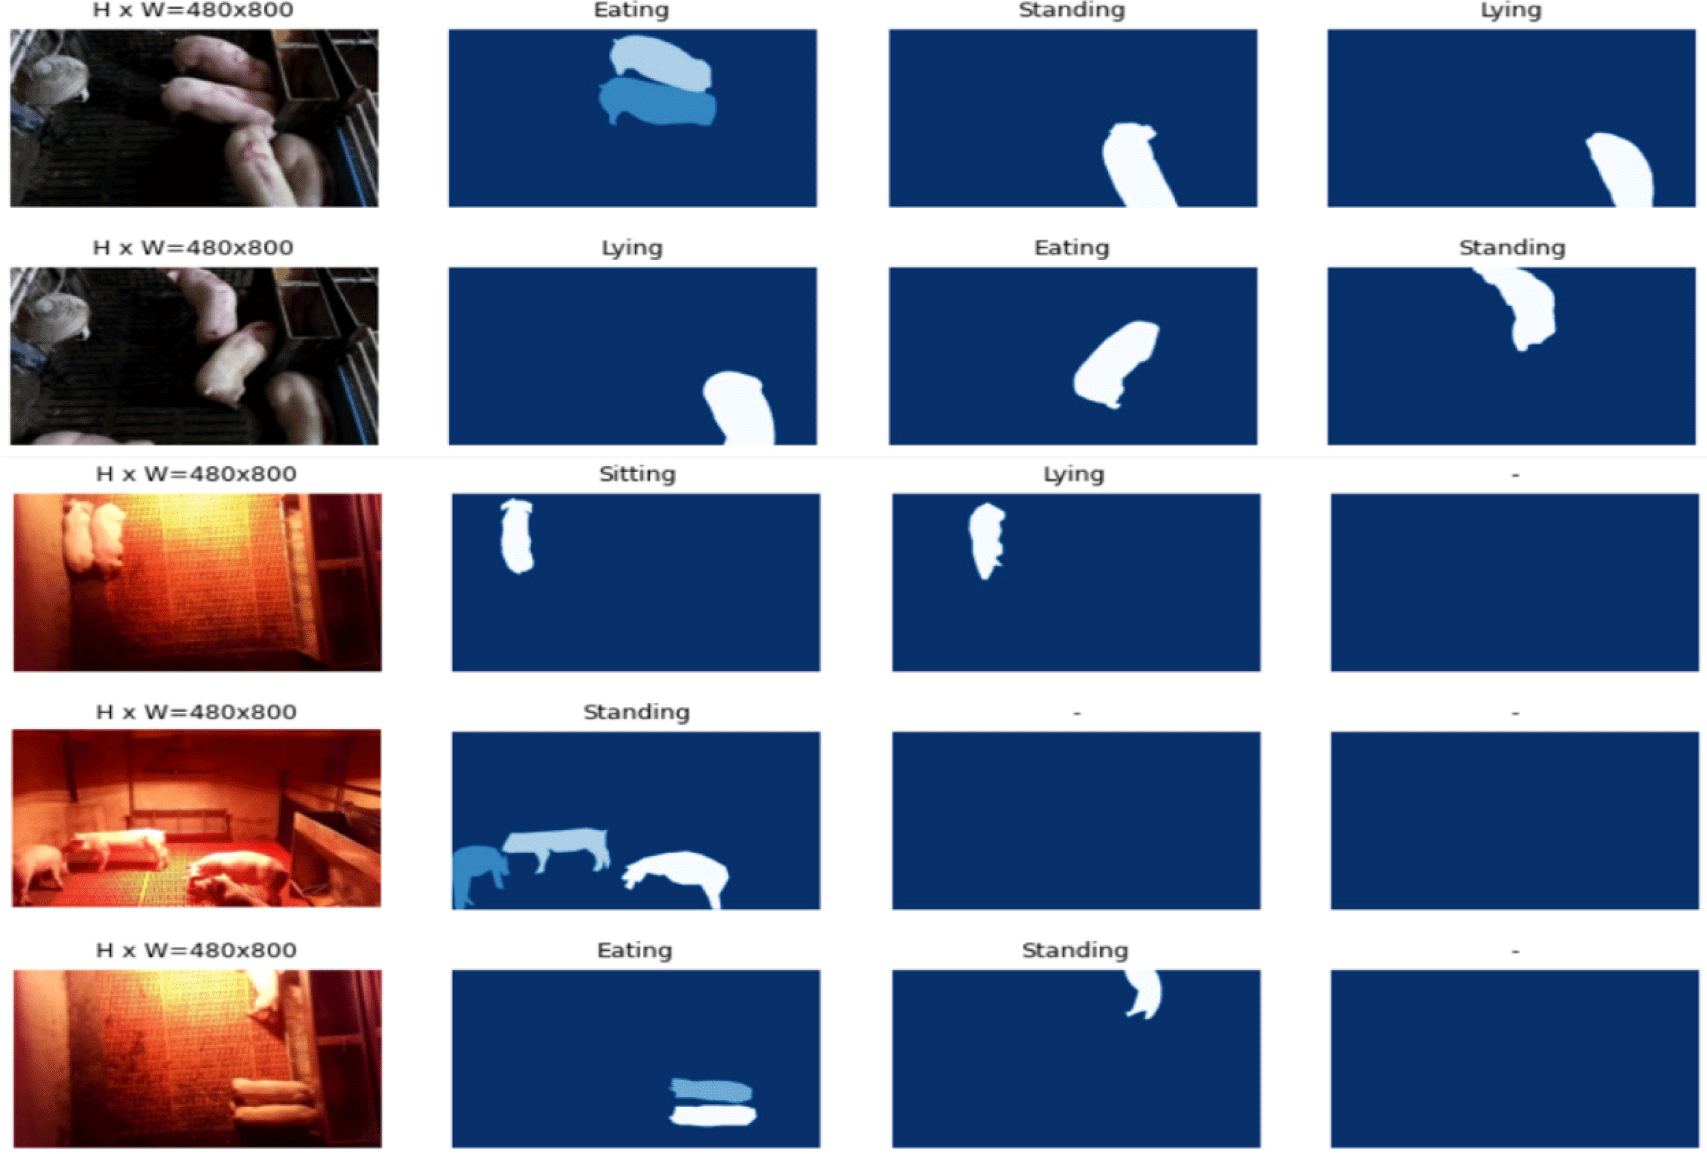
Transfer learning was the primary approach used in the model training process for the custom dataset; it is aimed at identifying objects of interest, such as pigs. Fig. 7 presents examples of feature extraction using the implemented algorithm, showing different pig postures.
In deep learning, the effectiveness of model training is often controlled by the availability of extensive datasets. However, transfer learning has emerged as a valuable technique to address the challenges posed by limited data. Transfer learning can be defined by Equation (2) as follows:
where, T(x) is the source domain, T(t) is the target domain, x is the feature space, and P(x) represents the marginal probability distribution.
This approach allowed us to use a pre-trained model on a large dataset and adapt it for our specific task, thus significantly reducing the amount of data required and minimizing the training time. This method makes use of the information by the Mask R–CNN model pre-trained on the MS COCO dataset [37], a popular benchmark for object identification tasks. These pre-trained weights provide the advantage of existing knowledge of different object classes from the model, which can be used to fine-tune it for this particular purpose.
Google Colab (Google Colaboratory, Google LLC, Mountain View, CA, USA) was used for the training process, as it gives access to a Tesla T4 GPU. However, developing deep learning models with an intricate architecture—such as Mask R–CNN—can be memory-intensive and computationally demanding. As a result of the memory limitations of the cloud platform, the training epoch was reduced from the original 1000 to 100. During training, a learning rate of 0.001 was employed. In addition, the weights of the model were updated after each epoch using a learning momentum of 0.9. By regulating the weight adjustments during training, these settings guaranteed convergence to the optimal solution. A weight decay of 0.0001 was used to maintain model generalization and avoid overfitting.
Large weights are penalized by weight decay, which effectively discourages it and encourages a more balanced model. Hyperparameter adjustment was used to guarantee the stability of the training. Several hyperparameters were adjusted to obtain the best possible model performance within the limited 100 epochs. This process involved modifying the batch size, learning rate, optimizer selection, padding settings, and filter choices for the model configuration. These hyperparameters, which were carefully tuned to optimize the model’s efficacy, are crucial to the convergence and performance of deep learning models.
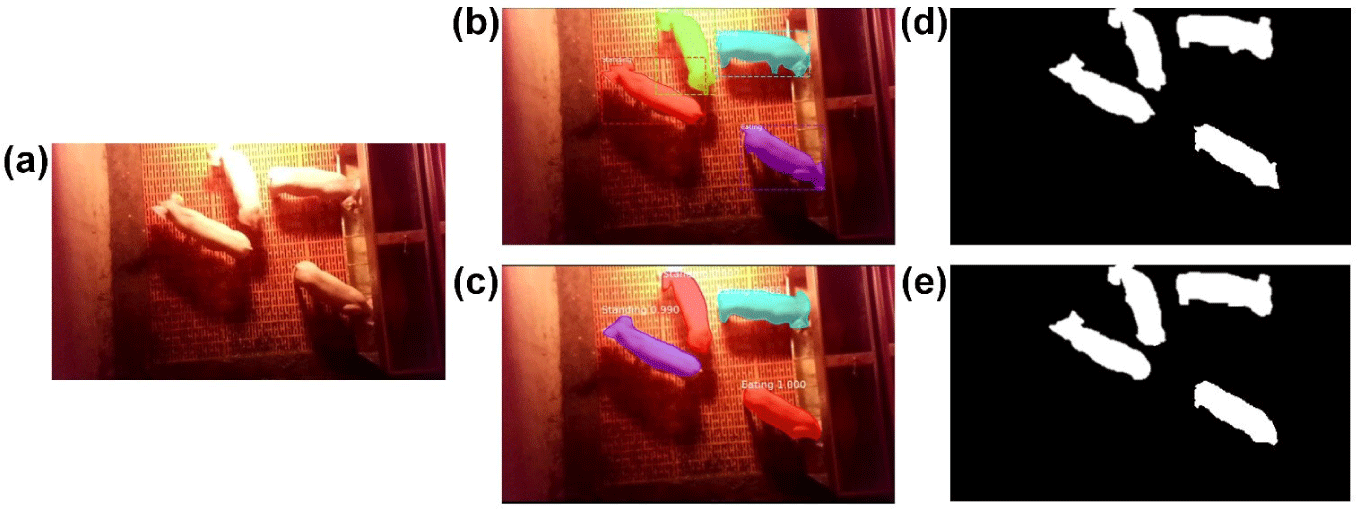
The weight estimation algorithm utilized image processing techniques to analyze masked RGB images. The MATLAB 2021a image processing toolbox (The MathWorks, Natick, MA, USA) was used to complete this image processing task. RGB images were converted to grayscale, reducing their complexity while retaining the intensity of light and considering hue and saturation. A binary mask was then applied to isolate the pig from the background, resulting in a binary image where the pig was represented as a white silhouette against a black background (as shown in Fig. 8). The algorithm counted the total number of white pixels in this binary image, which corresponded to the area occupied by the pig. This pixel count was then used in a pre-determined formula or model to estimate the pig’s body weight based on the relationship between pixel area and weight derived from empirical data. This approach enabled accurate weight estimation without the need for direct physical measurement.
Four common evaluation metrics for object detection—precision, recall, AP, and mAP—were used to validate the proposed methods. Intersection over Union (IoU) quantifies the overlap between two bounding boxes by comparing their intersection to their union in object detection. This ratio is a critical parameter in evaluating predictive accuracy: the prediction box is considered accurate if the IoU exceeds a specified threshold. The IoU for a ground truth box and a prediction box is computed by dividing their intersection by their union, as follows:
Precision is the proportion of accurately predicted boxes within a class to the total predicted boxes in that class. The formula is as follows:
where, TP is the number of prediction boxes with an IoU greater than or equal to the defined threshold, and FP is the number of prediction boxes with an IoU less than the threshold.
Recall is the ratio of accurately predicted boxes within a class to the total ground truth boxes in that class. The formula is as follows:
where, FN represents the number of undetected ground truth boxes.
AP approximates the area under a Precision–Recall curve for a specific class, ranging from 0 to 1. In practice, the Precision–Recall curve is smoothed by taking the maximum precision value on the right side of each point. The AP is calculated using the following formula:
where, Rn and Rn–1 are the recall values at the nth and (n–1)th threshold, and Pn is the precision value at the nth threshold. In this study, the AP value used was 0.5 with a fixed IoU threshold of 0.5. These parameters allow for a focused evaluation of precision and recall of the model at that particular threshold, which can be valuable for understanding its behavior under specific conditions; the average value of all results is taken as the final result.
mAP is a widely used performance metric in object detection, calculated as the average of the AP over all detected classes. The formula for mAP is given by:
where, n is the number of classes and APi is the average precision for class i. The mAP provides a comprehensive measure of the model’s accuracy across multiple classes, making it a valuable metric for evaluating object detection models.
RESULTS
Model studies have demonstrated that the number of iterations significantly impacts the outcomes of training results. Key metrics, such as training and validation loss, are crucial for understanding the performance and progress of a Mask R–CNN model, or indeed any machine learning model. Fig. 8 illustrates the training and validation loss and accuracy curves for the model. The model was trained for 100 epochs, with each epoch comprising 1,000 steps.
Over the course of 100 epochs, the training loss value decreased from 1.94 to 0.52. Similarly, the validation loss value decreased from 1.32 to 0.44, as shown in Fig. 9. The reduction in training loss indicates that the model becomes increasingly better at fitting the training data, achieving noticeable stability after around 75 epochs. This trend suggests that the model effectively learns to make more accurate predictions based on the training data. Lower validation losses signify an improvement in the model’s performance on new, unseen data, which is a critical indicator of its capability for generalization (beyond the training set).

Fig. 10 illustrates the mAP of the posture detection model on the validation set, with mAP@50 and mAP@50:95 metrics showing continuous improvement and convergence to higher accuracies as epochs increased. The mAP@50 metric rapidly increased in the initial epochs, reaching around 0.7 by epoch 20, and then improved more slowly, fluctuating between 0.85 and 0.9 from epochs 40–100. Similarly, mAP@50:95 showed a rapid initial increase, reaching around 0.6 by epoch 20; it then rose gradually, fluctuating between 0.75 and 0.8 from epochs 40–100. These trends indicated high precision under both metrics, with mAP@50 performing better at a less strict IoU threshold.
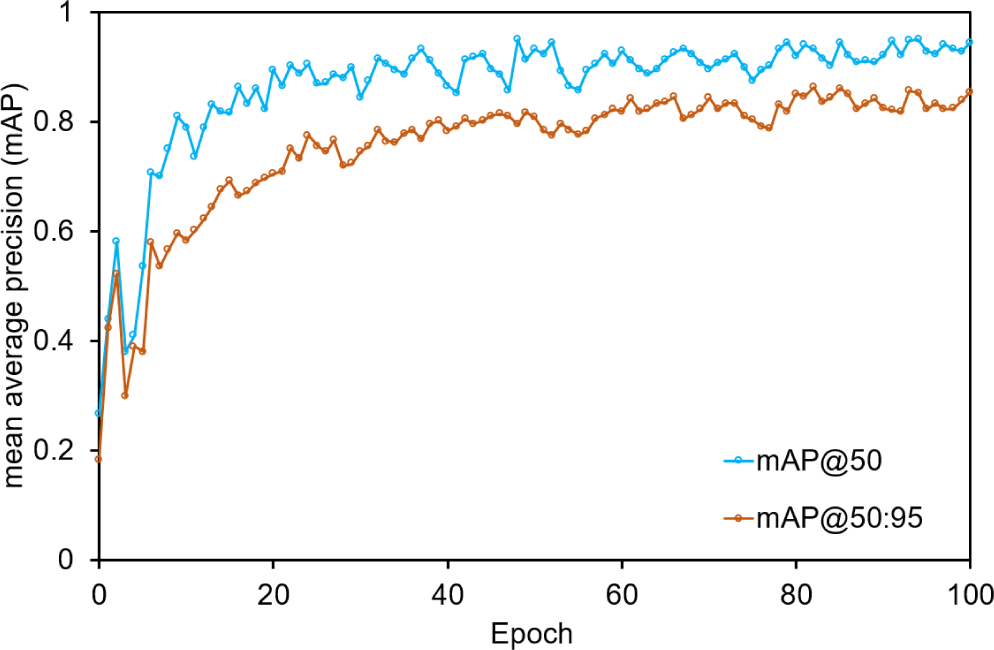
The convergence of both metrics suggested consistent model improvement with training, and the improved mask R–CNN model demonstrated high accuracy, which was particularly evident in the higher convergence of mAP@50 and reflected the effectiveness in precise object localization and classification.
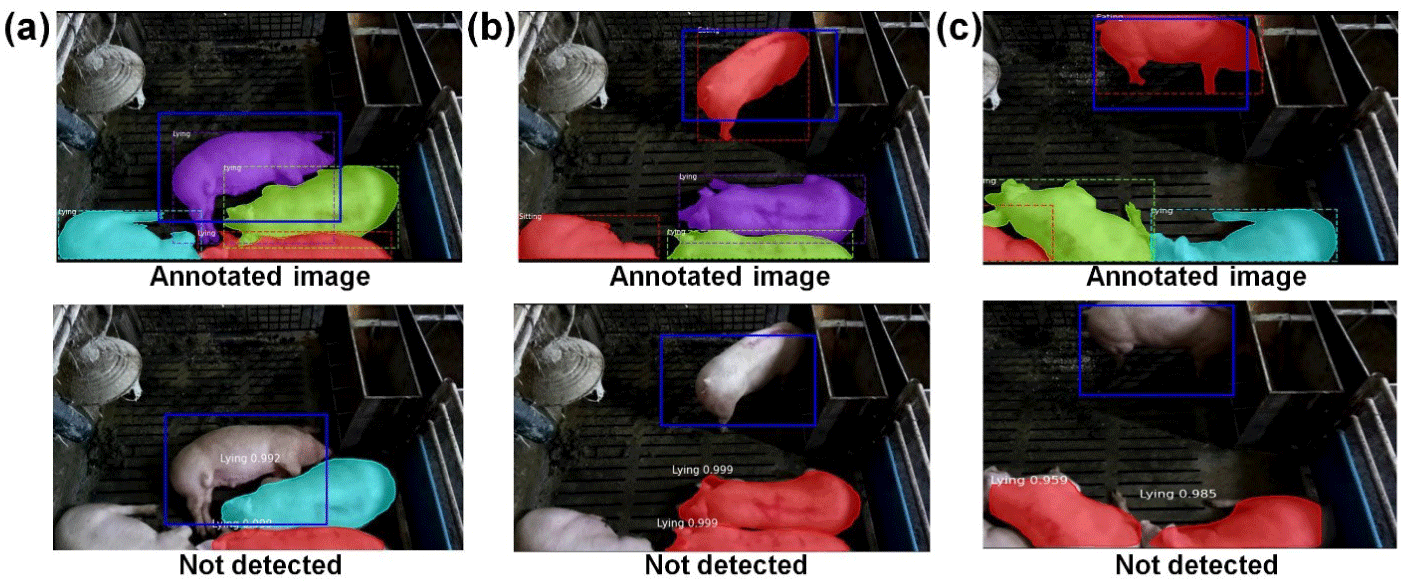
Table 3 summarizes the performance of an improved Mask R–CNN model in detecting piglet postures. Fig. 11 represents the output results of piglet posture detection and segmentation in the test images, utilizing the proposed Mask R–CNN model. The model showed strong performance across different postures, excelling at detecting standing piglets (with an F1-score of 0.962), followed closely by the detection of eating (F1-score of 0.945). The model performed slightly less well in detecting sitting (F1-score of 0.920) and lying piglets (F1-score of 0.891). Sitting and lying postures might exhibit more significant visual overlap than standing or eating, making it challenging for the model to differentiate between them (as shown in Fig. 12). For instance, a piglet lying on its side might be mistakenly classified as sitting, as shown in Fig. 12A. The average recall, precision, and F1-scores across all postures were 0.923, 0.937, and 0.930, respectively, suggesting that the improved Mask R–CNN model performed well overall in detecting piglet postures, particularly for standing and eating behaviors. While the performance was slightly lower for sitting and lying postures, the overall results were promising, and the model could be a valuable tool for applications such as piglet monitoring and behavior analysis.

| Posture | Recall | Precision | F1-score |
|---|---|---|---|
| Standing | 0.953 | 0.972 | 0.962 |
| Sitting | 0.914 | 0.926 | 0.920 |
| Eating | 0.937 | 0.954 | 0.945 |
| Lying | 0.887 | 0.896 | 0.891 |
| Average | 0.923 | 0.937 | 0.930 |
Table 4 summarizes the performance of an improved Mask R–CNN model in detecting postures among the older group of pigs, while Fig. 13 represents the output results of posture detection and segmentation in the test images utilizing the proposed Mask R–CNN model. The model demonstrated strong performance across various pig postures, particularly excelling at detecting standing pigs (with an F1-score of 0.967), followed closely by eating (F1-score of 0.947). The model performed slightly less well in detecting sitting (F1-score of 0.912) and lying pigs (F1-score of 0.884). As for the piglets, the lower performance in detecting sitting and lying postures could be due to greater visual overlap between these postures, which is challenging for the model to differentiate. The average recall, precision, and F1-scores across all postures were 0.921, 0.935, and 0.928, respectively, indicating that the improved Mask R–CNN model performed well overall in detecting pig postures and demonstrated high accuracy and reliability, particularly for standing and eating behaviors.
| Posture | Recall | Precision | F1-score |
|---|---|---|---|
| Standing | 0.961 | 0.973 | 0.967 |
| Sitting | 0.907 | 0.918 | 0.912 |
| Eating | 0.935 | 0.960 | 0.947 |
| Lying | 0.881 | 0.887 | 0.884 |
| Average | 0.921 | 0.935 | 0.928 |

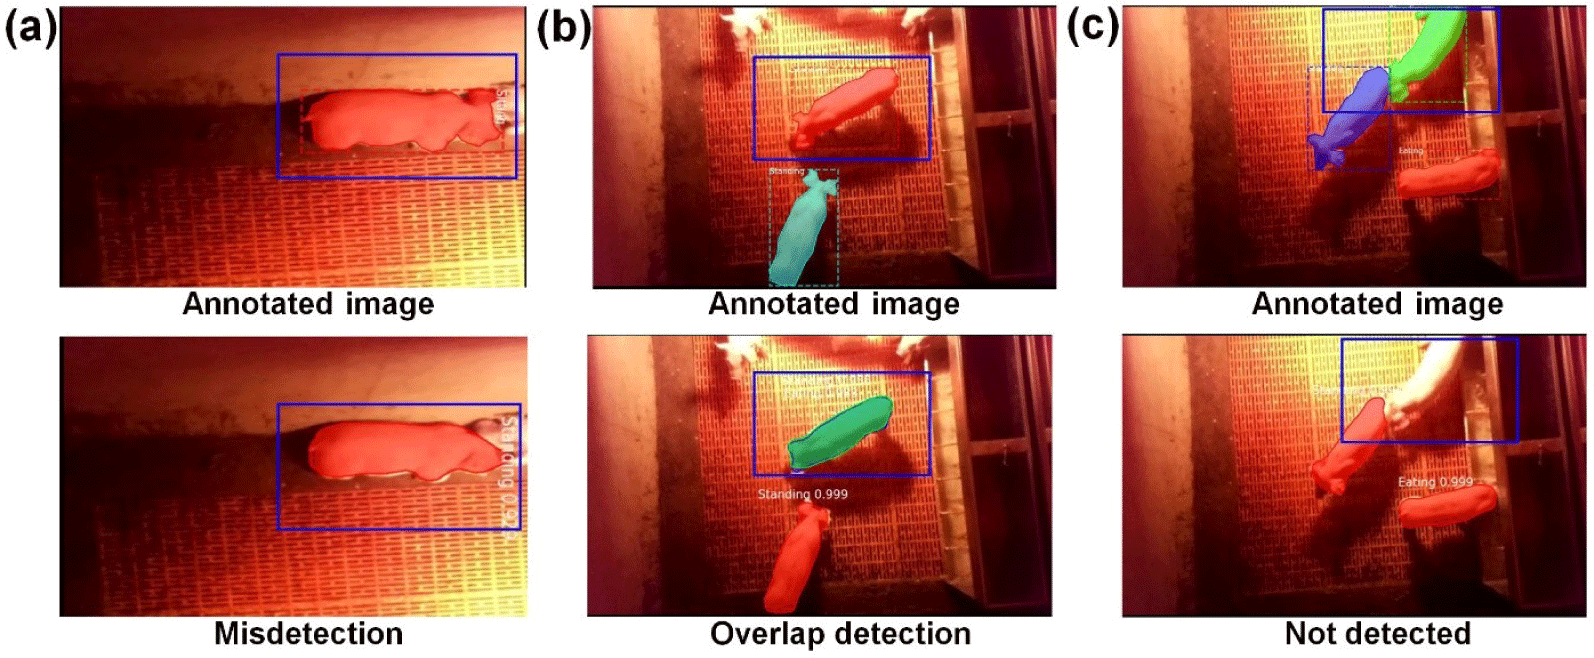
However, there were some limitations of the Mask R–CNN model in accurately detecting and segmenting piglet postures in the test images, as shown in Fig. 14. Specifically, the model’s performance was suboptimal, as evidenced by the blue rectangles drawn around the piglets, which highlight areas where the model failed to correctly identify and delineate the posture of the piglets. This failure could be due to insufficient training data, variability in piglet postures, or the viewing angle from the camera. Nonetheless, despite slightly lower performance for sitting and lying postures, the overall results were promising, and they suggest that the model could be a valuable tool for applications such as pig monitoring and behavior analysis.
The implementation of the proposed Mask R–CNN model enabled the monitoring and analysis of postural behaviors of pigs within a farm environment. The primary target was to provide continuous surveillance of pig postures, which is crucial for optimizing their health and farm conditions based on real-time animal activity data. To achieve this, five consecutive days of video footage were processed by the model, allowing it to classify and quantify the frequency of the four specific postures (i.e., standing, sitting, lying, and eating). The outcomes of this analysis are presented in Fig. 15, which shows the average posture detection from the video data spanning an entire 24-hour cycle (from 06:00 to 06:00 the following day) to capture the variability in pig behaviors across different times of the day. The model detected and recorded the number of postures in real time and saved these posture counts continuously in text files, facilitating further analysis.
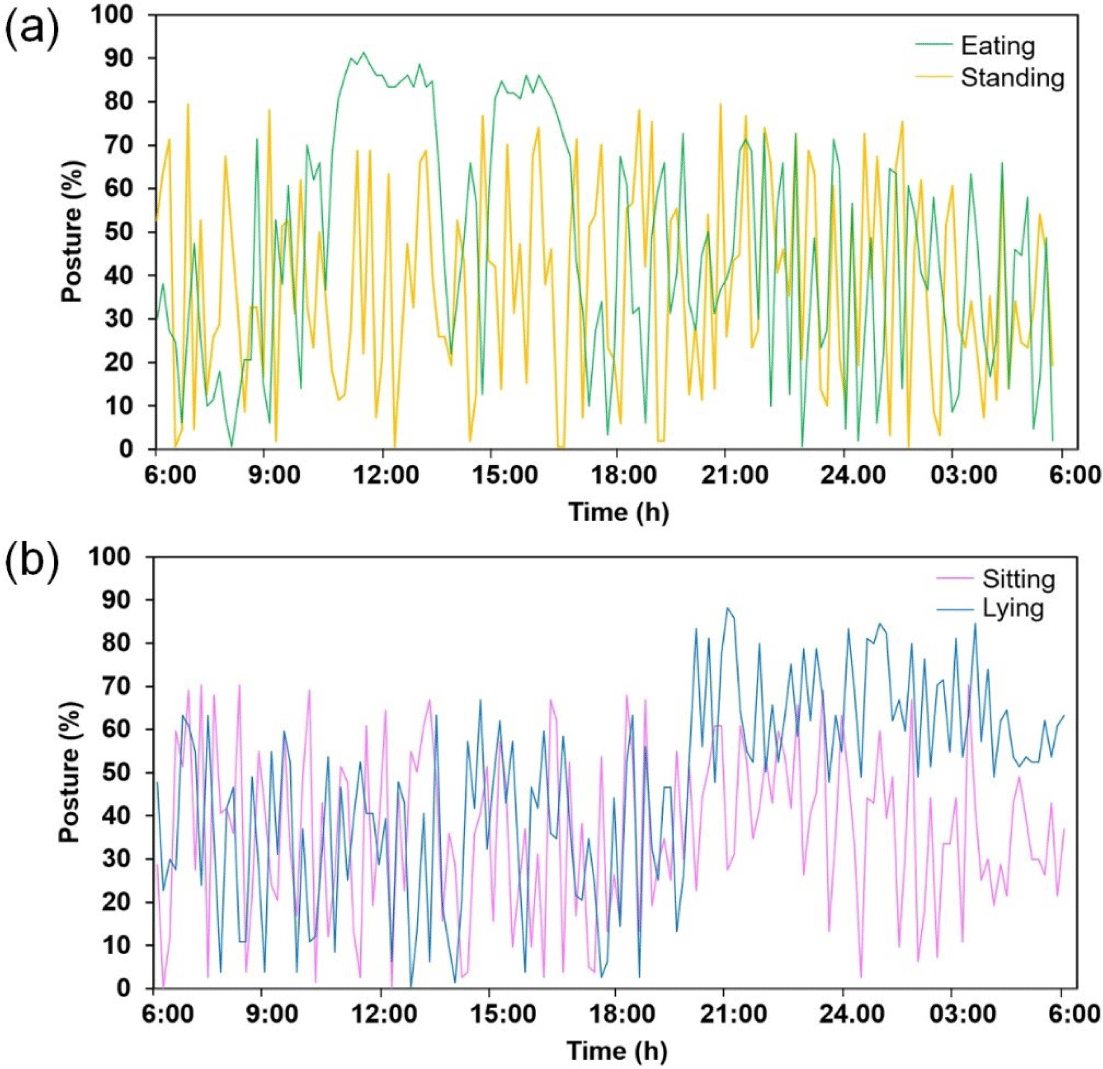
The scoring diagrams (derived from the posture detection data) demonstrated the effectiveness of the model in continuously monitoring the postural activity of group-housed pigs within the farm environment. In particular, the graph representing eating postures highlighted notable peaks during feeding times (see Fig. 15A), and the one showing the standing posture highlighted periods of increased activity, such as when pigs were inspected by the farmer. These graphs indicate that the model can accurately correlate posture changes with specific events and activities under farm conditions.
The patterns observed in the lying and sitting postures (Fig. 15B) provide valuable insights into the well-being of pigs. The automated scoring method, enabled by the Mask R–CNN model, offers a significant advantage in the early detection of potential health and welfare issues in pig farms. For instance, deviations in the typical lying or sitting behavior patterns could serve as early indicators of conditions such as lameness or the occurrence of tail-biting incidents, which are important welfare concerns. Moreover, the increased duration of lying could forecast incipient sickness or disease in pigs. By continuously monitoring such postural changes, farmers can receive timely alerts regarding potential problems, enabling timely intervention and management.
Moreover, the integration of this posture detection system with farm management software could lead to a more proactive approach to managing farm environmental conditions. For example, temperature and ventilation adjustments could be automatically triggered based on real-time data reflecting the comfort and activity levels of pigs; such interventions would not only enhance animal welfare but also improve overall farm efficiency.
In our study, the actual body weight of each pig was recorded on a weekly basis using a large precision weighing scale. These weight data were collected alongside image data captured in the farm environment. The Mask R–CNN model was employed to process these images, segmenting the pigs from the background to facilitate accurate body size estimation. From the output of the Mask R–CNN, images were selectively chosen based on criteria that ensured the entire body of the pig was visible and unobstructed, which is crucial for accurate segmentation and subsequent analysis. For each selected image, the pixel area corresponding to the segmented pig was calculated, and the pixel count (representing the projected area of the pig in the 2D image) was then used to predict the actual body weight. Strict guidelines were followed to eliminate outliers and ensure that the selected images accurately represented the body area despite the inherent variability in pixel count due to the movement and postural changes of pigs throughout the day.
The relationship between the pixel area derived from the segmented images and the actual body weight of the pigs was quantified by performing a correlation analysis. The results of this analysis (as shown in Fig. 16A) demonstrated a robust linear relationship between the pixel count and actual weight, with a coefficient of determination (R2) of 0.94 for piglets and 0.97 for pigs. These high R2 values indicate a strong predictive capability of the model, suggesting that the segmented pixel area is a reliable indicator of body weight. Fig. 16B further illustrates the temporal changes in both the actual and predicted body weights of piglets and pigs across the experiment. The close alignment between the predicted and actual weights over time emphasizes the effectiveness of the model in tracking weight changes, which is critical for monitoring growth rates and health status.

However, despite these high correlations, we acknowledge some limitations that are inherent in using 2D images for body weight estimation. The primary challenge arises from the fact that 2D images cannot capture the entire three-dimensional volume of the pig body, leading to potential inaccuracies in weight estimation. The 2D-pixel area only represents a projection of the body, and variations in posture, angle of capture, and occlusions can introduce errors. For instance, if a pig is partially turned or if parts of its body are obscured, the segmented area may not accurately reflect its true size, reducing the precision of the weight estimation.
DISCUSSION
This study evaluated a deep-learning model for segmenting and detecting pig postures using RGB cameras from both top and side views. Unlike previous work focused on top-view perspectives [14] or using multiple cameras [45], our improved Mask R–CNN model successfully detected and segmented pig postures from non-vertical and real-world camera angles. The model achieved a 93% mAP in posture detection for both piglets and pigs, demonstrating its effectiveness with adequate training data from various camera perspectives. Table 5 presents a comparison of pig posture detection using different models, highlighting their AP across four postures (standing, sitting, lying, and eating) and the mAP. The Mask R–CNN–ResNeXt 101 model—applied to both piglets and older pigs—exhibited the highest overall performance with mAPs of 0.937 and 0.935, respectively, indicating its effectiveness in accurately detecting each posture, particularly eating (0.95 for piglets, 0.96 for pigs). YOLOv5s [58,59] also demonstrated strong performance, especially in the standing (0.994), sitting (0.987), and lying (0.98) postures, with a commendable mAP of 0.868, showcasing its capability in specific posture detection. Other models—such as Yolo v3 [60] and Faster R–CNN variants [42,44,45,61,62]—showed competitive results, with mAPs ranging from 0.845 to 0.918, reflecting satisfactory reliability in posture detection tasks. Models like R–FCN+ResNet101 [42] used a top-view 3D camera to detect the lying behavior of a lactating sow across five posture types, while the SSD+Inception V2 [44] model used top-view images; they displayed moderate performance with mAPs of 0.881 and 0.693, respectively, indicating room for improvement. Despite its lower mAP of 0.802, the Faster R–CNN+NASNet [45] with a 2D camera provided a balance across postures, with notable precision in standing (0.81) and eating (0.78).
| Model | AP | mAP | References | |||
|---|---|---|---|---|---|---|
| Standing | Sitting | Lying | Eating | |||
| YOLOv5s | 99.4 | 98.7 | 98.0 | 86.8 | [59] | |
| YOLOv5 + EfficientNet | 0.67 | 0.81 | 0.899 | [60] | ||
| Yolov3 | 0.97 | 0.96 | 0.88 | 0.918 | [61] | |
| Faster R–CNN + NASNet | 0.81 | 0.78 | 0.802 | [45] | ||
| Faster R–CNN | 0.90 | 0.84 | 0.891 | [62] | ||
| Faster R–CNN + ResNet101 | 0.87 | 0.86 | 0.856 | [44] | ||
| R-FCN + ResNet101 | 0.88 | 0.88 | 0.881 | |||
| SSD + Inception V2 | 0.69 | 0.70 | 0.693 | |||
| R–FCN + ResNet101 | 0.95 | 0.90 | 0.73 | 0.872 | [42] | |
| Faster R–CNN–Resnet 50 | 0.86 | 0.91 | 0.84 | 0.845 | [63] | |
| Mask R–CNN–ResNeXt 101 (piglet) | 0.97 | 0.92 | 0.89 | 0.95 | 0.937 | This study |
| Mask R–CNN-ResNeXt 101 (pig) | 0.97 | 0.91 | 0.88 | 0.96 | 0.935 | This study |
Overall, the results highlighted advances in posture detection, with the proposed Mask R–CNN–ResNeXt 101 model leading in accuracy, while traditional models still maintained relevance with respectable performances. The comparison also highlights the significant variance in AP across different postures, emphasizing the importance of model selection based on the specific requirements in posture detection. This study confirms the Mask R–CNN–ResNeXt 101 as the top-performing model for comprehensive pig posture detection, particularly in complex scenarios such as eating, where it outperformed the others by a significant margin.
The performance of the Mask R–CNN model in real-time pig activity monitoring demonstrates its potential as a powerful tool for improving farm management practices. By processing video footage continuously over several days, the model could detect and quantify pig postures with high accuracy. This capability is vital for monitoring animal welfare, as deviations in normal postural behavior can serve as early indicators of health issues. Several other studies have also shown the potential for monitoring posture changes over time in pig farms. Image processing with a linear SVM model [12] was shown to classify pig lying postures (sternal and lateral) in commercial farming, but accuracy was hindered by image quality and caused some misclassifications. The R–FCN model [42] was used to detect and monitor pig postures in groups, aiding in climate and barn condition control; standing postures and activity peaks were noted during feeding, activity times, or farmer checks. Furthermore, using the Faster R–CNN model [45], pig lying behavior was monitored over 11 hours of video footage in a fattening pen, which revealed several activity peaks between 14.30 and 16.15 h, which corresponded to observations of aggressive behavior.
The model’s ability to correlate specific postures with farm activities, such as feeding or inspections, further demonstrates its utility in providing actionable insights. For example, detecting peaks in standing or eating behaviors during feeding times can help optimize feeding schedules and ensure that all animals access food appropriately. The application of the Mask R–CNN model in detecting and analyzing pig postures could provide a robust tool for continuous monitoring and early detection of welfare issues. The data generated by this system could be vital in optimizing farm management practices, ensuring better health outcomes for animals, and enhancing the overall sustainability of pig farming operations. However, this new method requires adaptation and evaluation across a broader range of farming conditions, potentially needing a greater number of images for model training or alternative feature extraction methods.
In the context of body weight estimation, the study also used the Mask R–CNN model’s ability to segment pigs from the background in 2D images in order to predict body weight based on pixel area. The strong linear relationship between pixel area and actual body weight—as evidenced by R² values of 0.94 for piglets and 0.97 for pigs—suggests that this method is highly reliable for weight estimation. However, the reliance on 2D projections means that the model cannot fully capture the three-dimensional volume of the pig, leading to potential inaccuracies. Variations in posture, angle of capture, and occlusions could each introduce errors in the estimated weight. Future research could mitigate these limitations by exploring the integration of 3D imaging or depth sensors—such as LiDAR or stereo cameras—to improve weight estimation by providing more accurate measurements of pig body volume than that provided by 2D images. These techniques provide a more accurate representation of body shape and size by capturing depth and spatial details, likely also leading to more accurate weight prediction. In addition, enhancing the ability of the model to handle occlusions and varying postures by incorporating advanced data augmentation techniques or using synthetic data for training could further improve its robustness in diverse farm environments.
The current study primarily focused on developing and evaluating accuracy of the improved Mask R–CNN model in posture detection and body weight estimation, demonstrating its effectiveness in monitoring pig activity. While the results indicated high precision in identifying postures and robust correlations for weight estimation, the study did not explicitly link these outcomes to potential risk factors. However, the ability to continuously monitor postural behaviors, as shown in Fig. 15, the analysis of lying and sitting postures, highlights the potential for identifying early indicators of welfare concerns, such as sickness or lameness. By detecting deviations in typical postural patterns, the system could indirectly point to risk factors like overcrowding, poor environmental conditions, or health issues.
Future research should expand on this work by systematically correlating monitored behaviors with specific risk factors, such as different diseases conditions, changes in temperature, ventilation, or feed quality, to validate its application for risk assessment. Additionally, integrating this system with farm management tools could facilitate more direct connections between detected behaviors and risk factors, enabling proactive interventions. The potential for such correlations exists in the results of this study, but explicit testing and validation remain a crucial next step to address this gap comprehensively.
CONCLUSION
The study presents a significant advance in the use of deep learning for automated pig posture recognition and detection within controlled farm environments. RGB videos were taken from piglets and pig pens over a 3-week period. By employing the Mask R–CNN model, the research achieved high accuracy in identifying pig postures (standing, sitting, lying, and eating), with an impressive mAP of 0.937 for piglets and 0.935 for pigs. These outcomes highlight the model’s potential as a powerful tool for continuous monitoring and early detection of health and welfare issues on pig farms. The ability to correlate specific postures with farm activities, such as feeding and inspections, further enhances the utility of the model in providing actionable insights for optimizing farm management practices.
Moreover, the study explored the use of the Mask R–CNN model for estimating body weight based on pixel area from 2D images, revealing a strong linear correlation with actual body weight. However, the research acknowledges the limitations of using 2D images, suggesting that future studies incorporate 3D imaging techniques or depth sensors to improve accuracy in weight estimation.
Overall, the research demonstrates the effectiveness of the Mask R–CNN model in real-time monitoring and management of pig behavior, with potential applications in improving animal welfare and farm efficiency. Further adaptation and evaluation in diverse farming conditions, as well as enhancements in imaging techniques, could pave the way for more robust and reliable systems in the future.


