INTRODUCTION
The gastrointestinal tract (GIT) is a complex ecosystem of microbial communities, and its composition influences key aspects of animal physiology, including feed efficiency, growth performance, and overall health [1–5]. In pigs, the gut microbiota undergoes a rapid shift during the weaning period as piglets transition to solid feed. This transition is accompanied by various biological stressors that can disrupt gut and immune function, potentially leading to reduced health and growth performance [6,7]. These challenges pose a significant economic burden on the swine industry, prompting ongoing research into effective mitigation strategies. One such approach involves the use of prebiotics [8–10].
Prebiotics are biological activators that modulate the composition of gut microbiota in animals, offering various benefits to livestock health and productivity [11]. They are non-digestible fibers that selectively stimulate the growth and activity of beneficial bacteria in the GIT, thereby exerting positive effects on the host. To be classified as a prebiotic, a substance must meet the following criteria [12,13]: (1) it must resist hydrolysis by gastric acid and mammalian digestive enzymes, as well as absorption in the upper GIT; (2) it should be fermentable by intestinal microbiota; and (3) it must selectively stimulate the growth or activity of intestinal bacteria associated with health benefits. Prebiotics are categorized based on their molecular structure and type into groups such as β-glucans, non-digestible oligosaccharides, inulin, resistant starch, and pectin. These compounds are metabolized by various intestinal bacteria, leading to the production of beneficial metabolites [14]. The fermentation of prebiotics by specific bacteria contributes to the improvement of the gut microbial community, enhances the host’s growth performance, and strengthens the intestinal epithelial barrier, thereby promoting overall health [15,16]. Owing to these functional properties, prebiotics are used as feed additives to promote growth and health in the swine industry, with fructooligosaccharides (FOS) and inulin being among the most commonly used additives. Fructans, such as FOS and inulin, both composed of one glucose molecule and multiple fructose units, are classified by their degree of polymerization (DP): inulin typically has a DP of 2 to 65 (average DP ≥ 10), while FOS has a DP of 2 to 9 [17]. These compounds are primarily obtained from natural sources such as chicory roots (Cichorium intybus) [18,19], and FOS can also be produced by enzymatically breaking down inulin into shorter chains [20]. Because they are hydrolyzed by β-fructosidase, they cannot be digested by the mammalian digestive system and are instead fermented primarily by Bifidobacterium and other gut microbiota [19]. FOS and inulin have been reported to enrich Lactobacillus and Bifidobacterium populations in the gastrointestinal mucosa of weaned piglets, with FOS having a relatively greater impact in the upper intestine compared to inulin due to differences in metabolic timing related to chain length [21]. Gut bacteria metabolize the hexoses from prebiotics to produce hydrogen, methane, carbon dioxide, short-chain fatty acids (SCFAs; such as acetate, propionate, and butyrate), and organic acids (such as lactate, succinate, and pyruvate). Some bacteria further utilize these fermentation byproducts as an energy source to produce final metabolites [22].
Despite the known biological benefits of FOS and inulin, detailed information on the specific effects of these fructans in pigs remains limited. Therefore, we examined the effects of fructan supplementation on the growth performance, immunity and gut microbiome of weaned piglets.
MATERIALS AND METHODS
Animal experiment in this study was approved by the Institutional Animal Care and Use Committee of Chungnam National University, Daejeon, South Korea (approval no. 202103A-CNU-077). A total of 72 weaned piglets ([Yorkshire × Landrace] × Duroc, 28 days of age) with an initial average body weight (BW) of 7.3 ± 0.76 kg were used in a four-week experiment. Each treatment group consisted of 6 replicate pens, with four castrated pigs per pen, randomly assigned based on their initial BW. The experimental dietary groups were organized as follows: CON (control group; basal diet), FOS (FOS group; CON + 0.3 % FOS), and INU (Inulin group; CON + 3 % inulin). The fructans used in the experiments were FOS (CAT No. Orafti®P95, BENEO) and inulin (CAT No. Orafti®HP, BENEO). The basal diets were formulated to meet the nutrient requirements for weaned piglets as recommended. The ingredient composition and nutrient content of the diets are shown in Table 1. To assess nutrient digestibility, 0.5 % chromium oxide, an indigestible marker, was added to the feed from Day 22 for a period of seven days [23]. Throughout the 4-week experimental period, pigs were housed in pens equipped with single-sided stainless steel self-feeders and had ad libitum access to water and feed.
During the experimental period, BW and feed intake were recorded weekly to calculate the average daily gain (ADG), average daily feed intake (ADFI), and the feed efficiency ratio (G:F).To evaluate nutrient digestibility, fecal samples were collected directly via rectal massage from six pigs per group (18 pigs in total) over a three-day period starting on Day 26. During this period, feces containing chromium oxide were collected three times. The collected samples were pooled with previously collected feces and stored at −80°C until the end of the experiment.
After the experiment, the fecal samples were thoroughly dried at 70°C for at least 24 hours and then ground for analysis [24]. Crude protein (CP), chromium, dry matter (DM), and gross energy content in both the feed and feces were measured. The apparent total tract digestibility (ATTD) of nutrients was calculated using the following formula [25]:
For blood analysis, blood samples were collected from 6 pigs per group (1 pig per pen) on Days 0, 7, and 14. Blood collection was performed using heparin and K3EDTA tubes (VACUETTE® TUBE, Greiner Bio-One) to obtain both serum and whole blood. The collected blood was centrifuged at 4°C at 3,000 rpm for 15 minutes to separate the serum, which was then stored at –80°C. Whole blood was analyzed for hemoglobin (HGB), hematocrit (HCT), red blood cell (RBC) count, white blood cell (WBC) count, and platelet (PLT) levels using a Scil Vet abc hematology analyzer (Scil Animal Care Company) as part of a complete blood count (CBC) test.
The ELISA kit for cortisol (R&D Systems), and ELISA kits (Koma Biotech) for other biomarkers including Tumor Necrosis Factor-α (TNF-α), Immunoglobulin G (IgG), Immunoglobulin M (IgM), and Immunoglobulin A (IgA) were used according to the manufacturer’s instructions to quantify serum biomarker levels.
For gut microbiome analysis, fecal samples were collected from five pigs per group on Days 0 and 28, resulting in a total of 30 fecal samples from 15 pigs. Samples were collected directly from the rectum and transferred to sterile 1.5 mL microcentrifuge tubes, then stored at −80°C until further analysis. Total DNA was extracted from 200 mg of feces per sample using the QIAamp Fast DNA Stool Mini Kit (QIAGEN), following the manufacturer’s instructions. The concentration and purity of the extracted DNA were measured using a Colibri Microvolume Spectrometer (Titertek Berthold). Only DNA samples with an OD 260/280 ratio between 1.8 and 2.0 were used for downstream analysis.
For 16S rRNA gene sequencing, 799F-mod6 (5’ - CMGGATTAGATACCCKGT - 3’) and 1114R (5’ - GGTTGCCTCGTTGC - 3’) primers were used to amplify the V5- V6 hypervariable regions of 16S rRNA gene [26]. The amplification mixture contained KOD One™ PCR Master Mix -Blue- (TOYOBO), a 10 pmol of each primer, and 2 μL of DNA (5 ng/µL) in a total reaction volume of 50 μL. The polymerase chain reaction (PCR) cycling conditions were as follows: initial denaturation at 98°C for 3 min, 25 cycles of 98°C for 10 s, 57°C for 5 s, and 68°C for 1 s, and a final extension at 72°C for 5 min. Amplified PCR products were purified using the Wizard® SV Gel and PCR Clean-Up System kit (Promega). Sequencing of the amplified barcoded 16S rRNA gene was performed using the Illumina MiSeq platform at Dx&Vx.
The raw 16S rRNA gene sequencing data were processed using the Quantitative Insights into Microbial Ecology 2 (QIIME2) software package for quality control, trimming, and microbial community analysis [27]. To minimize the effects of random sequencing errors, sequences were filtered based on a PHRED quality score threshold of 27 and the absence of ambiguous base calls. Using the deblur plugin, sequences were trimmed to a length of 280 bp, and amplicon sequence variants (ASVs) were inferred by reconstructing the biological sequences. Multiple sequence alignment was performed using the Multiple Alignment using Fast Fourier Transform pipeline for phylogenetic diversity analysis. Alpha diversity metrics including Observed Features, Chao1, Shannon index, and Simpson index were calculated in QIIME2. Beta diversity was assessed using both weighted (quantitative) and unweighted (qualitative) UniFrac distance metrics and visualized using principal coordinate analysis (PCoA) plots generated in QIIME2. Taxonomic assignment of ASVs was performed using the naïve Bayesian classifier trained on the Ribosomal Database Project (RDP) reference database version 19.
Growth performance, nutrient digestibility, and blood parameters were analyzed using one-way analysis of variance (ANOVA) in a randomized complete block design, with the initial BW as a block and the pen as the experimental unit. These outcomes are presented as mean ± SEM. When the ANOVA was significant, means were compared using Dunnett’s test. Analyses were performed in GraphPad Prism version 8.00 (GraphPad Software). Between-group differences in microbial community structure were assessed using analysis of similarities (ANOSIM) based on weighted and unweighted UniFrac distance matrices. Relative abundances of microbial taxa and predicted functional genes were evaluated in Statistical Analysis of Metagenomic Profiles (STAMP) software version 2.1.3 using one-way ANOVA with Tukey–Kramer post hoc comparisons for pairwise group differences. Statistical significance was set at p < 0.05.
RESULTS
Although there were no statistically significant differences in growth performance among the groups, the FOS and INU groups showed higher ADG compared to the CON group, indicating a trend toward improved growth performance with fructan supplementation. Additionally, the FOS and INU groups exhibited higher G:F than the CON group over the entire experimental period (Table 2). The ATTD of DM, energy, and CP is presented in Table 3. No statistically significant differences were observed in the digestibility of DM, energy, or CP among the groups.
| Dietary group | SEM | p-value | |||
|---|---|---|---|---|---|
| CON | FOS | INU | |||
| DM (%) | 73.99 | 78.58 | 69.01 | 2.76 | 0.594 |
| Energy (%) | 78.12 | 79.57 | 73.13 | 1.95 | 0.722 |
| CP (%) | 73.17 | 75.32 | 70.04 | 1.53 | 0.876 |
The levels of HGB, HCT, RBC, WBC, and PLT in whole blood before and after fructan supplementations are presented in Fig. 1A. No significant differences in HGB, HCT, RBC, WBC, or PLT levels were observed among the groups, and fructan supplementation did not result in any significant changes.
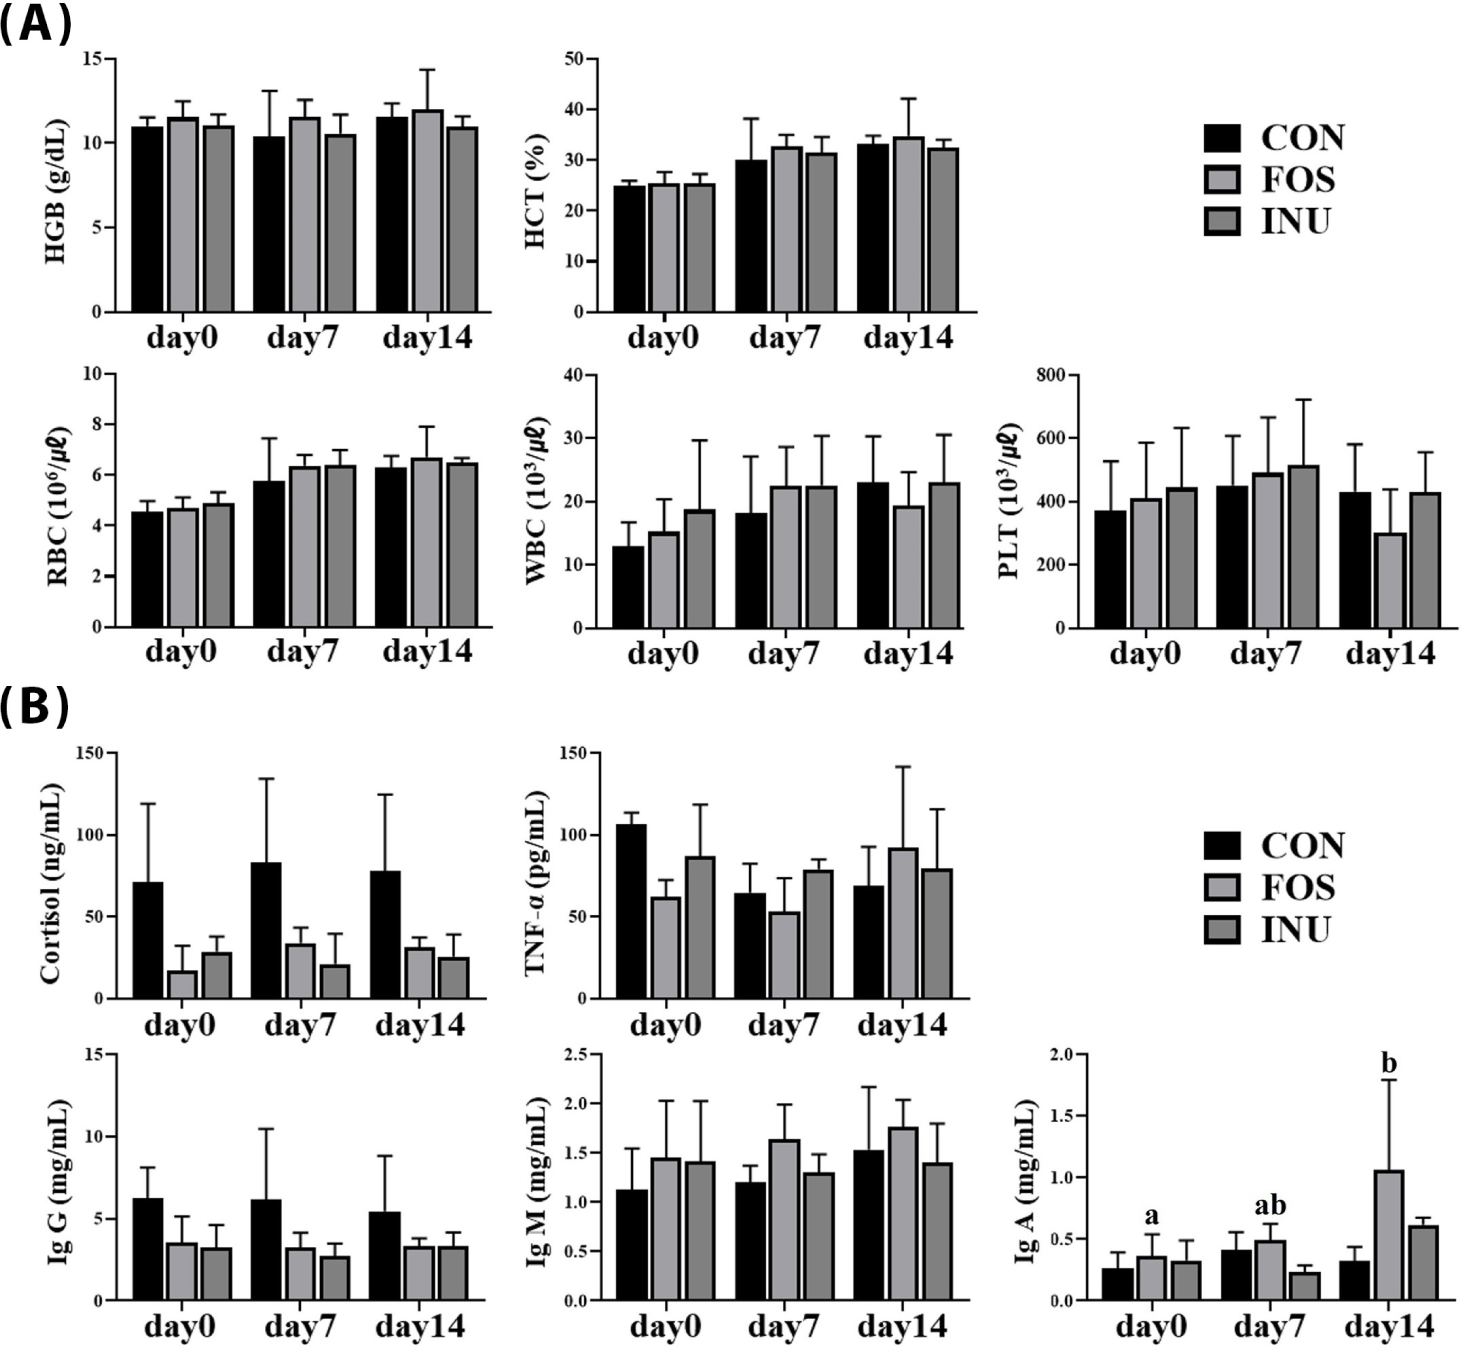
The serum concentrations of cortisol, TNF-α, IgG, IgM, and IgA are shown in Fig. 1B. Cortisol, TNF-α, IgG, and IgM levels showed no significant differences among the groups, nor were they significantly affected by fructan supplementation. Interestingly, IgA concentrations increased on Day 14 in the fructan supplemented groups, with a statistically significant increase observed in the FOS group (p < 0.05).
After quality filtering, the 16S rRNA gene of fecal samples generated a total of 1,677,793 reads ranging from 24,324 to 104,436 reads per sample.
Alpha diversity was assessed using Observed Features and Chao1 (representing species richness), as well as Shannon and Simpson indices (representing species evenness), to evaluate changes in the fecal microbial community following fructan supplementation (Figs. 2A, 2B, 2C, and 2D). At the beginning of the experiment (Week 0), no significant differences in alpha diversity were observed among the groups. However, by the end of the experiment (Week 4), the INU group showed significantly lower Observed Features and Chao1 values compared to the CON and FOS groups (p < 0.05). Additionally, the Shannon index in the INU group tended to be lower than in the FOS group (p = 0.095). No significant differences in Simpson index values were observed among the groups at Week 4.
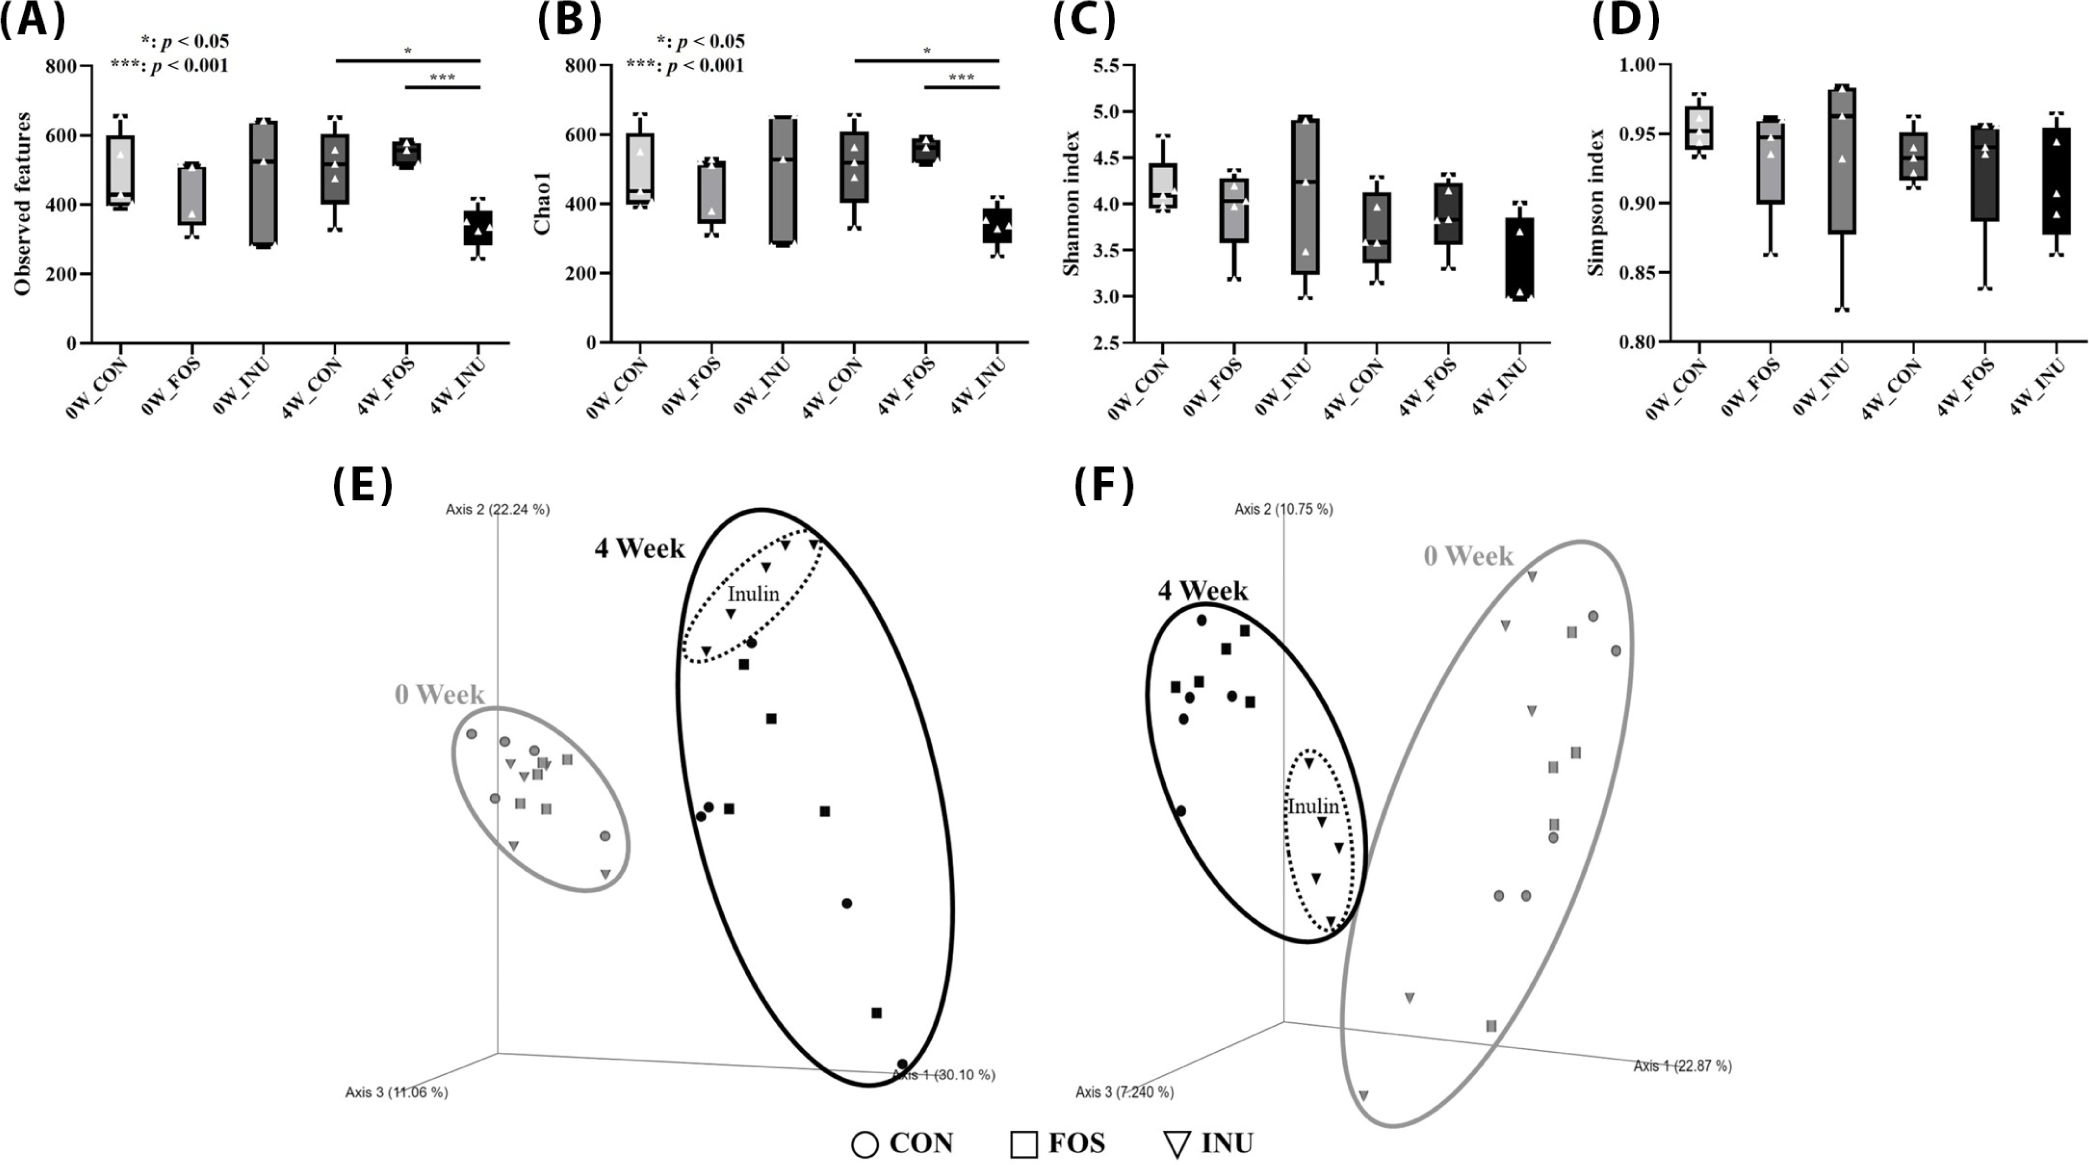
PCoA plots based on both weighted and unweighted UniFrac distances illustrated the microbial community structure for each dietary group at week 0 (0W) and week 4 (4W; Figs. 2E and 2F). At 0W, the microbial communities of all groups clustered similarly. However, at 4W, the INU group formed a distinct cluster, clearly separating from the CON and FOS groups, which remained closely clustered. The UniFrac distances at week 4, as determined by ANOSIM, yielded R-values of 0.6497 (weighted) and 0.8923 (unweighted), indicating that the microbial community structure in weaned piglets was significantly altered by diet (p = 0.001).
Differences in the relative abundances of the gut microbial community composition in weaned piglets following fructan supplementation were examined at the phylum, family, and genus levels (Fig. 3). At the phylum level, the fecal microbiota of all weaned piglets was dominated by Bacillota, comprising more than 70% of the total composition (Fig. 3A). At Week 0 (0W), all groups showed similar microbial profiles, with Pseudomonadota, Bacteroidota, Spirochaetota, and Fusobacteriota being the most abundant, while 13 other phyla collectively accounted for approximately 2% of the total microbiota. By Week 4 (4W), the phylum Pseudomonadota constituted 20.2% and 21.4% of the microbial communities in the CON and FOS groups, respectively, with 15 other phyla collectively representing 3.3% and 4.3% of the total composition. In contrast, the INU group was predominated by Actinomycetota (15.7%) and Bacteroidota (3.2%), while the remaining 14 phyla accounted for only 1.1% of the total.
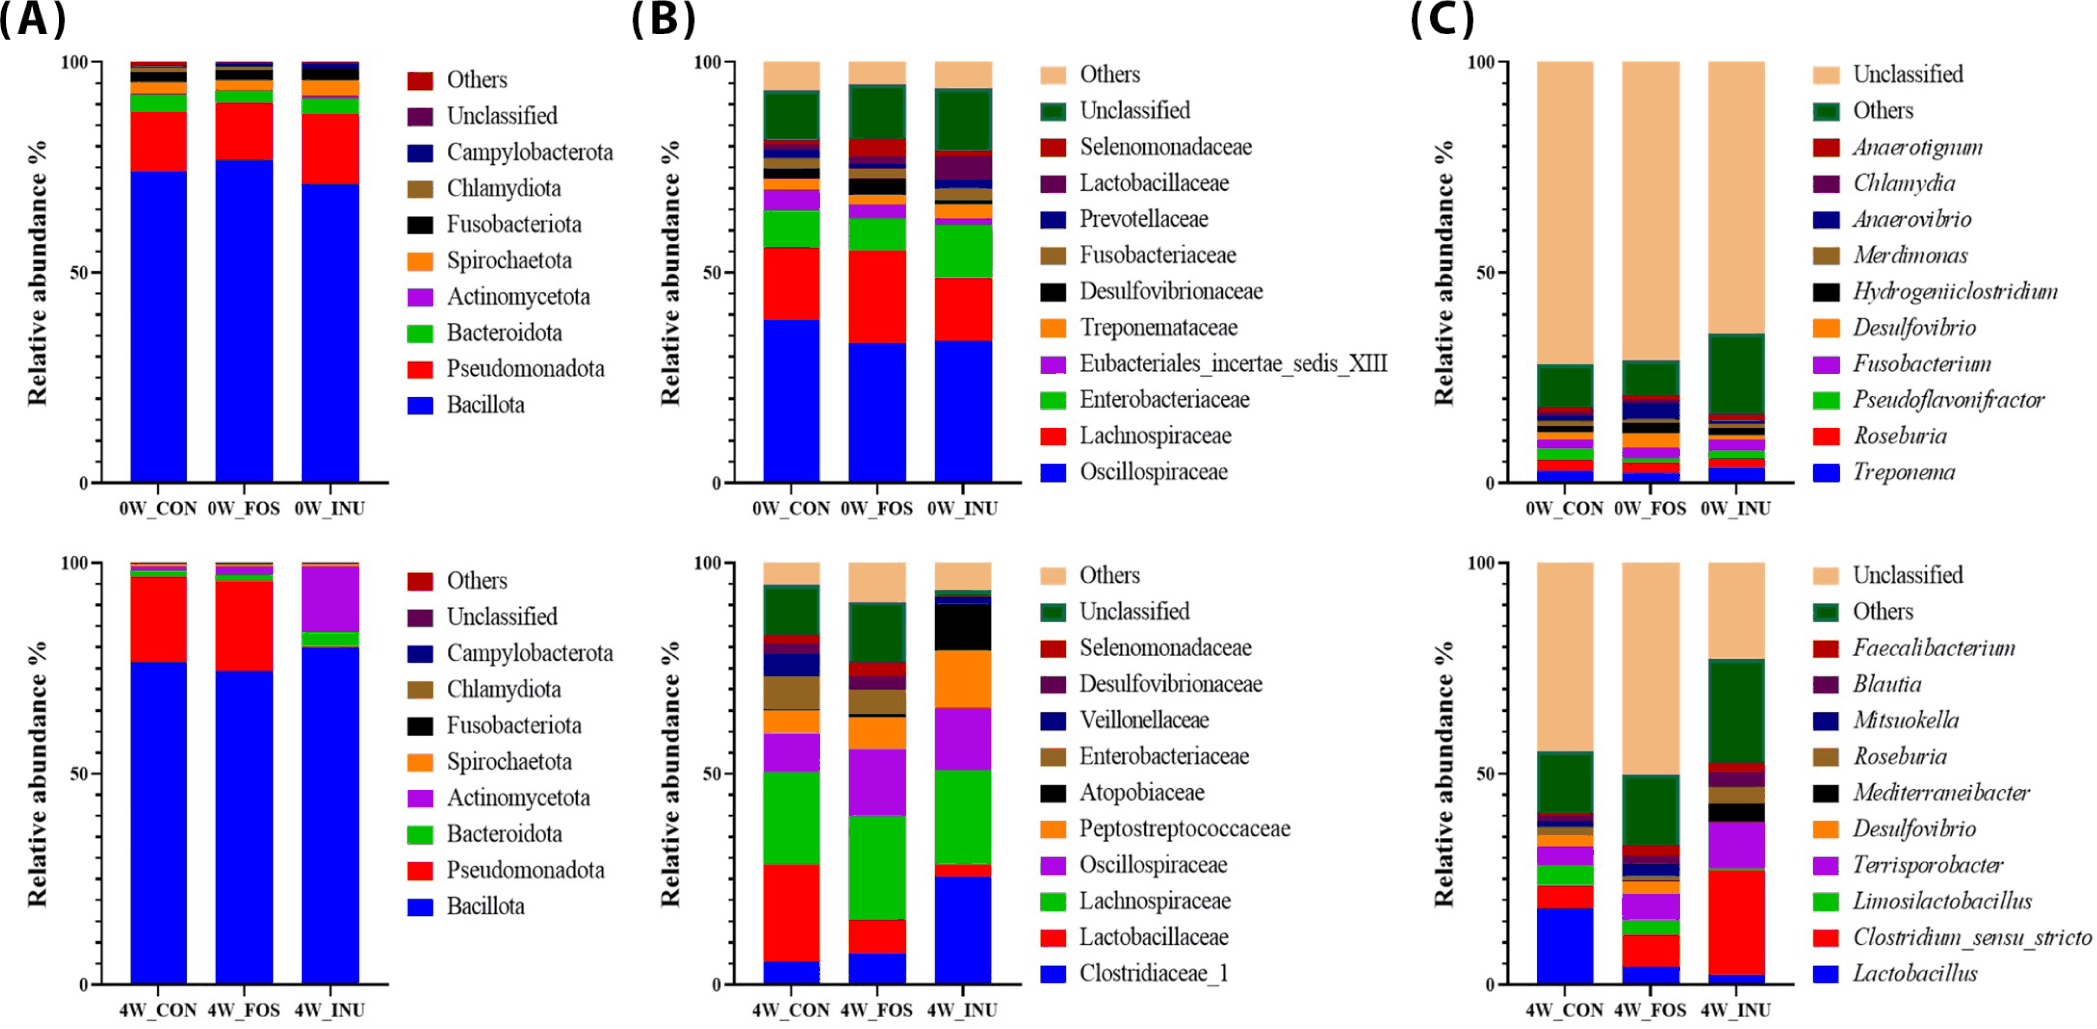
At the family level, all groups at Week 0 (0W) were dominated by Oscillospiraceae, Lachnospiraceae, and Enterobacteriaceae, showing a similar microbial family composition across groups (Fig. 3B). By Week 4 (4W), the relative abundance of Oscillospiraceae decreased in all groups, while Lachnospiraceae and Peptostreptococcaceae increased. In the CON group, Lactobacillaceae showed a significant increase from an average of 1.3% to 23% (p < 0.05), and the FOS group also exhibited a notable increase from 1.8% to 8%. In the INU group, Enterobacteriaceae significantly decreased from an average of 12.5% to 0.07%, while Clostridiaceae_1 significantly increased from 0.4% to 25.7%, and Atopobiaceae increased from 0.01% to 10.9% (p < 0.05).
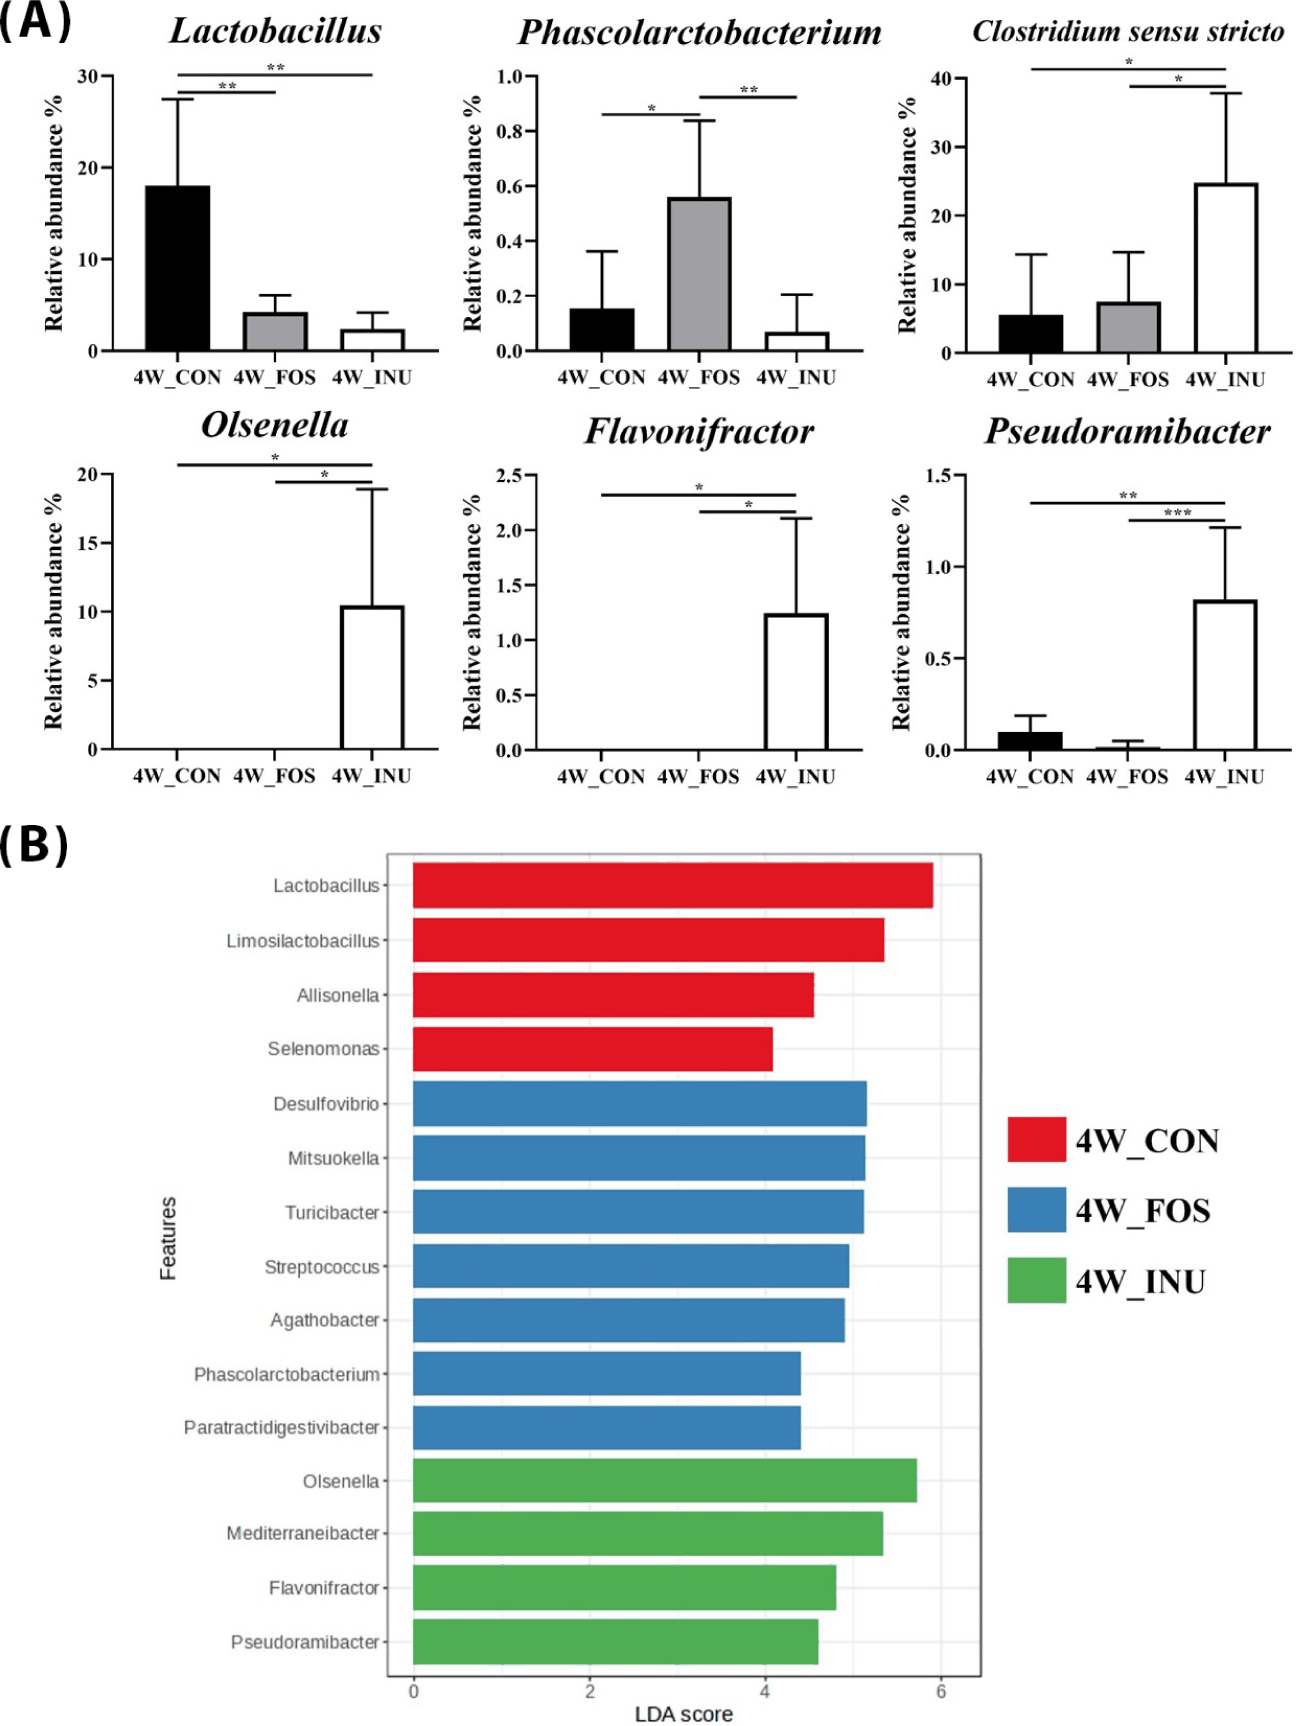
At the genus level, while all groups exhibited a similar composition of genera at Week 0 (0W), the compositions at Week 4 (4W) showed significant changes in the relative abundances of certain genera depending on the diet (Fig. 3C). The changes observed at 4W in genera such as Lactobacillus (Lactobacillaceae), Clostridium sensu stricto (Clostridiaceae_1), Terrisporobacter (Peptostreptococcaceae), and Olsenella (Atopobiaceae) were consistent with the trends observed at the family level. The results of the STAMP analysis, which identified genera with significant differences in relative abundance among the dietary groups at 4W, are presented in Fig. 4A. The genus Lactobacillus showed a significantly higher relative abundance in the CON group compared to the other groups, whereas Phascolarctobacterium was significantly more abundant in the FOS group. The genera Clostridium sensu stricto, Olsenella, Flavonifractor, and Pseudoramibacter were significantly more abundant in the INU group than in the other dietary groups. Linear Discriminant Analysis Effect Size (LEfSe), conducted with a p-value cutoff of 0.1 and a log LDA score threshold of 4.0, identified the top 15 genera most characteristically enriched in each group at 4W (Fig. 4B). In the CON group, four genera, including Lactobacillus and Limosilactobacillus, were identified as representative. In the FOS group, seven genera, including Desulfovibrio, Mitsuokella, and Turicibacter, were distinguished as characteristic. In the INU group, four genera, including Olsenella and Mediterraneibacter, were identified as representative of that dietary group.
DISCUSSION
Previous studies have reported that dietary supplementation with FOS and inulin significantly improves the growth performance of weaned piglets [28,29]. In the present study, fructan supplementation tended to enhance growth performance, although the differences were not statistically significant, and no significant differences were observed in nutrient digestibility. Similar studies involving FOS and inulin supplementation in weaned pigs have reported comparable findings. Berrocoso et al. [30] observed improved growth performance and digestibility under poor sanitary conditions compared with optimized conditions, whereas several trials conducted in high-hygiene, welfare-compliant settings found no significant growth effects [31–33]. This pattern suggests that, under nutrient-adequate diets and high-quality rearing environments, the marginal room for additional performance gains is limited [34,35]. Additionally, other studies have reported that longer supplementation periods can significantly improve pig growth performance. Samolińska et al. [36] reported that three months of prebiotic supplementation significantly improved ADG and feed conversion ratio (FCR) in growing-finishing pigs, whereas Grela et al. [37] observed enhanced final BW and overall FCR following two months of supplementation in weaned piglets. Therefore, longer supplementation and experimental durations may be necessary to observe meaningful improvements in long-term growth performance.
HGB is a crucial component of RBCs, responsible for oxygen transport. A deficiency in RBCs or HGB in the blood may indicate anemia [38], while HCT, which represents the proportion of RBCs in blood volume, has been associated with diarrhea in pigs [39]. An increase in WBCs, which are involved in immune responses, may indicate inflammation, and abnormal levels of PLTs, which are essential for blood clotting, can suggest risks of bleeding or thrombus [40,41]. Blood profile parameters remained within were within the previously reported normal ranges for hematological characteristics in weaned pigs [42], indicating that fructan supplementation did not negatively affect blood components. We limited hematological measurements to d 0, 7, and 14 to capture the early post-weaning period, when stress-related hematological changes are most pronounced. However, extending the duration of hematological measurements might yield more reliable results.
Moeser et al. [43] reported that cortisol, a stress-related marker known to mediate gut dysfunction, was elevated in pig serum seven days after weaning. Increased stress can lead to changes in inflammatory cytokines such as TNF-α, which increase intestinal permeability and mucosal inflammation, potentially disrupting gut barrier function and impairing gut development and nutrient absorption [44,45]. In the present study, no significant changes in cortisol or TNF-α levels, nor differences among groups, were observed during the experimental period in response to fructan supplementation. Serum IgA and IgG are key immunoglobulins used to assess immune function [46]. Previous studies have reported that prebiotic supplementation can stimulate immune responses, leading to increased IgA and IgG concentrations [47,48], which is consistent with our observation of elevated IgA levels in the fructan-supplemented groups. These findings suggest that fructan supplementation did not negatively affect the health of weaned piglets and may support the enhancement of their immune system.
In the microbiota of the FOS supplemented group, several genera such as Phascolarctobacterium, Mitsuokella, Turicibacter, Streptococcus, and Agathobacter were distinctly dominant compared to the other groups. Xie et al. [49] reported that FOS increased the relative abundance of Phascolarctobacterium in the gut microbiota by simulating colonic pH. Phascolarctobacterium utilizes succinate as a substrate to produce acetate or propionate and maintains a symbiotic relationship with bacteria that produce succinate as a metabolic byproduct of polysaccharide fermentation [50]. Mitsuokella, Turicibacter, Streptococcus, and Agathobacter have been reported to possess beneficial butyrogenic properties [51]. In particular, Agathobacter is recognized as a beneficial bacterium that produces butyrate from complex carbohydrates [52].
In the microbiota of the inulin supplemented group, several genera such as Clostridiumsensustricto, Olsenella, Flavonifractor, and Pseudoramibacter were notably dominant. Clostridium sensu stricto is known for efficiently metabolizing a variety of substrates such as carbohydrates, amino acids, and alcohols and for producing butyrate in the pig [53]. The genus Olsenella ferments glucose to produce acetate and lactate, and its dominance may be influenced by metabolites generated during inulin degradation [54,55]. Flavonifractor is a butyrate-producing bacterium that has been reported in several studies to be associated with the alleviation of intestinal inflammation [56,57]. Although research on Pseudoramibacter is limited, it is known to produce various SCFAs, including formate, acetate, and butyrate, which can help protect the gut barrier in weaned piglets [58,59]. Previous studies have reported that SCFAs produced by these microbes can improve the intestinal environment and enhance gut health in pigs by promoting the development of colonic and small intestinal epithelial cells, maintaining the integrity of epithelial tight junctions, and inhibiting pathogen adhesion through pH reduction [60–63].
This study showed that fructan supplementation did not lead to significant improvements in growth performance or nutrient digestibility but altered the microbial composition by increasing the relative abundance of SCFAs and organic acid producing bacteria. As discussed above, these findings suggest that, under optimized rearing and sanitary conditions, the gut microbiota alterations induced by fructan supplementation may have contributed to improved intestinal health—such as enhanced barrier function and pathogen suppression—rather than directly facilitating nutrient digestion and absorption, and similar findings supporting this interpretation have been reported [33,64–66]. These studies suggest that fructan-induced shifts in the gut microbiota may contribute to long-term improvements in pig productivity; however, additional evaluations, including quantification of gut SCFA concentrations, functional gene profiling of the microbiota, and long-term feeding trials, are required to more clearly verify host–microbe interactions.
CONCLUSION
This study indicates that dietary fructan supplementation can modulate the gut microbiota and promote SCFA-producing bacteria without adversely affecting growth performance, nutrient digestibility, or immune responses in weaned piglets. A comprehensive analysis of the effects of FOS and inulin supplementation on growth performance, immunity and gut microbiota composition in weaned piglets provides valuable insights into the role of fructans in piglet health. This multi-dimensional approach highlights the interconnections among various outcomes and underscores the importance of studying host–microbiota interactions.