RESEARCH ARTICLE

Differences in liver microRNA profiling in pigs with low and high feed efficiency

Yuanxin Miao1,2https://orcid.org/0000-0001-6888-9537, Chuanke Fu2https://orcid.org/0000-0002-8464-5812, Mingxing Liao2https://orcid.org/0000-0002-8331-0172, Fang Fang2,3,*https://orcid.org/0000-0002-9371-1471
Author Information & Copyright
1College of Bioengineering,Jingchu University of Technology, Jingmen 448000, Hubei, China
2Key Laboratory of Agricultural Animal Genetics, Breeding and Reproduction of Ministry of Education, Huazhong Agricultural University, Wuhan 430070, China
3National Center for International Research on Animal Genetics, Breeding and Reproduction (NCIRAGBR), Huazhong Agricultural University, Wuhan 430070, China
*Corresponding author: Fang Fang, Key Laboratory of Agricultural Animal Genetics, Breeding and Reproduction of Ministry of Education, Huazhong Agricultural University, Wuhan 430070, China. Tel: +86-278-728-2091, E-mail: FangFang@mail.hzau.edu.cn

© Copyright 2022 Korean Society of Animal Science and Technology. This is an Open-Access article distributed under the terms of the Creative Commons Attribution Non-Commercial License (http://creativecommons.org/licenses/by-nc/4.0/) which permits unrestricted non-commercial use, distribution, and reproduction in any medium, provided the original work is properly cited.

Received: Oct 26, 2021; Revised: Dec 20, 2021; Accepted: Jan 09, 2022

Published Online: Mar 31, 2022

Abstract

Feed cost is the main factor affecting the economic benefits of pig industry. Improving the feed efficiency (FE) can reduce the feed cost and improve the economic benefits of pig breeding enterprises. Liver is a complex metabolic organ which affects the distribution of nutrients and regulates the efficiency of energy conversion from nutrients to muscle or fat, thereby affecting feed efficiency. MicroRNAs (miRNAs) are small non-coding RNAs that can regulate feed efficiency through the modulation of gene expression at the post-transcriptional level. In this study, we analyzed miRNA profiling of liver tissues in High-FE and Low-FE pigs for the purpose of identifying key miRNAs related to feed efficiency. A total 212~221 annotated porcine miRNAs and 136~281 novel miRNAs were identified in the pig liver. Among them, 188 annotated miRNAs were co-expressed in High-FE and Low-FE pigs. The 14 miRNAs were significantly differentially expressed (DE) in the livers of high-FE pigs and low-FE pigs, of which 5 were downregulated and 9 were upregulated. Kyoto Encyclopedia of Genes and Genomes analysis of liver DE miRNAs in high-FE pigs and low-FE pigs indicated that the target genes of DE miRNAs were significantly enriched in insulin signaling pathway, Gonadotropin-releasing hormone signaling pathway, and mammalian target of rapamycin signaling pathway. To verify the reliability of sequencing results, 5 DE miRNAs were randomly selected for quantitative reverse transcription-polymerase chain reaction (qRT-PCR). The qRT-PCR results of miRNAs were confirmed to be consistent with sequencing data. DE miRNA data indicated that liver-specific miRNAs synergistically acted with mRNAs to improve feed efficiency. The liver miRNAs expression analysis revealed the metabolic pathways by which the liver miRNAs regulate pig feed efficiency.

Keywords: Feed efficiency; miRNA; Pig; Liver

INTRODUCTION

Feed cost is an important economic expenditure of pig breeding industry, accounting for more than 60% of the entire of pig breeding cost [1,2]. Improving feed efficiency (FE) is an effective strategy to reduce feed cost in the pig industry. Residual feed intake (RFI) is widely used to measure the FE [3]. RFI is defined as the difference between the actual feed intake and the predicted feed intake, the latter is calculated based on the intake amount required for maintenance and growth during a certain period [4,5]. The heritability of RFI has been reported to be between 0.10 and 0.42 in pig, which is moderate heritability [68], thus there is much room for raising pig FE by improving RFI. Low RFI denotes high efficiency at converting feed into body mass [9,10].

The selection of RFI in pigs not only improves FE, but also changes energy metabolism, which can explain the variation mechanism of RFI in pigs. It has been reported that low-RFI pigs with longissimus muscle have high glycogen content and low activities of metabolic enzymes involved in glycolytic pathway, fatty acid oxidation pathway, and energy balance [11]. In addition, low-RFI pigs exhibit the low activities of lactate dehydrogenase involved in glucose metabolism and hydroxylacylCoA dehydrogenase involved in fatty acid oxidation [12]. Mitochondria is the main site for energy metabolism. Moreover, in the low-RFI line, the reactive oxygen species production in the white portion and red portion of the semitendinosus is reduced in the mitochondria [13]. Although the effect of RFI selection on animal metabolism can partly explain the mechanism of RFI variation, the underlying mechanism of FE remains largely unknown.

MicroRNAs (miRNAs), a class of small endogenous noncoding RNAs with 19 to 25 nucleotides, play important roles in post-transcriptional regulation [14,15]. MiRNAs have been reported to be related to FE. A total of 25 DE miRNAs have been identified in longissimus dorsi of significantly different RFI pigs, of which, miR-208, miR-29c, and miR-1 are related to skeletal muscle growth and development [1]. In cattle, 25 miRNAs are differentially expressed (DE) in liver of high and low RFI individuals, among which, bta-miR-143, bta-miR-122, bta-miR-802, and bta-miR-29b are mainly related to glucose homeostasis and lipid metabolism [16]. It has been reported that bta-miR-486, bta-miR-7, bta-miR15a, bta-miR-21, bta-miR-29, bta-miR-30b, bta-miR-106b, bta-miR-199a-3p, bta-miR-204, and bta-miR-296 are mainly involved in such signaling pathways as insulin, lipid, immune system, oxidative stress response, and muscle development, and they are also associated with RFI in cattle [17].In addition, miR-665, miR34a and miR-2899 may regulate cattle RFI by controlling 14-3-3 epsilon and heat shock protein family B (small) member 1 (HSPB1) proteins [18]. These results indicate that miRNAs play an important role in regulating FE.

Liver, as a complex metabolicorgan, affects the distribution of nutrients, and it regulates the muscle and lipid generation by affecting energy metabolism, thus it is an important organ for regulating FE [19,20]. In this study, miRNA-sequencing was performed to comprehensively analyze a miRNA expression in the liver of high- and low-FE pigs. Subsequently, the relationship between our DE miRNAs and the previously reported DE genes analyzed. Our study may provide an insight into the molecular mechanism of FE in pigs.

MATERIALS AND METHODS

Sample preparation and RNA isolation

In this study, 236 castrated boars from population of Yorkshire pigs were raised in ACEMA64 (ACEMO, Pontivy, France) automated individual feeding systems in the Agricultural Ministry Breeding Swine Quality Supervision Inspecting and Testing Center (Wuhan, China) [1]. Based on the FE measurements, the performances of 30 animals with the lowest RFI (high FE) and 30 animals with the highest RFI (low FE) were compared (Table 1). On average, pigs in the high-FE group consumed significantly less feed per day than pigs in the low-FE group, and there was a reduction in fat deposition, which is consistent with the results reported in other literatures[12,2123]. The individuals with extreme FE differences (3 vs. 3) were selected based on the RFI value for miRNA sequencing, and there was no difference in body weight between these individuals (Table S1). Liver tissue samples of each pig were collected after slaughter, immediately frozen in liquid nitrogen within 30 minutes, and stored at −80°C. Total RNA was extracted from the frozen liver samples using TRIzol regent for miRNA sequencing (Invitrogen, Carlsbad, CA, USA). All experimental protocols were approved by the Ethics Committee of Huazhong Agricultural University (HZAUMU2013-0005).

Table 1. Animal performance of Yorkshire pigs with FE extreme individual
High-FE Low-FE p-value1)
n 30 30
FCR 2.25±0.23 2.81±0.21 3.01626E-14
RFI (kg/day) −0.28±0.17 0.19±0.097 1.92944E-19
DFI 1.90±0.29 2.40±0.25 2.44119E-09
ADG 0.85±0.13 0.86±0.13 0.75
Initial BW (kg) 39.64±3.42 40.28±2.40 0.40
Final BW (kg) 89.06±0.13 90.38±5.14 0.27
AMBW 22.61±0.61 22.87±0.81 0.17
ABF2) (mm) 19.15±2.75 22.08±2.58 7.95454E-05
LMA3) (cm2) 46.40±5.37 46.65±7.35 0.66

1) p-value as calculated by t-test.

2) ABF, average of back fat thicknesses (mm) measured at three points between 6th and 7th ribs (6th–7th BF) and at the10th rib (10th BF).

3) LMA, loin muscle area (cm2) measured between the 10th and 11th.

FE, feed efficiency; FCR, feed conversion ratio; RFI, residual feed intake; DFI, daily feed intake; ADG, average daily gain over the assessed feeding period; BW, body weight; AMBW, average metabolic body weight; BF, backfat thickness.

Download Excel Table
Library construction and microRNA sequencing

The total RNA of each liver sample was used for small RNA library construction. The miRNA sequencing library of each sample was prepared with TruSeqR Small RNA library Kit (Illumina, San Diego, CA, USA) according to manufacturer’s instructions. After quality control, six miRNA libraries were sequenced on Illumina HiSeq3000 platform at the Genergy Biotechnology, shanghai, China.

MicroRNA sequencing analysis

The clean reads of miRNA were obtained from raw data after trimming adapters and filtering low-quality reads. Then, clean reads were mapped to the reference genome of Sus scrofa v. 11.1 (http://ftp.ensembl.org/pub/release-104/fasta/sus_scrofa/dna/) with miRdeep2 [24]. The reference genome was downloaded from Ensembl (EMBL-EBI, Hinxton, Cambs, UK), and the miRNA reference sequences were obtained from the miRBase database (version 22) (The University of Manchester, Manchester, UK). The expression level of each miRNA was normalized according to the following formula: Normalized read count = Actual miRNA count/Total clean read count ×1000000 [2527]. The known miRNAs were verified and novel miRNAs were predicted by the MiRDeep (v2.0.0.7) software (Max Delbrück Center for Molecular Medicine, Berlin, Germany) [28]. The sequences mapped to the pig reference genome were considered as potential miRNA sequences. The miRNAs whose sequences matched those of mature miRNAs in miRBase20.0 were identified as known miRNAs. Novel miRNAs were predicted based on unmatched sequences by MiRDeep2, and the secondary structures of novel miRNA were predicted by RNAfold (v2.0.1) (University of Vienna, Vienna, Austria) [29].

Differential expression analysis and quantitative reverse transcription-polymerase chain reaction validation of microRNAs

The R package of DESeq (v4.0.3) (European Molecular Biology Laboratory, Heidelberg, Germany) [30] was used to analyze the differences in miRNA expression level between the high-FE and low-FE pigs. The Fold change between high-FE and low-FE was calculate according to the following formula: |log2 (Fold change)|= log2(high-FE/low-FE). The p-value between the two groups was calculated using the following formulas:

p ( x | y ) = ( N 2 N 1 ) y ( x + y ) ! x ! y ! ( 1 + N 2 N 1 ) ( x + Y + 1 )

among them N1 and N2 represent the total count of clean reads in miRNA libraries of high-FE and low-FE liver tissue samples, respectively; x and y represent the normalized expression levels of a given miRNA in miRNA library of high-FE and low-FE liver tissue samples, respectively [31]. The DE miRNAs were identified according to the criteria of p-value < 0.05 and | log2 (Fold change) | ≥ 1.

The relative expression levels of the DE miRNA in liver tissues were quantified by real-time qRT-PCR. Three high-FE samples and three low-FE samples were used for qRT-PCR analysis. The specific primers of miRNAs are listed in Table S2. The miRNA reverse transcription was performed with Thermo Scientific Revert Aid First Strand cDNA synthesis Kit (Thermo Fisher Scientific, Waltham, MA, USA). The pig U6 snRNA was used as the internal control. The miRNAs were quantified on Roche Lightcycler 480 Sequence Detection System (Roche Holding AG, Basel, Switzerland) according to the instruction manual. The 2−ΔΔCt method was used to analyze the relative expression levels of miRNAs, and the Student’s t-test was used to analyze the expression difference between the high-FE and low-FE pigs.

MicroRNA target gene prediction and gene ontology enrichment analyses

To explore the functions of significantly DE miRNAs between high-FE and low-FE pig, the miRNA target genes were predicted using DIANA miRPath (http://snf-515788.vm.okeanos.grnet.gr/) (University of Thessaly, Volos, Greece) with homologous human miRNAs.

The GO enrichment analysis (with expression analysis systematic explorer [EASE] < 0.01), and KEGG pathway analysis (with EASE scores = 0.1) were performed using DAVID Bioinformatics Resources (https://david.ncifcrf.gov/) (National Cancer Institute at Frederick, Frederick, MD, USA).

microRNA-mRNA regulation network construction

We selected the differentially expressed genes (DEGs) in livers of High and Low FE pigs, which were also targeted by DE miRNAs, based on our previous study results [32]. These genes were considered as the potential core genes. To identify all possible miRNA-mRNA interactions, the regulatory networks between DE miRNAs and their target mRNA were visualized using an open source software—Cytoscape v3.6.1 (Institute for Systems Biology, Seattle, Washington, USA.) [33].

RESULTS

Mapping and annotation of microRNA sequencing data

To identify DE miRNAs between high and low FE groups (n = 3 in each group, Table S1), six small RNA libraries of the liver tissues from high and low FE pigs were constructed for solexa sequencing. After sequencing, 15.78–38.56 million raw reads per sample were obtained. After eliminating the adaptor sequences and filtering low quality reads and short fragments (less than 18nt), 15.24–32.20 million clean reads per sample were obtained, accounting for 83.48%–97.32% of the raw reads (Table 2). The length distribution of most clean reads ranged from 21 to 23 nt, and the length distribution peak was 22 nt (Fig. S1). This result was consistent with the length range of miRNA.

Table 2. Summary of miRNA sequences present in high and low feed efficiency libraries
Reads High-FE-126 High-FE-130 High-FE-160 Low-FE-302 Low-FE-306 Low-FE-307
Total reads 26112409 20763517 15781729 38569212 33339689 28127726
Clean reads 24835910 20143193 15198953 32095751 28058316 24174860
Qualified% 0.951115 0.970124 0.963073 0.83216 0.841589 0.859467
Mapped 10664822 9412307 5532788 9730647 9953581 9409661
Unmapped 14171088 10730886 9666165 22365104 18104735 14765199
Mapped% 0.429 0.467 0.364 0.303 0.355 0.389
Unmapped% 0.571 0.533 0.636 0.697 0.645 0.611

miRNAs, MicroRNAs; FE, feed efficiency.

Download Excel Table
Identification of conserved and novel microRNAs using miRDeep2

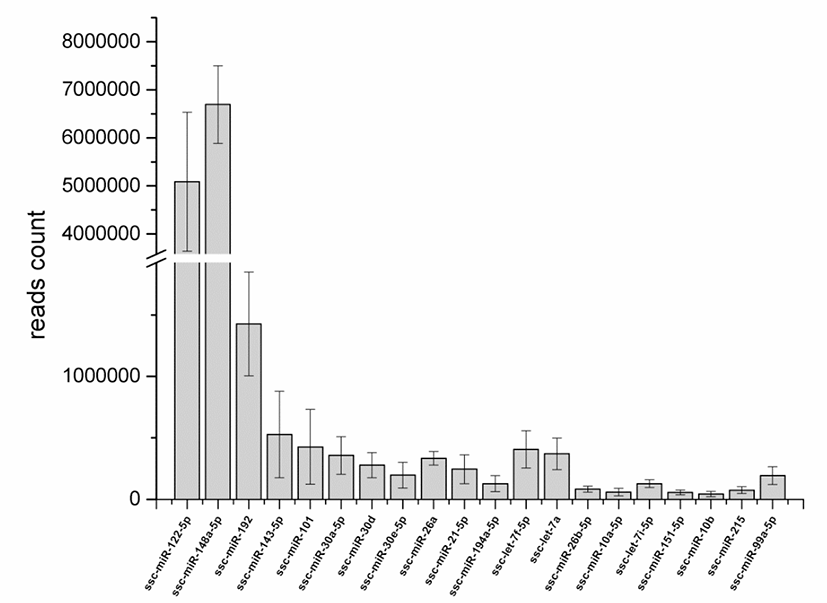
The clean reads were aligned to the precursor and mature miRNAs in the miRBase 22.0 database. In total, 218, 213, 212, 222, 215, and 221 mature annotated porcine miRNAs were identified in the high-FE-126, HIgh-FE-130, high-FE-160, low-FE-302, low-FE-306, and low-FE-307 respectively (Table S3). A total of 188 miRNAs were co-expressed in these six individual pigs, of which 77 mature miRNAs were abundantly expressed in livers of High-FE and low-FE pigs, and 2 miRNAs (ssc-miR-7139-5p, ssc-miR-144) were specifically expressed in the low-FE group (Fig. S2). The top 20 mature miRNAs with largest read count were listed in Fig. 1.
jast-64-2-312-g1
Fig. 1. The top 20 most abundant miRNAs in the high and low feed efficiency sequence libraries from liver tissues in pigs.
Download Original Figure

The miRDeep2 was used to identify novel miRNAs from sequencing data (Table S4, Fig. S3), and predict their precursor sequences and hairpin structure (Fig. S4). In total, 136, 151, 113, 184, 281, and 242 novel miRNAs were identified to be homologous to human or mouse in the six individuals (high-FE-126, high-FE-130, high-FE-160, low-FE-302, low-FE-306, and low-FE-307). Among these newly identified miRNAs, 28 miRNAs were co-expressed in all six individuals, and one miRNA was specifically expressed in in high-FE pigs and 24 miRNAs were specifically expressed in low-FE pigs. Since the expression levels of most novel miRNAs were relatively low in our results, they were not further analyzed.

Identification of 14 differentially expressed microRNAs in high- feed efficiency and low- feed efficiency pigs

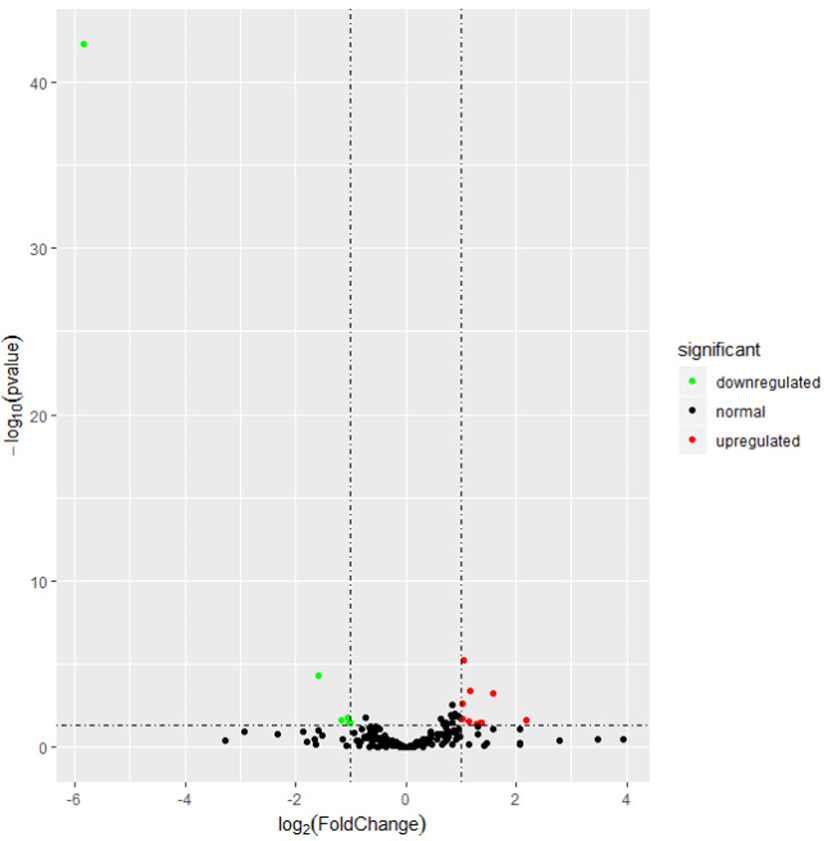
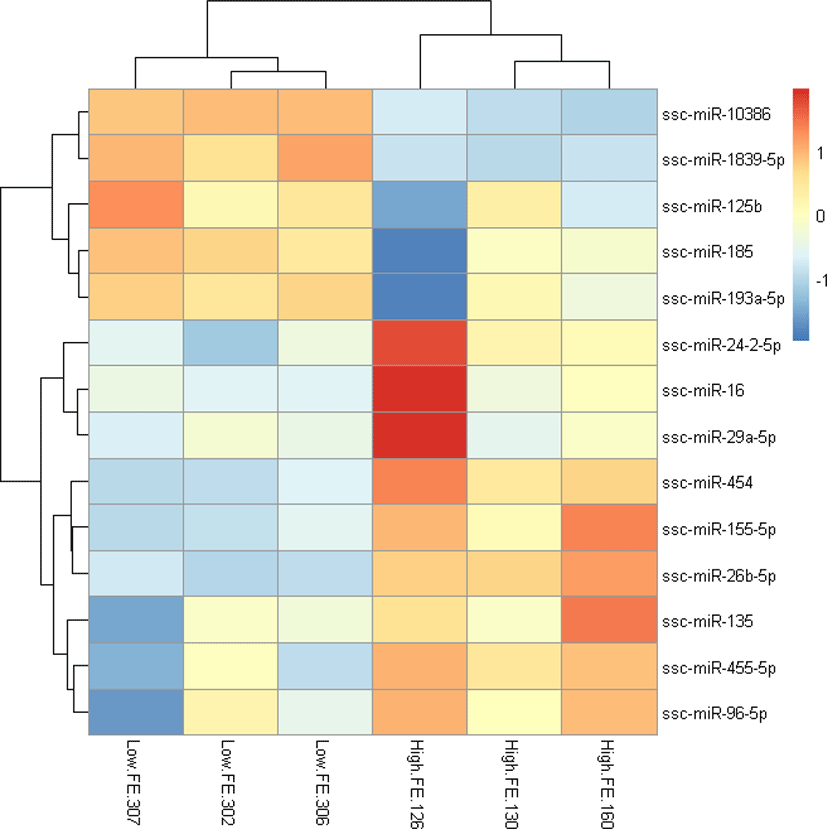
To explore the relationship of miRNAs and FE in liver, we compared the expression patterns of the miRNAs in liver between high-FE and low-FE pigs. In our study, 14 DE miRNAs were identified between high-FE group and low-FE group, of which five miRNA were downregulated and nine miRNA were upregulated in high-FE pigs relative to low-FE pigs (Fig. 2, Table 3). Two of these identified DE miRNAs (ssc-miR-10386 and ssc-miR-1839-5p) were not homologous with those of human, but the remaining 12 miRNA were homologous with 12 human miRNAs (Table 3). Cluster analysis of these 14 DE miRNAs exhibited the expression patterns of miRNAs in different samples (Fig. 3).
jast-64-2-312-g2
Fig. 2. Volcano plot displaying differentially expressed microRNAs (miRNAs) identified using miRNA-seq in high and low feed efficiency pigs. The x-axis represents the log2-fold change value and the y-axis displays the mean expression value of −log10 (p-value). The green dots indicate down-regulated miRNAs; the red dots indicate up-regulated miRNAs; the black dots indicate the miRNAs with no significant change in expression.
Download Original Figure
Table 3. Differentially expressed miRNAs identified by miRDeep2 in liver between divergent feed efficiency pigs
Mature SSC ID Ref miRNA FC(H/L) p-value Mature sequence
ssc-miR-10386 −5.86 >1.05E-41 gucguccucucccucccuccu
ssc-miR-26b-5p hsa-miR-26a-5p 1.04 2.41E-05 uucaaguaauucaggauagguu
ssc-miR-1839-5p −1.61 6.92E-05 aagguagauagaacaggucuug
ssc-miR-155-5p hsa-miR-155-5p 1.15 0.000556 uuaaugcuaauugugauagggg
ssc-miR-454 hsa-miR-130a-3p 1.57 0.00074 uagugcaauauugcuuauagggu
ssc-miR-455-5p hsa-miR-455-5p 1.02 0.003295 uaugugccuuuggacuacaucg
ssc-miR-185 hsa-miR-185-5p −1.07 0.016294 uggagagaaaggcaguuccuga
ssc-miR-193a-5p hsa-miR-193a-5p −1.17 0.020914 ugggucuuugcgggcgagauga
ssc-miR-24-2-5p hsa-miR-24-3p 1.00 0.021422 gugccuacugagcugauaucagu
ssc-miR-29a-5p hsa-miR-29a-3p 2.16 0.021715 acugauuucuuuugguguucag
ssc-miR-16 hsa-miR-15a-5p 1.11 0.027376 uagcagcacguaaauauuggcg
ssc-miR-125b hsa-miR-125b-5p −1.03 0.032728 ucccugagacccuaacuuguga
ssc-miR-135 hsa-miR-135a-5p 1.35 0.037177 uauggcuuuuuauuccuauguga
ssc-miR-96-5p hsa-miR-96-5p 1.27 0.04017 uuuggcacuagcacauuuuugcu

SSC, sus scrofa chromosome; FC, log2(Fold Change) level.

Download Excel Table
jast-64-2-312-g3
Fig. 3. Hierarchically clustered heat map of 14 DE microRNA. Red and blue represent up and downregulated expression in liver respectively. Color density indicated level of fold change.
Download Original Figure
Validation of sequencing data by quantitative reverse transcription-polymerase chain reaction

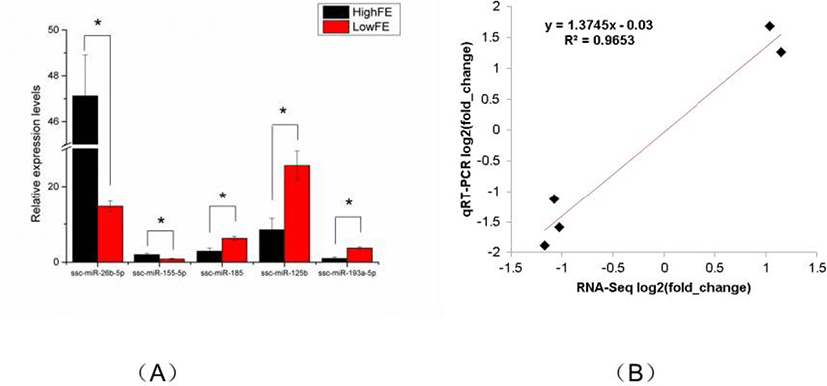
To verity the reliability of the miRNA sequencing data, five DE miRNAs (ssc-miR-26b-5p, ssc-miR-155-5p, ssc-miR-185, ssc-miR-125b, ssc-miR-193a-5p) were randomly selected for qRT-PCR analysis. Compared with that in high-FE liver, the expression level of ssc-miR-26b-5p and ssc-miR-155-5p in low-FE liver was significantly downregulated, whereas the expression level of ssc-miR-185, ssc-miR-125b, and ssc-miR-193a-5p was significant upregulated. These qRT-PCR results were consistent with the miRNA-sequencing data, indicating the reliability of miRNA sequencing data (Fig. 4).
jast-64-2-312-g4
Fig. 4. qRT-PCR validation of genes from RNA-seq results between high-FE and low-FE pigs. All samples were normalized to U6 snRNA. (A) Five liver DE miRNAs validated by qRT-PCR. (B) Line fit plot of qRT-PCR results and RNA-Seq data showing the expression difference of the selected five miRNAs between high-FE and low-FE pigs. Linear regression model and R-Squared shown in the Fig. 4. qRT-PCR, quantitative reverse transcription-polymerase chain reaction; FE, feed efficiency; DE, differentially expressed; miRNAs, microRNA.
Download Original Figure
Prediction of miRNA target genes

To examine the functions of the DE miRNAs in the comparison of high-FE pigs vs. low-FE pigs, the target genes of the DE miRNAs homologous to human were predicted. The results indicated that 7025 target genes of DE miRNAs were predicted which included 5118 unique genes (Table S5). Among these target genes, Fatty acid synthase (FASN), lysosomal associated membrane protein 3 (LAMP3) and fatty acid elongase 7 (ELOVL7) have been reported to be DE in liver tissues of high-FE and low-FE pigs [32].

Gene ontology enrichment and Kyoto Encyclopedia of Genes and Genomes pathway analyses of target genes

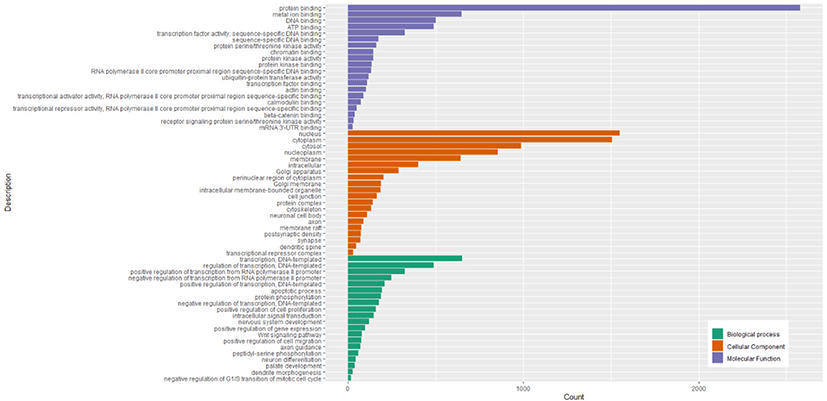
The GO enrichment analysis showed 5118 target genes were mainly enriched in 3 GO categories (biological processes, cellular components, and molecular functions). The 515 GO terms were significantly enriched in biological processes, 127 GO terms were significantly enriched in cellular components, and 162 GO terms significantly enriched in molecular functions (Table S6). The top 20 biological processes in which the target genes were enriched were related to transcription (DNA-templated), regulation of transcription (DNA-templated), positive regulation of transcription from RNA polymerase II promoter, and negative regulation of transcription from RNA polymerase II promoter. The cellular components in which most target genes were enriched were mainly associated with nucleus, cytoplasm, cytosol, nucleoplasm, and membrane. The molecular functions in which most target genes were enriched were mainly related to protein binding, metal ion binding, DNA binding, ATP binding, and transcription factor activity (sequence-specific DNA binding). The top 20 significant GO terms in each of 3 GO categories were shown in Fig. 5.
jast-64-2-312-g5
Fig. 5. GO classification of the target genes of different expression miRNA between high and low feed efficiency pigs. GO, gene ontology; miRNAs, microRNA.
Download Original Figure

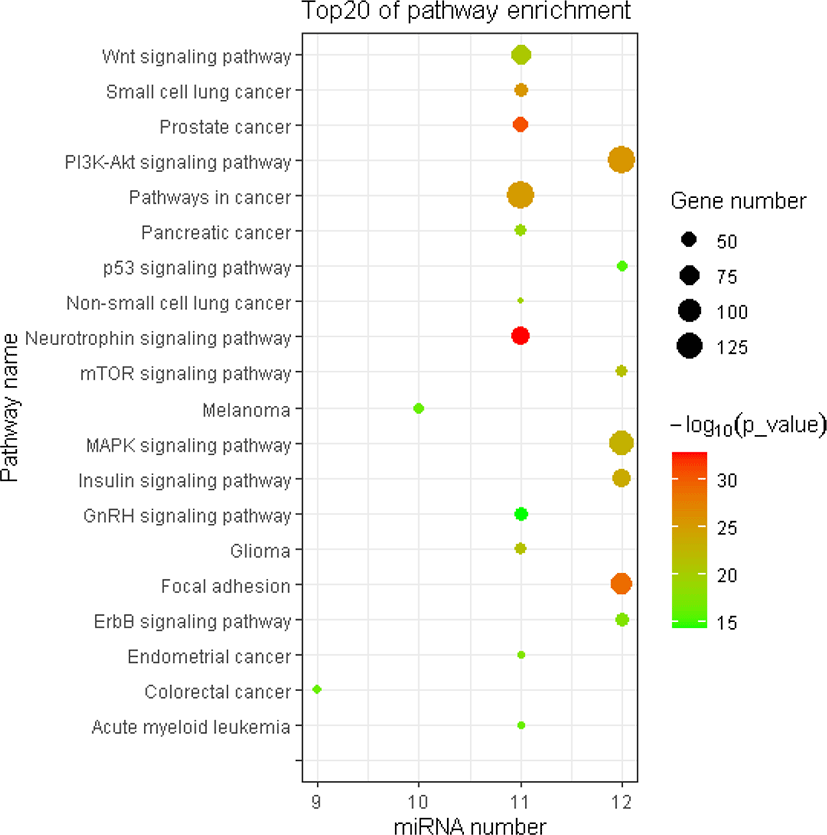
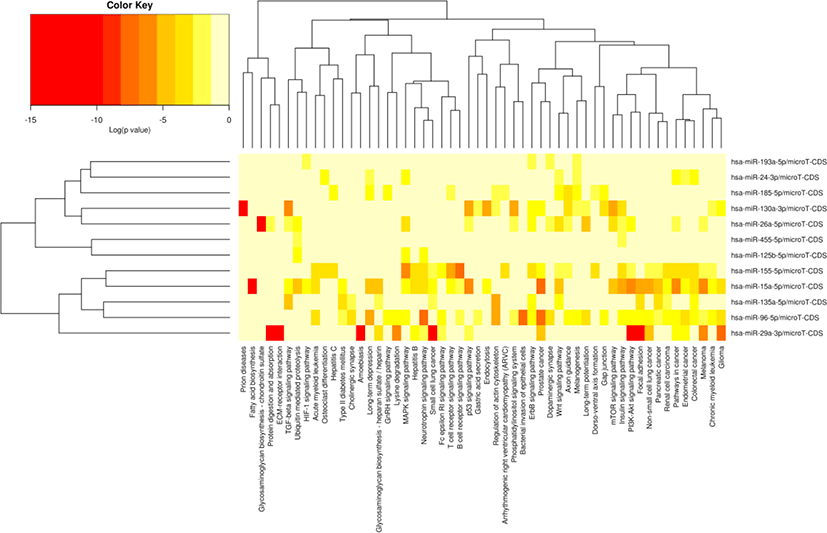
The miRNA target gene KEGG pathway analysis showed that the target genes of miRNAs were mainly enriched in 88 pathways (Table S7), and the top 20 pathways were shown in Fig. 6. Most of these enrichment pathways were associated with the growth and development such as PI3K-Akt signaling pathway, insulin signaling pathway, mTOR signaling pathway, Wnt signaling pathway, GnRH signaling pathway, transforming growth factor (TGF)-beta signaling pathway, and hypertrophic cardiomyopathy (HCM). Hierarchical clustering analysis was further performed to elaborate the relationship between DE miRNAs and their target pathways (Fig. 7). The miRNAs with the similar functions were clustered together.
jast-64-2-312-g6
Fig. 6. KEGG pathway enrich pathway enrichment of the target genes of DE miRNA. The abscissa represents the miRNA number. The –log10 (p-value) indicates the significance of the enrich pathway, and the size of circle indicates the number of the target genes. KEGG, Kyoto Encyclopedia of Genes and Genomes; DE, differentially expressed; miRNAs, microRNA.
Download Original Figure
jast-64-2-312-g7
Fig. 7. Heat map and Cluster patterns of the DE miRNAs and pathways relate to target gene. Heat map of miRNA with pathways, miRNAs are clustered together with similar pathway patterns, and pathways are clustered together with related miRNAs. Because the current version of DIANA miRPath does not contain porcine genes, human miRNAs were used for prediction. DE, differentially expressed; miRNAs, microRNA.
Download Original Figure
MicroRNA-mRNA association analysis

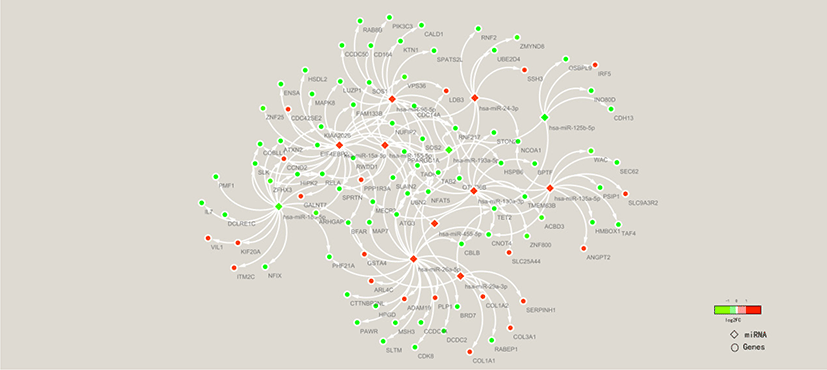
To clarify the molecular mechanisms of the FE trait, miRNA-mRNA association analysis of liver tissues in high-FE and low-FE pigs was conducted based on our previous study results [32]. To explore the potential roles of the miRNA in regulating target gene expression, we examined 532 well annotated DEGs (Table S8) and 14 DE miRNAs. Ninety-eight DE targets genes were identified from 11 miRNAs in the livers between high and low FE pigs (Fig. 8).
jast-64-2-312-g8
Fig. 8. miRNA/mRNA network analysis. The interaction of 11 differentially expressed miRNA and mRNA target genes was analyzed using Cytoscape based on miRNA target prediction results by DIANA-microT and DEGs reported in previous study. miRNAs, microRNA; DEGs, differentially expressed genes.
Download Original Figure

DISCUSSION

High-RFI (low-FE) and low-RFI (high-FE) pigs were chosen to identify the miRNA related to FE. The low-RFI pigs have higher conversion efficiency and lower energy metabolism, meaning that the energy intake of low-RFI pigs is mainly used for protein deposition while reducing fat accumulation [11,12,3436]. In addition, phenotypic comparisons between high-FE and low-FE pigs showed lower feed intake and fat deposition in low-FE pigs [21]. Thus, animals with lower RFI are higher efficient at converting feed into body mass, whereas those with higher RFI have lower FE. Therefore, the improvement of FE could effectively reduce feed intake and feed cost. The miRNAs are important post-transcriptional regulators of gene expressions and participate in many biological processes [37]. In this study, we systematically analyzed the miRNA profiles of liver tissues in high-FE and low-FE pigs. The FE-related DE miRNAs and important FE-related signaling pathways were identified in this study. It have been reported that carbohydrate metabolism, lipid metabolism, hepatic lipid accumulation and Metabolism of xenobiotics by cytochrome P450 and butanoate and tryptophan Metabolism are associated with FE in pigs [3842]. A number of miRNAs relate to carbohydrate metabolism (miR-135a-5p, miR-29a-3p, miR-15a-5p, miR-96-5p, miR-155-5p, miR-26a-5p, miR-185-5p, and miR-125b-5p), lipid metabolism (miR-16 and miR-135a-5p), hepatic lipid accumulation (miR-130a, miR-125b, miR-185, and miR-26a) and Metabolism of xenobiotics by cytochrome P450 and butanoate and tryptophan Metabolism (miR-185, miR-29a, miR-135a, miR-130a, miR-125b, miR-26a, miR-15a, and miR-96, miR-155, and miR-24, miR-130a, miR-26a, miR-15a) were DE between high FE and low FE pigs.

The top 2 highly expressed miRNAs were ssc-miR-122-5p and ssc-miR-192 in both high-FE and low-FE pigs. These two miRNAs have been confirmed to be abundant in liver and to participate in fat metabolism [4347]. The ssc-miR-122 plays an important role in lipid metabolism [48]. It has been reported that ssc-miR-122 is a liver-specific miRNA, and it is expressed almost exclusively in the liver [49,50]. In addition, ssc-mir-122 has been identified as a candidate miRNA of average daily gain trait in pigs [51]. Thus, the high expression of mir-122 in the porcine liver might also play a role in regulating the FE. The functional investigation reveals that ssc-miR-192 can promote hepatic lipid accumulation [52]. It has also been demonstrated that miR-192 is abundant in the liver [53]. The KEGG pathway analysis of these two abundant liver miRNAs indicates that their predicted target genes are enriched in glucagon signaling pathway, glycolysis / gluconeogenesis, citrate cycle (TCA cycle), insulin signaling pathway, AMP-activated protein kinase (AMPK) signaling pathway, and biosynthesis of amino acids. Therefore, miRNAs with high abundance in the liver of porcine may be an important regulator for energy metabolism and lipid metabolism.

Lipid metabolism in liver tissue has been reported to affect FE in pigs [40,41]. Two miRNAs involved in lipid metabolism (ssc-miR-16 and miR-135a-5p) have been found to be DE in liver in high-FE vs. low-FE pigs comparison. The ssc-miR-16 (hsa-miR-15a-5p) was up-regulated in the liver of high-FE pigs. One previous study has reported that miR-15a participates in multiple physiological processes, including adipocyte differentiation and lipid accumulation [54]. Moreover, the miR-15a/16 has been found to be negatively correlated with trglyceride and total cholesterol in liver tissue of pigs [55]. The ectopic overexpression of miR-15a strongly up-regulates the expression level of FASN mRNA, and this FASN mRNA has been found to be up-regulated in liver of high-FE pigs relative to low-FE pigs [56,57]. LAMP, a predicted target gene of miR-15a, has been found to be down–regulated in liver of high-FE pigs compared with that in low-FE pigs [32]. LAMP3 can regulate lipid metabolism of liver [58]. It should be noted that miR-15a has been reported to be associated with FE in bovine [17,59]. The miR-135a-5p, which can suppress adipogenesis by activating canonical Wnt/β-catenin signaling, is up-regulated in the liver of high-FE pigs, relative to low-FE pigs [60,61]. The KEGG pathway analysis indicates that the predicted target genes of miR-135a-5p are mainly enriched in thyroid hormone signaling pathway, insulin secretion, and cAMP signaling pathway. In addition, ELOVL7, a predicted target gene of miR-135a-5p, is down-regulated in liver of high-FE pigs. ELOVL7 is a key enzyme gene responsible for polyunsaturated fatty acid (PUFA) synthesis, and this gene has been reported to be associated with FE [6265].

The miR-130a plays a key role in the fine-tuning of liver metabolic processes, and its expression is significantly up-regulated in the livers of high-FE pigs. It’s has been reported that miR-130a can inhibit lipid accumulation by down-regulating FASN, and both RNA-seq and qRT-PCR data indicate this gene is up-regulated in liver of high-FE pigs [66,67]. The miR-24 has been identified to be upregulated in liver of High-FE pigs, and knockdown of miR-24 results in the reduced hepatic lipid accumulation and the decreased plasma triglycerides [68]. In addition, miR-125b, miR-185, and miR-26a have been reported to participate in the lipid accumulation in liver [6972].

Previous studies have shown that the DEGs between high-FE and low-FE pigs were significantly enriched in “carbohydrate metabolism” and “uptake and conversion of carbohydrates” [41]. In our study, the target genes of miR-135a-5p, miR-29a-3p, miR-15a-5p, miR-96-5p, miR-155-5p, miR-26a-5p, miR-185-5p, and miR-125b-5p were enriched in the GO terms of carbohydrate digestion and absorption. Sufficient evidence indicates that miRNAs (miR-135a, miR-29a, miR-15a, and miR-96) participate in glucose metabolism and glucose transporter 4 (GLUT4) pathway which plays a crucial role in insulin resistance and is closely associated with type 2 diabetes mellitus (T2DM) [7375]. The miR-29a can decrease fasting blood glucose levels by negatively regulating hepatic gluconeogenesis and inhibit insulin-stimulated glucose transport in adipocytes [76,77]. The miR-155 can positively regulate glucose uptake and glycolysis [78]. The miR-26a can regulate insulin signaling and metabolism of glucose and lipids [79]. The miR-185 in mice and diabetic patients is significantly downregulated, and this miRNA is associated with blood glucose [80]. The miR-125b can decrease glucose uptake and inhibit insulin signaling pathway [8183].

Metabolism of xenobiotics by cytochrome P450 and butanoate and tryptophan Metabolism have been found to influence FE [42]. Cytochrome P450 can regulate synthesis of lipids, steroids, and hormones, and the members of cytochrome P450 family have been found (CYP1A1, CYP2J2, CYP26A1) to be DE in liver of high-FE and low-FE pigs [32,84,85]. Butanoate is a dietary fiber metabolite and it is closely related to energy metabolism [86]. In this study, the target genes of miR-185, miR-29a, miR-135a, miR-130a, miR-125b, miR-26a, miR-15a, and miR-96 were enriched in metabolism pathways of xenobiotics by cytochrome P450; the target genes of miR-26a, miR-96, miR-155, miR-125b, and miR-24 were enriched in butanoate metabolism pathway; and the target genes of miR-130a, miR-26a, miR-96, miR-15a, miR-185, and miR-24 were enriched in tryptophan metabolism pathway.

CONCLUSION

Overall, a total of 212–221 known porcine miRNAs and 136–281 novel miRNAs were identified. The 14 miRNAs were identified to be significantly DE in the comparison of high-FE vs. low-FE pig liver, of which 12 miRNAs were homologous to human miRNAs. The KEGG pathway enrichment analysis indicated that these DE miRNAs might influence FE by regulating the pathways related to lipid metabolism, carbohydrate digestion and absorption, metabolism of xenobiotics by cytochrome P450, butanoate and tryptophan Metabolism. Our findings provide an insight into the role of miRNAs in the regulation of pig FE.

SUPPLEMENTARY MATERIALS

Supplementary Figures

jast-64-2-312-suppl1.docx

Supplementary Tables

jast-64-2-312-suppl2.xlsx

Competing interests

No potential conflict of interest relevant to this article was reported.

Funding sources

This work was supported by the Natural Science Foundation of Hubei Provincial Department of education (D20214301), the Natural Science Foundation of Jingmen City (2020YFYB045), the research fund from Jingchu University of Technology (QDJ201902, ZD202102), and the Natural Science Foundation of Hubei Province (2020CFB318).

Acknowledgements

Not applicable.

Availability of data and material

Upon reasonable request, the datasets of this study can be available from the corresponding author.

Authors’ contributions

Data curation: Miao Y, Fang F.

Formal analysis: Miao Y, Fu C.

Writing - original draft: Miao Y.

Writing - review & editing: Miao Y, Fu C, Liao M, Fang F

Ethics approval and consent to participate

All experimental protocols were approved by the Ethics Committee of Huazhong Agricultural University (HZAUMU2013-0005). All procedures involving tissue samples collection and animal care were performed according to the approved protocols and ARRIVE guidelines [87].

REFERENCES

1.

Jing L, Hou Y, Wu H, Miao Y, Li X, Cao J, et al. Transcriptome analysis of mRNA and miRNA in skeletal muscle indicates an important network for differential Residual Feed Intake in pigs. Sci Rep. 2015; 5:11953

2.

Fu L, Xu Y, Hou Y, Qi X, Zhou L, Liu H, et al. Proteomic analysis indicates that mitochondrial energy metabolism in skeletal muscle tissue is negatively correlated with feed efficiency in pigs. Sci Rep. 2017; 7:45291

3.

Koch RM, Swiger LA, Chambers D, Gregory KE. Efficiency of feed use in beef cattle. J Anim Sci. 1963; 22:486-94

4.

Kennedy BW, van der Werf JH, Meuwissen TH. Genetic and statistical properties of residual feed intake. J Anim Sci. 1993; 71:3239-50

5.

Herd RM, Arthur PF. Physiological basis for residual feed intake. J Anim Sci. 2009; 87:E64-71

6.

Nguyen NH, McPhee CP, Wade CM. Responses in residual feed intake in lines of Large White pigs selected for growth rate on restricted feeding (measured on ad libitum individual feeding). J Anim Breed Genet. 2005; 122:264-70

7.

Hoque MA, Kadowaki H, Shibata T, Oikawa T, Suzuki K. Genetic parameters for measures of the efficiency of gain of boars and the genetic relationships with its component traits in Duroc pigs. J Anim Sci. 2007; 85:1873-9

8.

Do DN, Strathe AB, Jensen J, Mark T, Kadarmideen HN. Genetic parameters for different measures of feed efficiency and related traits in boars of three pig breeds. J Anim Sci. 2013; 91:4069-79

9.

Montagne L, Gilbert H, Muller N, Le Floc’h N. Physiological response to the weaning in two pig lines divergently selected for residual feed intake. J Anim Physiol Anim Nutr. 2021

10.

Delpuech E, Aliakbari A, Labrune Y, Fève K, Billon Y, Gilbert H, et al. Identification of genomic regions affecting production traits in pigs divergently selected for feed efficiency. Genet Sel Evol. 2021; 53:49

11.

Faure J, Lefaucheur L, Bonhomme N, Ecolan P, Meteau K, Coustard SM, et al. Consequences of divergent selection for residual feed intake in pigs on muscle energy metabolism and meat quality. Meat Sci. 2013; 93:37-45

12.

Le Naou T, Le Floc’h N, Louveau I, Gilbert H, Gondret F. Metabolic changes and tissue responses to selection on residual feed intake in growing pigs. J Anim Sci. 2012; 90:4771-80

13.

Grubbs JK, Fritchen AN, Huff-Lonergan E, Dekkers JCM, Gabler NK, Lonergan SM. Divergent genetic selection for residual feed intake impacts mitochondria reactive oxygen species production in pigs. J Anim Sci. 2013; 91:2133-40

14.

Bartel DP. MicroRNAs: genomics, biogenesis, mechanism, and function. Cell. 2004; 116:281-97

15.

Carrington JC, Ambros V. Role of microRNAs in plant and animal development. Science. 2003; 301:336-8

16.

Al-Husseini W, Chen Y, Gondro C, Herd RM, Gibson JP, Arthur PF. Characterization and profiling of liver microRNAs by RNA-sequencing in cattle divergently selected for residual feed intake. Asian-Australas J Anim Sci. 2016; 29:1371-82

17.

De Oliveira PSN, Coutinho LL, Tizioto PC, Cesar ASM, de Oliveira GB, Diniz WJS, et al. An integrative transcriptome analysis indicates regulatory mRNA-miRNA networks for residual feed intake in Nelore cattle. Sci Rep. 2018; 8:17072

18.

Carvalho EB, Gionbelli MP, Rodrigues RTS, Bonilha SFM, Newbold CJ, Guimarães SEF, et al. Differentially expressed mRNAs, proteins and miRNAs associated to energy metabolism in skeletal muscle of beef cattle identified for low and high residual feed intake. BMC Genomics. 2019; 20:501

19.

Rui L. Energy metabolism in the liver. Compr Physiol. 2014; 4:177-97

20.

Shimizu N, Maruyama T, Yoshikawa N, Matsumiya R, Ma Y, Ito N, et al. A muscle-liver-fat signalling axis is essential for central control of adaptive adipose remodelling. Nat Commun. 2015; 6:6693

21.

Young JM, Cai W, Dekkers JCM. Effect of selection for residual feed intake on feeding behavior and daily feed intake patterns in Yorkshire swine. J Anim Sci. 2011; 89:639-47

22.

Barea R, Dubois S, Gilbert H, Sellier P, van Milgen J, Noblet J. Energy utilization in pigs selected for high and low residual feed intake. J Anim Sci. 2010; 88:2062-72

23.

Gilbert H, Billon Y, Brossard L, Faure J, Gatellier P, Gondret F, et al. Review: divergent selection for residual feed intake in the growing pig. Animal. 2017; 11:1427-39

24.

Mackowiak SD. Identification of novel and known miRNAs in deep-sequencing data with miRDeep2. Curr Protoc Bioinform. 2011; 36:12.10.1-15

25.

Fahlgren N, Sullivan CM, Kasschau KD, Chapman EJ, Cumbie JS, Montgomery TA, et al. Computational and analytical framework for small RNA profiling by high-throughput sequencing. RNA. 2009; 15:992-1002

26.

Hong L, Liu R, Qiao X, Wang X, Wang S, Li J, et al. Differential microRNA expression in porcine endometrium involved in remodeling and angiogenesis that contributes to embryonic implantation. Front Genet. 2019; 10:661

27.

Wagner GP, Kin K, Lynch VJ. Measurement of mRNA abundance using RNA-seq data: RPKM measure is inconsistent among samples. Theory Biosci. 2012; 131:281-5

28.

Friedländer MR, Mackowiak SD, Li N, Chen W, Rajewsky N. miRDeep2 accurately identifies known and hundreds of novel microRNA genes in seven animal clades. Nucleic Acids Res. 2012; 40:37-52

29.

Lorenz R, Bernhart SH, Höner zu Siederdissen C, Tafer H, Flamm C, Stadler PF, et al. ViennaRNA Package 2.0. Algorithms Mol Biol. 2011; 6:26

30.

Love MI, Huber W, Anders S. Moderated estimation of fold change and dispersion for RNA-seq data with DESeq2. Genome Biol. 2014; 15:550

31.

Audic S, Claverie JM. The significance of digital gene expression profiles. Genome Res. 1997; 7:986-95

32.

Zhao Y, Hou Y, Liu F, Liu A, Jing L, Zhao C, et al. Transcriptome analysis reveals that vitamin A metabolism in the liver affects feed efficiency in pigs. G3 (Bethesda). 2016; 6:3615-24

33.

Shannon P, Markiel A, Ozier O, Baliga NS, Wang JT, Ramage D, et al. Cytoscape: a software environment for integrated models of biomolecular interaction networks. Genome Res. 2003; 13:2498-504

34.

Dekkers JCM, Gilbert H. Genetic and biological aspect of residual feed intake in pigs. In: 9. World Congress on Genetics Applied to Livestock Production Aug; 2010, Leipzig, Germany 2010hal-01193545

35.

Hermesch S. Genetic improvement of lean meat growth and feed efficiency in pigs. Aust J Exp Agric. 2004; 44:1-9

36.

van Milgen J, Noblet J. Partitioning of energy intake to heat, protein, and fat in growing pigs. J Anim Sci. 2003; 81:E86-93

37.

Rajewsky N. microRNA target predictions in animals. Nat Genet. 2006; 38:S8-13

38.

Lkhagvadorj S, Qu L, Cai W, Couture OP, Barb CR, Hausman GJ, et al. Gene expression profiling of the short-term adaptive response to acute caloric restriction in liver and adipose tissues of pigs differing in feed efficiency. Am J Physiol Regul Integr Comp Physiol. 2010; 298:R494-507

39.

Chen Y, Gondro C, Quinn K, Herd RM, Parnell PF, Vanselow B. Global gene expression profiling reveals genes expressed differentially in cattle with high and low residual feed intake. Anim Genet. 2011; 42:475-90

40.

Ramayo-Caldas Y, Ballester M, Sánchez JP, González-Rodríguez O, Revilla M, Reyer H, et al. Integrative approach using liver and duodenum RNA-Seq data identifies candidate genes and pathways associated with feed efficiency in pigs. Sci Rep. 2018; 8:558

41.

Horodyska J, Hamill RM, Reyer H, Trakooljul N, Lawlor PG, McCormack UM, et al. RNA-Seq of liver from pigs divergent in feed efficiency highlights shifts in macronutrient metabolism, hepatic growth and immune response. Front Genet. 2019; 10:117

42.

Tizioto PC, Coutinho LL, Oliveira PSN, Cesar ASM, Diniz WJS, Lima AO, et al. Gene expression differences in Longissimus muscle of Nelore steers genetically divergent for residual feed intake. Sci Rep. 2016; 6:39493

43.

Fatima A, Lynn DJ, O’Boyle P, Seoighe C, Morris D. The miRNAome of the postpartum dairy cow liver in negative energy balance. BMC Genomics. 2014; 15:279

44.

Castaño C, Kalko S, Novials A, Párrizas M. Obesity-associated exosomal miRNAs modulate glucose and lipid metabolism in mice. Proc Natl Acad Sci USA. 2018; 115:12158-63

45.

Pirola CJ, Fernández Gianotti T, Castaño GO, Mallardi P, San Martino J, Mora Gonzalez Lopez Ledesma M, et al. Circulating microRNA signature in non-alcoholic fatty liver disease: from serum non-coding RNAs to liver histology and disease pathogenesis. Gut. 2015; 64:800-12

46.

Aryal B, Singh AK, Rotllan N, Price N, Fernández-Hernando C. MicroRNAs and lipid metabolism. Curr Opin Lipidol. 2017; 28:273-80

47.

Heo MJ, Kim TH, You JS, Blaya D, Sancho-Bru P, Kim SG. Alcohol dysregulates miR-148a in hepatocytes through FoxO1, facilitating pyroptosis via TXNIP overexpression. Gut. 2019; 68:708-20

48.

Esau C, Davis S, Murray SF, Yu XX, Pandey SK, Pear M, et al. miR-122 regulation of lipid metabolism revealed by in vivo antisense targeting. Cell Metab. 2006; 3:87-98

49.

Reddy AM, Zheng Y, Jagadeeswaran G, Macmil SL, Graham WB, Roe BA, et al. Cloning, characterization and expression analysis of porcine microRNAs. BMC Genomics. 2009; 10:65

50.

Andersson P, Gidlöf O, Braun OO, Götberg M, van der Pals J, Olde B, et al. Plasma levels of liver-specific miR-122 is massively increased in a porcine cardiogenic shock model and attenuated by hypothermia. Shock. 2012; 37:234-8

51.

Tang Z, Xu J, Yin L, Yin D, Zhu M, Yu M, et al. Genome-wide association study reveals candidate genes for growth relevant traits in pigs. Front Genet. 2019; 10:302

52.

Lin Y, Ding D, Huang Q, Liu Q, Lu H, Lu Y, et al. Downregulation of miR-192 causes hepatic steatosis and lipid accumulation by inducing SREBF1: novel mechanism for bisphenol A-triggered non-alcoholic fatty liver disease. Biochim Biophys Acta Mol Cell Biol Lipids. 2017; 1862:869-82

53.

Iguchi T, Sakurai K, Tamai S, Mori K. Circulating liver-specific microRNAs in cynomolgus monkeys. J Toxicol Pathol. 2018; 31:3-13

54.

Dong P, Mai Y, Zhang Z, Mi L, Wu G, Chu G, et al. MiR-15a/b promote adipogenesis in porcine pre-adipocyte via repressing FoxO1. Acta Biochim Biophys Sin. 2014; 46:565-71

55.

Ponsuksili S, Trakooljul N, Hadlich F, Haack F, Murani E, Wimmers K. Genetic architecture and regulatory impact on hepatic microRNA expression linked to immune and metabolic traits. Open Biol. 2017; 7:170101

56.

Chen Z, Qiu H, Ma L, Luo J, Sun S, Kang K, et al. miR-30e-5p and miR-15a synergistically regulate fatty acid metabolism in goat mammary epithelial cells via LRP6 and YAP1. Int J Mol Sci. 2016; 17:1909

57.

Zhao Y, Hou Y, Liu F, Liu A, Jing L, Zhao C, et al. Transcriptome analysis reveals that vitamin A metabolism in the liver affects feed efficiency in pigs. G3 (Bethesda). 2016; 6:3615-24

58.

Liao X, Song L, Zhang L, Wang H, Tong Q, Xu J, et al. LAMP3 regulates hepatic lipid metabolism through activating PI3K/Akt pathway. Mol Cell Endocrinol. 2018; 470:160-7

59.

Romao JM, Jin W, He M, McAllister T, Luo Guan L. MicroRNAs in bovine adipogenesis: genomic context, expression and function. BMC Genomics. 2014; 15:137

60.

Wei X, Cheng X, Peng Y, Zheng R, Chai J, Jiang S. STAT5a promotes the transcription of mature mmu-miR-135a in 3T3-L1 cells by binding to both miR-135a-1 and miR-135a-2 promoter elements. Int J Biochem Cell Biol. 2016; 77:109-19

61.

Chen C, Peng Y, Peng Y, Peng J, Jiang S. miR-135a-5p inhibits 3T3-L1 adipogenesis through activation of canonical Wnt/β-catenin signaling. J Mol Endocrinol. 2014; 52:311-20

62.

Zhang F, Ekine-Dzivenu C, Vinsky M, Basarab JA, Aalhus JL, Dugan MER, et al. Phenotypic and genetic relationships of residual feed intake measures and their component traits with fatty acid composition in subcutaneous adipose of beef cattle. J Anim Sci. 2017; 95:2813-24

63.

Crespo-Piazuelo D, Criado-Mesas L, Revilla M, Castelló A, Noguera JL, Fernández AI, et al. Identification of strong candidate genes for backfat and intramuscular fatty acid composition in three crosses based on the Iberian pig. Sci Rep. 2020; 10:13962

64.

Xu Y, Qi X, Hu M, Lin R, Hou Y, Wang Z, et al. Transcriptome analysis of adipose tissue indicates that the cAMP signaling pathway affects the feed efficiency of pigs. Genes. 2018; 9:336

65.

Zhang J, Zhang Y, Gong H, Cui L, Ma J, Chen C, et al. Landscape of loci and candidate genes for muscle fatty acid composition in pigs revealed by multiple population association analysis. Front Genet. 2019; 10:1067

66.

Yang WC, Guo WL, Zan LS, Wang YN, Tang KQ. Bta-miR-130a regulates the biosynthesis of bovine milk fat by targeting peroxisome proliferator-activated receptor gamma. J Anim Sci. 2017; 95:2898-906

67.

Liu J, Tang T, Wang GD, Liu B. LncRNA-H19 promotes hepatic lipogenesis by directly regulating miR-130a/PPARγ axis in non-alcoholic fatty liver disease. Biosci Rep. 2019; 39BSR20181722

68.

Ng R, Wu H, Xiao H, Chen X, Willenbring H, Steer CJ, et al. Inhibition of microRNA-24 expression in liver prevents hepatic lipid accumulation and hyperlipidemia. Hepatology. 2014; 60:554-64

69.

Wei LM, Sun RP, Dong T, Liu J, Chen T, Zeng B, et al. MiR-125b-2 knockout increases high-fat diet-induced fat accumulation and insulin resistance. Sci Rep. 2020; 10:21969

70.

Zhang ZC, Liu Y, Xiao LL, Li SF, Jiang JH, Zhao Y, et al. Upregulation of miR-125b by estrogen protects against non-alcoholic fatty liver in female mice. J Hepatol. 2015; 63:1466-75

71.

Wang XC, Zhan XR, Li XY, Yu JJ, Liu XM. MicroRNA-185 regulates expression of lipid metabolism genes and improves insulin sensitivity in mice with non-alcoholic fatty liver disease. World J Gastroenterol. 2014; 20:17914-23

72.

Ali O, Darwish HA, Eldeib KM, Abdel Azim SA. miR-26a potentially contributes to the regulation of fatty acid and sterol metabolism in vitro human HepG2 cell model of nonalcoholic fatty liver disease. Oxid Med Cell Longev. 2018; 2018:8515343

73.

Li Y, Li C, Yang M, Shi L, Tao W, Shen K, et al. Association of single nucleotide polymorphisms of miRNAs involved in the GLUT4 pathway in T2DM in a Chinese population. Mol Genet Genomic Med. 2019; 7e907

74.

Agarwal P, Srivastava R, Srivastava AK, Ali S, Datta M. miR-135a targets IRS2 and regulates insulin signaling and glucose uptake in the diabetic gastrocnemius skeletal muscle. Biochim Biophys Acta Mol Basis Dis. 2013; 1832:1294-303

75.

Guo Y, Li G, Li H, Huang C, Liu Q, Dou Y, et al. MicroRNA-15a inhibits glucose transporter 4 translocation and impairs glucose metabolism in L6 skeletal muscle via targeting of vesicle-associated membrane protein-associated protein A. Can J Diabetes. 2020; 44:261-6.E2

76.

Liang J, Liu C, Qiao A, Cui Y, Zhang H, Cui A, et al. MicroRNA-29a-c decrease fasting blood glucose levels by negatively regulating hepatic gluconeogenesis. J Hepatol. 2013; 58:535-42

77.

Bagge A, Clausen TR, Larsen S, Ladefoged M, Rosenstierne MW, Larsen L, et al. MicroRNA-29a is up-regulated in beta-cells by glucose and decreases glucose-stimulated insulin secretion. Biochem Biophys Res Commun. 2012; 426:266-72

78.

Kim S, Lee E, Jung J, Lee JW, Kim HJ, Kim J, et al. microRNA-155 positively regulates glucose metabolism via PIK3R1-FOXO3a-cMYC axis in breast cancer. Oncogene. 2018; 37:2982-91

79.

Fu X, Dong B, Tian Y, Lefebvre P, Meng Z, Wang X, et al. MicroRNA-26a regulates insulin sensitivity and metabolism of glucose and lipids. J Clin Invest. 2015; 125:2497-509

80.

Bao L, Fu X, Si M, Wang Y, Ma R, Ren X, et al. MicroRNA-185 targets SOCS3 to inhibit beta-cell dysfunction in diabetes. PLOS ONE. 2015; 10e0116067

81.

Zhang G, Zhou S, Yang Q, Liu F. MicroRNA-125b reduces glucose uptake in papillary thyroid carcinoma cells. Oncol Lett. 2020; 20:2806-10

82.

Du X, Li X, Chen L, Zhang M, Lei L, Gao W, et al. Hepatic miR-125b inhibits insulin signaling pathway by targeting PIK3CD. J Cell Physiol. 2018; 233:6052-66

83.

Tili E, Michaille JJ, Luo Z, Volinia S, Rassenti LZ, Kipps TJ, et al. The down-regulation of miR-125b in chronic lymphocytic leukemias leads to metabolic adaptation of cells to a transformed state. Blood. 2012; 120:2631-8

84.

Anzenbacher P, Anzenbacherová E. Cytochromes P450 and metabolism of xenobiotics. Cell Mol Life Sci. 2001; 58:737-47

85.

Gibbons GF. The role of cytochrome P450 in the regulation of cholesterol biosynthesis. Lipids. 2002; 37:1163-70

86.

Sauer J, Richter KK, Pool-Zobel BL. Physiological concentrations of butyrate favorably modulate genes of oxidative and metabolic stress in primary human colon cells. J Nutr Biochem. 2007; 18:736-45

87.

Percie du Sert N, Ahluwalia A, Alam S, Avey MT, Baker M, Browne WJ, et al. Reporting animal research: explanation and elaboration for the ARRIVE guidelines 2.0. PLOS Biol. 2020; 18e3000411